An assessment of the correlation between
early postinfarction pyramidal tract Wallerian
degeneration and nerve function recovery
using diffusion tensor imaging
A.H. Guo1*, F.L. Hao1*, L.F. Liu2, B.J. Wang1 and X.F. Jiang2
1Department of Neurology, Xianyang Hospital of Yan’an University, Xianyang, China
2Department of Medical Imaging, Xianyang Hospital of Yan’an University, Xianyang, China
*These authors contributed equally to this study. Corresponding author: L.F. Liu
E-mail: [email protected] Genet. Mol. Res. 16 (1): gmr16019035 Received July 27, 2016
Accepted November 22, 2016 Published January 23, 2017
DOI http://dx.doi.org/10.4238/gmr16019035
Copyright © 2017 The Authors. This is an open-access article distributed under the terms of the Creative Commons Attribution ShareAlike (CC BY-SA) 4.0 License.
recovery of the nervous system was further analyzed to assess the feasibility of using a DTI scan in the evaluation of functional recovery of the nervous system in patients with cerebral infarction. DTI may be useful in detecting signals of early postinfarction pyramidal tract WD and is useful for the evaluation of postinfarction neurological recovery. Cerebral lesions were detected using MRI in all patients. It was found that in some patients, the FA value of the ipsilateral pyramidal tract on DTI was decreased as early as day 3 after the onset of infarction and in all patients by day 7. Subsequent correlation studies showed that the FA value of the ipsilateral pyramidal tract on day 13 was negatively correlated with the National Institutes of Health Stroke Scale score, but positively correlated with the Barthel Index, motricity index, and modified Rankin Scale scores.
Key words: Cerebral infarction; Pyramidal tract; Neurological recovery; Diffusion tensor imaging
INTRODUCTION
Pyramidal tract Wallerian degeneration (WD) was first discovered by Waller et al. in the brain tissue of patients with brain injury (Waller, 1850). It refers to the anterograde degenerative process of the distal axon and myelin following damage to the neuron or proximal axon (Conforti et al., 2014). Secondary pyramidal tract WD is primarily caused by cerebral infarction and may also be related to stroke, traumatic brain injury, and brain malignancy (Jones et al., 2013). Early diagnosis and evaluation of pyramidal tract WD is essential for neurological recovery and improving prognosis in patients with cerebral infarction (Taraschenko et al., 2015). In the past, pyramidal tract WD was usually diagnosed using magnetic resonance imaging (MRI) (Liu et al., 2012). However, the application of MRI in the early diagnosis of pyramidal tract WD is limited because of its low sensitivity for the detection of signal changes in early WD (Carota and Dinacci, 2012).
MATERIAL AND METHODS
Materials
Study subjects
A total of 23 patients (14 men, 9 women) with acute cerebral infarction who were admitted to Xianyang Hospital of Yan’an University between March 2014 to January 2015 were included in this study, with a mean age of 56.7 ± 5.1 years (mean ± standard deviation) (range: 47-68 years). Ten healthy adults (7 men, 3 women) aged 50 to 65 years (mean age: 57.5 ± 5.2 years) with normal findings following examination of the central nervous system and brain MRI were selected as controls.
Inclusion criteria
The inclusion criteria were as follows: 1) first-ever acute cerebral infarction in patients with solitary cerebral infarct; 2) scanning within 7 days of onset; 3) aged 45-70 years old; 4) no previous history of infarction; and 5) no previous history of neurological diseases or mental illness. All patients underwent a brain MRI scan and the detected lesions were consistent with the clinical symptoms. The typical manifestations of WD were detected on MRI follow-up. All patients received conventional inpatient therapy in our hospital’s Department of Neurology. This study was approved by the Ethics Committee in Xianyang Hospital of Yan’an University. All subjects were required to provide informed consent before enrolling in the study.
Experimental methods
Diagnostic indices
DTI radiographic indices included fractional anisotropy (FA) and mean diffusivity (MD) (Walker et al., 2016). Indices of nervous system function included the National Institutes of Health Stroke Scale (NIHSS) (Jeyaseelan et al., 2015), Barthel Index (BI) in assessing the activities of daily living (Chen et al., 2013), modified Rankin Scale (mRS) (McArthur et al., 2013), and motricity index (MI) (Fayazi et al., 2012).
Examination methods
All patients underwent a conventional MRI scan using a Philips Gyroscan ACS-NT Powertrack 6000 1.5 T MR imaging system (Best, NL). Patients wearing a standard head coil were lying in either a supine or a prone position. The scanned area ranged from the vertex to the lower edge of the medulla oblongata. Axial spin echo (SE) T1 [repetition time (TR)/echo time (TE): 250/3 ms], fast spin-echo T2-weighted (TR/TE: 4100/91 ms), and fluid attenuation inversion recovery (FLAIR) sequences (TR/TE: 6500/94 ms) were generated. The following parameters were set: diffusion-weighted images (DWI) with a maximum proliferation-sensitive factor b value of 1000 s/mm2, field of view (FOV), 230 x 230 mm; matrix size, 256 x
FOV, 230 x 230 mm; matrix size, 256 x 256; slice thickness, 3 mm; number of layers, 42; layer spacing, 1 mm; and TR/TE, 9825/131 ms. Diffusion was applied along at least six non-collinear directions with an axial DWI maximum proliferation-sensitive factor b value of 700 s/mm2 (George et al., 2014).
DTI data analysis
The original images on the DTI scan were analyzed using the FMRIB Software Library (FSL, http://www.fmrib.ox.ac.uk/fsl). Regions of interest (ROIs) were defined on the original images including the cerebral infarct, cerebral peduncle, and posterior limb of the ipsilateral internal capsule, as well as the corresponding region of the contralateral hemisphere. Mean diffusivity (MD) and fractional anisotropy (FA) values of each ROI were obtained. FA and MD values of the pyramidal tract were calculated as the mean values of the FA and MD of the cerebral peduncle and posterior limb of the internal capsule, respectively. FA and MD values of the cerebral peduncle, posterior limb of the internal capsule, and pyramidal tract in the control group were also determined (Knorr et al., 2013).
Statistical analysis
Data were analyzed using SPSS 17.0 and are represented as mean ± standard deviation. Differences in FA and MD values between groups were compared using the unpaired Student
t-test. Pearson correlation was performed for the correlation analysis. P < 0.05 was considered statistically significant.
RESULTS
MRI scan
Clear cerebral lesions were detected in all patients (Figure 1). Of the 23 patients, the infarct was located in the right hemisphere in 15 cases and in the left hemisphere in 8 cases. All cerebral lesions showed low signal intensity on T1-weighted images and high signal intensity on T2-weighted images, FLAIR, and DWI. A normal signal was detected in the pyramidal tract using a conventional MRI scan at 3 days after the infarction.
DTI scan
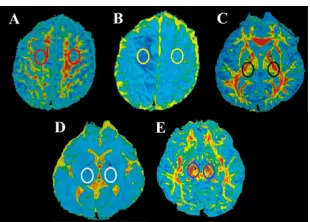
All patients underwent DTI examination, and data were analyzed using the FSL package. Representative images of the cerebral lesion, cerebral peduncle, and posterior limb of the internal capsule on DTI are shown in Figure 2. The FA signal in cerebral lesions was markedly lower compared with the corresponding contralateral region (red circles in Figure 2A). The FA of cerebral lesions (0.266 ± 0.069) was significant lower than that of the corresponding contralateral region (0.523 ± 0.078, P < 0.01). The MD signal in cerebral lesions was also obviously reduced compared with the corresponding contralateral region (yellow circles in Figure 2B). The MD value of cerebral lesion (6.104 ± 1.023) was significant lower than that of the corresponding contralateral region (8.011 ± 1.182, P < 0.01). The FA signal in the posterior limb of the internal capsule near the cerebral lesion was also obviously lower compared with the corresponding contralateral region (black circles in Figure 2C). The FA value of the cerebral lesion (0.604 ± 0.089) was significant lower than that of the corresponding contralateral region (0.694 ± 0.088, P < 0.05). There was no obvious difference in the MD signal of the posterior limb of the internal capsule on both sides (white circles in Figure 2D). Moreover, the FA signal of the cerebral peduncle near the cerebral lesion was significantly reduced compared with the corresponding contralateral region (purple circles in Figure 2E, P < 0.05). The FA and MD values of the cerebral lesion, cerebral peduncle, posterior limb of the internal capsule, and pyramidal tract, as well as the corresponding contralateral regions are listed in Table 1.
Figure 2. DTI images of the brain of cerebral infarction patients at day 13 since onset. A. FA of cerebral infarct. ROI is marked by red circles. B. MD of cerebral infarct. ROI is marked by yellow circles. C. FA of the posterior limb of the internal capsule. ROI is marked by black circles. D. MD of the posterior limb of the internal capsule. ROI is marked by white circles. E. FA of the cerebral peduncle. ROI is marked by purple circles. DTI examination in patients.
ROI = region of interest; FA = fractional anisotropy; MD = mean diffusivity. Values are reported as means ± standard deviation.
Table 1. Fractional anisotropy and mean diffusivity for different regions of interest in both cerebral hemispheres on diffusion tensor imaging.
ROI FA value MD value
Ipsilateral Contralateral Ipsilateral Contralateral
Cerebral lesion 0.266 ± 0.069 0.523 ± 0.078 6.104 ± 1.023 8.011 ± 1.182
(0.158-0.375) (0.455-0.605) (0.512-0.691) (7.210-9.191) Posterior limb of the internal capsule 0.604 ± 0.089 0.694 ± 0.088 7.403 ± 1.232 7.504 ± 1.013 (0.512-0.691) (0.583-0.765) (6.512-8.297) (6.712-8.621)
Cerebral peduncle 0.612 ± 0.068 0.692 ± 0.083 8.606 ± 1.529 8.732 ± 1.498
(0.524-0.702) (0.617-0.771) (7.514-9.611) (8.412-9.731)
Pyramidal tract 0.608 ± 0.079 0.673 ± 0.086 8.307 ± 1.603 8.634 ± 1.689
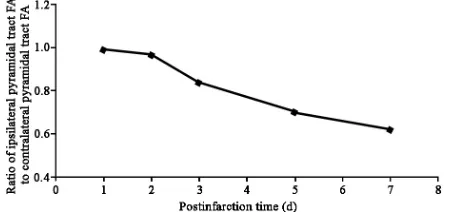
All 23 patients underwent a DTI scan 1, 2, 3, 5, and 7 days after disease onset. It was found that the FA value of the ipsilateral pyramidal tract in two patients on day 3 had decreased by 18% compared with day 1. The FA value in 74% of patients (17/23) was substantially decreased by day 5 and the FA value in all patients was reduced by day 7. The ratio of the FA value of the ipsilateral pyramidal tract to that of the contralateral pyramidal tract at different times is shown in Figure 3, demonstrating that the FA of the ipsilateral pyramidal tract gradually decreased over time.
Figure 3. Changes of the ratio of ipsilateral pyramidal tract FA contralateral pyramidal tract FA during postinfarction.
The nervous system function of each patient was evaluated using the NIHSS, BI, MI, and mRS and the correlation between the neurological scores and FA values of different regions on DTI was analyzed. It was shown that FA value of the posterior limb of the internal capsule on day 13 was negatively correlated with the NIHSS score on day 90 (r = -0.631, P = 0.017), but was positively correlated with BI (r = 0.526, P = 0.041) and MI scores (r = 0.542, P = 0.036). The FA value of the cerebral peduncle was negatively correlated with NIHSS (r = -0.596, P = 0.020) on day 13 and mRS scores (r = -0.679, P = 0.005) on day 90, but was positively correlated with BI (r = 0.678, P = 0.007) and MI scores (r = 0.646, P = 0.009) on day 90. Moreover, the FA value of the ipsilateral pyramidal tract on day 13 was negatively correlated with the NIHSS score (r = -0.655, P = 0.013) on day 90, but was positively correlated with BI (r = 0.625, P = 0.013), mRS (r = 0.663, P = 0.011), and MI scores (r = 0.633, P = 0.015).
DISCUSSION
2013). Pyramidal tract WD may cause varying degrees of dysfunction in motor and sensory systems, language, and intelligence. Therefore, our study is of great significance for the early diagnosis of secondary pyramidal tract WD, improvement of treatment efficacy, and reduction of morbidity and mortality (Taraschenko et al., 2015).
DTI requires continuous application of diffusion-sensitive gradient magnetic field scanning in a plurality of non-collinear directions (from a minimum of six to up to a hundred directions). Indices can be calculated from DTI include MD, which represents the average intensity of water diffusion, and FA, which denotes the directivity of water diffusion (Hageman et al., 2009). The unique membrane structure of neurons can effectively prevent perpendicular water diffusion because of highly uniform orientation of white matter fiber tracts (Fan et al., 2014). During early stages of pyramidal tract WD, the demyelination of nervous tissue and axonal degeneration may occur, leading to hydrophilicity and changes in structural integrity, which can be detected by highly sensitive DTI scans. Furthermore, the proliferation of neuroglial cells in the damaged area also results in decreased FA values on DTI, confirming the diagnosis of WD (Freeman, 2014). However, the MD values did not change significantly during early pyramidal tract WD probably because water diffusion was restricted by the local accumulation of the cellular debris of neurons. In the late stages of WD, cellular debris are removed, leading to increased water diffusion and subsequent slightly enhanced MD values (Maxwell et al., 2015). Our results were consistent with a previous study that revealed the FA value of the ipsilateral pyramidal tract in cerebral infarction patients on DTI was obviously decreased compared with the contralateral pyramidal tract on day 5 after onset, whereas there was no significant difference in MD between the two regions (George et al., 2014).
Several studies have suggested that the severity of early pyramidal tract WD has important implications for the subsequent recovery of neurological function (Hsu and Stevenson, 2015). Yeo and Jang (2013) have demonstrated a negative correlation between the FA values of WD patients on DTI and NIHSS score on day 180. However, WD was not quantitatively assessed in any of these studies. Miyai et al. (2001) believed that pyramidal tract WD only delays the recovery process of nerve function without affecting the outcome of neurological function. Our study has provided some evidence for the elucidation of the relationship between the DTI results of early pyramidal tract WD and postinfarction functional recovery of the nervous system. However, further studies are required to confirm these findings in the future.
Although DTI is suitable for the early non-invasive diagnosis of pyramidal tract WD, there are several unclarified issues. For instance, it remains unclear whether DTI results are consistent with the pathological progression. The association between changes in the DTI indices of pyramidal tract WD and local cellular changes also needs further investigation (Pujol et al., 2015). Nevertheless, with the development of DTI technology, it shall play an important role in the diagnosis and prognosis of pyramidal tract WD, as well as evaluation of drug efficacy for the treatment of the disease.
Conflicts of interest
The authors declare no conflict of interest.
ACKNOWLEDGMENTS
REFERENCES
Carota A and Dinacci D (2012). Descending corticospinal tract Wallerian degeneration after stroke: an old sign, a new prognostic marker? Acta Neurol. Belg. 112: 115-116. http://dx.doi.org/10.1007/s13760-012-0033-1
Chen C, Naidoo N, Er B, Cheong A, et al. (2013). Factors associated with nursing home placement of all patients admitted for inpatient rehabilitation in Singapore community hospitals from 1996 to 2005: a disease stratified analysis. PLoS One 8: e82697. http://dx.doi.org/10.1371/journal.pone.0082697
Conforti L, Gilley J and Coleman MP (2014). Wallerian degeneration: an emerging axon death pathway linking injury and disease. Nat. Rev. Neurosci. 15: 394-409. http://dx.doi.org/10.1038/nrn3680
Fan Q, Nummenmaa A, Witzel T, Zanzonico R, et al. (2014). Investigating the capability to resolve complex white matter structures with high b-value diffusion magnetic resonance imaging on the MGH-USC Connectom scanner. Brain Connect. 4: 718-726. http://dx.doi.org/10.1089/brain.2014.0305
Fayazi M, Dehkordi SN, Dadgoo M and Salehi M (2012). Test-retest reliability of Motricity Index strength assessments for lower extremity in post stroke hemiparesis. Med. J. Islam. Repub. Iran 26: 27-30.
Freeman MR (2014). Signaling mechanisms regulating Wallerian degeneration. Curr. Opin. Neurobiol. 27: 224-231.
http://dx.doi.org/10.1016/j.conb.2014.05.001
George E, Heier L, Kovanlikaya I and Greenfield J (2014). Diffusion tensor imaging of pyramidal tract reorganization after pediatric stroke. Childs Nerv. Syst. 30: 1135-1139. http://dx.doi.org/10.1007/s00381-013-2351-x
Hageman NS, Toga AW, Narr KL and Shattuck DW (2009). A diffusion tensor imaging tractography algorithm based on Navier-Stokes fluid mechanics. IEEE Trans. Med. Imaging 28: 348-360. http://dx.doi.org/10.1109/TMI.2008.2004403
Hsu M and Stevenson FF (2015). Wallerian degeneration and recovery of motor nerves after multiple focused cold therapies. Muscle Nerve 51: 268-275. http://dx.doi.org/10.1002/mus.24306
Huang LA, Ling XY, Li C, Zhang SJ, et al. (2014). Study of white matter at the centrum semiovale level with magnetic resonance spectroscopy and diffusion tensor imaging in cerebral small vessel disease. Genet. Mol. Res. 13: 2683-2690. http://dx.doi.org/10.4238/2014.April.8.11
Jeyaseelan RD, Vargo MM and Chae J (2015). National Institutes of Health Stroke Scale (NIHSS) as an early predictor of poststroke dysphagia. PM R 7: 593-598. http://dx.doi.org/10.1016/j.pmrj.2014.12.007
Jones KC, Hawkins C, Armstrong D, Deveber G, et al. (2013). Association between radiographic Wallerian degeneration and neuropathological changes post childhood stroke. Dev. Med. Child Neurol. 55: 173-177. http://dx.doi.org/10.1111/ dmcn.12010
Knorr Z, Leblond P, Baroncini M, Pruvo JP, et al. (2013). Diffusion tensor imaging localization of the pyramidal tract and spectroscopy in diencephalic pilocytic astrocytoma: a case report. J. Neuroradiol. 40: 68-70. http://dx.doi. org/10.1016/j.neurad.2011.12.002
Liu X, Tian W, Qiu X, Li J, et al. (2012). Correlation analysis of quantitative diffusion parameters in ipsilateral cerebral peduncle during Wallerian degeneration with motor function outcome after cerebral ischemic stroke. J. Neuroimaging 22: 255-260. http://dx.doi.org/10.1111/j.1552-6569.2011.00617.x
Maeshima S, Osawa A, Nishio D, Hirano Y, et al. (2013). Diffusion tensor MR imaging of the pyramidal tract can predict the need for orthosis in hemiplegic patients with hemorrhagic stroke. Neurol. Sci. 34: 1765-1770. http://dx.doi. org/10.1007/s10072-013-1330-z
Mascalchi M, Toschi N, Giannelli M, Ginestroni A, et al. (2015). Progression of microstructural damage in spinocerebellar ataxia type 2: a longitudinal DTI study. AJNR Am. J. Neuroradiol. 36: 1096-1101. http://dx.doi.org/10.3174/ajnr. A4343
Maxwell WL, Bartlett E and Morgan H (2015). Wallerian degeneration in the optic nerve stretch-injury model of traumatic brain injury: a stereological analysis. J. Neurotrauma 32: 780-790. http://dx.doi.org/10.1089/neu.2014.3369
McArthur K, Beagan ML, Degnan A, Howarth RC, et al. (2013). Properties of proxy-derived modified Rankin Scale assessment. Int. J. Stroke 8: 403-407. http://dx.doi.org/10.1111/j.1747-4949.2011.00759.x
Miyai I, Suzuki T, Mikami A, Kubota K, et al. (2001). Patients with capsular infarct and Wallerian degeneration show persistent regional premotor cortex activation on functional magnetic resonance imaging. J. Stroke Cerebrovasc. Dis. 10: 210-216. http://dx.doi.org/10.1053/jscd.2001.30731
Pires P, Santos A, Vives-Gilabert Y, Webb SM, et al. (2015). White matter alterations in the brains of patients with active, remitted, and cured cushing syndrome: a DTI study. AJNR Am. J. Neuroradiol. 36: 1043-1048. http://dx.doi. org/10.3174/ajnr.A4322
Pujol S, Wells W, Pierpaoli C, Brun C, et al. (2015). The DTI challenge: Toward standardized evaluation of diffusion tensor imaging tractography for neurosurgery. J. Neuroimaging 25: 875-882 http://dx.doi.org/10.1111/jon.12283. Samartzis L, Dima D, Fusar-Poli P and Kyriakopoulos M (2014). White matter alterations in early stages of schizophrenia:
Taraschenko OD, Nichter C and Pugh JA (2015). Early Wallerian degeneration in a neonate with middle carotid artery stroke. Pediatr. Neurol. 52: 252-253. http://dx.doi.org/10.1016/j.pediatrneurol.2014.10.025
Waller A (1850). Experiments on the Section of the Glossopharyngeal and Hypoglossal Nerves of the Frog, and Observations of the Alterations Produced Thereby in the Structure of Their Primitive Fibres. Philos. Trans. R. Soc. Lond. 140: 423-429. http://dx.doi.org/10.1098/rstl.1850.0021
Walker L, Chang LC, Nayak A, Irfanoglu MO, et al.; Brain Development Cooperative Group (2016). The diffusion tensor imaging (DTI) component of the NIH MRI study of normal brain development (PedsDTI). Neuroimage 124 (Pt B): 1125-1130. http://dx.doi.org/10.1016/j.neuroimage.2015.05.083