STUDIES ON STABILITY OF SUGAR BEET GENOTYPES UNDER OLD AND NEW RECLAIMED LANDS
1
Shalaby N.M.S., 2I.E El-Beially, A.H.S. 3Al-Labbody and 4S .H.M Abd- El- Haleem
1
Var. Maintenance Res. Depts., Sugar Crops Res. Inst. Agric. Res. Center, Egypt, 2Faculty of Agriculture, Al-Azhar University, Cairo, Egypt, 3Breed and Gen., Res. Depts., Sugar Crops
Res. Inst. Agric. Res. Center, Giza, Egypt, 4Faculty of Agriculture, Al-Azhar University, Assiut, Egypt.
ABSTRACT:
The stability measures are useful in characterizing genotypes by showing their relative performance in various environments. Ten sugar beet genotypes were evaluated across eight different environments in old lands and four environments in new land reclaimed with two sowing dates and two locations. Two years to study their yield potential and stability. Four statistical parameters (Wricke’s Ecovalence, Shukla’s (two measures), kang and Coefficient of variation) were used for determining yield and other traits stability of the genotypes. Highly significant differences due to genotypes (G) in old land and all environments for all studied traits except sucrose % in combined data were found. Environments (E) and GxE interaction had the same trend in all lands and combined data except sucrose % in old land, which is suggesting differential responses of the genotypes. Results showed that the statistics parameters were differed in their efficiency for determining the true stable genotypes. But all proposed parameters were in line for determining stability of G4 in old land for root yield and sucrose yield and
over all the environments with considering mean yield, so it could be recommended for growing under conditions of old land and G6 for root yield and G3 for sugar yield
in new reclaimed land. Concerning sucrose (%), the genotype G9 in old land and the
genotypes (G4, G5, G6, G9 and G10) concerning yields in new reclaimed land were
recorded by all proposed parameters (C.V., 2i, S2i, Eco. and Ysi) for stability. So they could be recommended for growing under these conditions. The relative small value for the heritability in all traits studied means that the large effect by environmental on the studied traits.
INTRODUCTION:
Sugar beet (Beta vulgaris L.) provides about 40% of the world sugar production ranked second sugar resource after sugar cane in Egypt. The importance of sugar beet crop doesn’t only come from its ability to grow in the newly reclaimed lands but also from giving high sugar recovery. In addition the growing period of sugar beet is about half than sugar cane.
Successful new varieties must show high performance for yield and other
genotype x environment interaction sum of squares. If small ecovalence values are desired, this may be called an agronomic concept of stability, for it describes properties desirable in crop production. Shukla (1972) developed an unbiased estimate of stability variance of the ith genotype
(
i2)
and also a criterion for testing the significance of i2
to determine whether or not a genotype was stable Shukla’s method can be extended to use a covariate/covariates to remove its/ their linear effect from GE interaction. The remainder of GE interaction variance can be assigned to each cultivar (S2i parameter)
and the significance of each component can be tested. The statistic
S
i2 (Shukla, 1972) was also well rank related withS
di2. The yield-stability statistic (YSi) has developedby Kang (1993) for simultaneous selection for yield and stability. Francis and Kannenberg (1978) in which the yield of each entry averaged over environments were plotted against its coefficient of variation (CV) over environments. A stable genotype in this case is one with low average coefficient of variation. Kang et
al., (1987) reported on the relationship between Shukla’s (1972) stability variance and Wricke’s (1962) ecovalence and concluded that these measures identically ranked cultivars for stability (rank correlation coefficient = 1.00). These types of measures are useful to breeders and agronomists because they provide contribution of each genotype in a test to total GE interaction. Kang and Magari (1996) discussed new developments in phenotypic stability analysis; Kang (1988, 1993) integrate yield and stability into one statistic that can be used as a selection criterion. An universally acceptable selection criterion takes GE interaction into
consideration does not exist (Kang and Magari, 1995).
Whenever an interaction is significant, the use of main effects (e.g., overall genotype means across environments) is questionable. Researchers need a statistic that provides a measure of stability or consistency of performance across a range of environments, particularly one that reflects the contribution of each genotype to the total GE interaction. Recently, Kang (1993) developed a yield - stability (Ysi)
statistic to be used as a selection criterion when GE interaction is significant.
There is worldwide interest among plant breeders, geneticists and production agronomists in genotype X environment (GE) interaction. A stability analysis is often conducted to estimate and interpret GE interactions. It has been observed in sugar beet by various authors Gandorah and Refay (1994), in Saudi Arabia, Weber and Muller (1996), in Germany, AI-Jbawi, (2000), Shalaby (2003) and Abd El-Aal and Mohamed, (2005) in Egypt.
The objectives of this study were to increase sugar beet productivity and adaptability under different conditions by identifying and developing genotypes that are more adapted and more stable in production under these harsh environments and to study the stability parameters of ten genotypes of sugar beet grown at different planting dates at three locations and two seasons.
MATERIALS AND METHODS
data of locations and seasons was collected (Table-3). Sugar beets10 varieties were sown and planting dates were 25th Oct. and 25th Nov. Stability statistics were calculated for each of the four methods Wricke’s
Ecovalence, Shukla’s (two measures), kang, and Coefficient of variation).
The monogerm and multigerm geno-types were used in this study. A list of these genotypes and the country of the origin are presented in Table-1.
Table-1: Identification of genotypes used, classification (N, E and Z), origin, and the important
agronomic characteristics.
Genotypes Type Origin Agronomic traits
Monte Bianco G1 E Germany
Root yield high and Sugar content are medium
Farida G2 E Holland
Oscar poly G3 E Germany
Lp 12 G4 E France
Kawemira G5 N Germany
Root yield and Sugar content are normal
Deprezpoly N G6 N France
Samba G7 N Holland
Carola G8 Z Germany
Root yield and Sugar content are high
Dema poly G9 Z France
Lp 13 G10 Z France
Mechanical and chemical analyses of the soil at experimental locations were carried out according to Piper (1955) and presented in Table (2).
Table-2: The properties of the soil at three investigated (Kafr,El Sheikh, El Dakahlia and El Fayoum)
locations.
Soil Sample
Particle size distribution
Textural Available
Nitrogen
SAND SILT Clay CaCo3
E.C mmhos
/cm 25C
o Soil PH
paste
% % % Class P.P.M %
2004 2005
K. El Sheikh 25.0 28.5 46.5 Clay 37.1 4.5 1.3 8.8
El Dakahlia 25.3 33.4 41.3 Clay 29.5 3.3 0.8 8.3
EL FAYOUM 52.0 23.0 25.0 Sandy
loam
10 36.50 10.81 8.2
2005 2006
K. El Sheikh 26.1 27.1 46.0 Clay 38.0 3.4 1.4 8.6
El Dakahlia 26.0 33.1 40.0 Clay 30.1 3.1 0.9 8.4
EL FAYOUM 50.0 24.0 26.0 Sandy
loam
8 36.40 11.00 8.5
A split-plot design with three replications was maintained for each location. Planting dates were assigned to the main-plots, while genotypes occupied the sub-plots. The area of each sub-plot size was 21 m2 (1/200 fad.), which consisted in 6 ridges 7 meters in length and 50 cm in width. Spacing between hills were 20 cm. Agronomic cultural practices were carried out as usual to assure optimum production.
Beetroots were harvested after 210 days of sowing ±2 days between locations.
Twelve environments (Eight in old lands and four in newrreeccllaaiimmeed land) were d
used as follows: E1, the first season in the
first sowing date at K. El Sheikh, E2 the
first season in the second sowing date at K. El Sheikh, E3 the second season in the first
sowing date at K. El Sheikh. E4 the second
Sheikh, E5 the first season in the first
sowing date at El Dakahlia, E6 the first
season in the second sowing date at El Dakahlia, E7 the second season in the first
sowing date at El Dakahlia and E8 the second season in the second sowing date at El Dakahlia: E9, the first season in the first
sowing date at El Fayoum,E10 the first
season in the second sowing date at El Fayoum, E11 the second season in the first
sowing date at El Fayoum and E12 the
second season in the second sowing date at El Fayoum. The studied traits were root yield/(ton/Fadden), sugar yield (ton/ Fadden) and Sugar %.
S
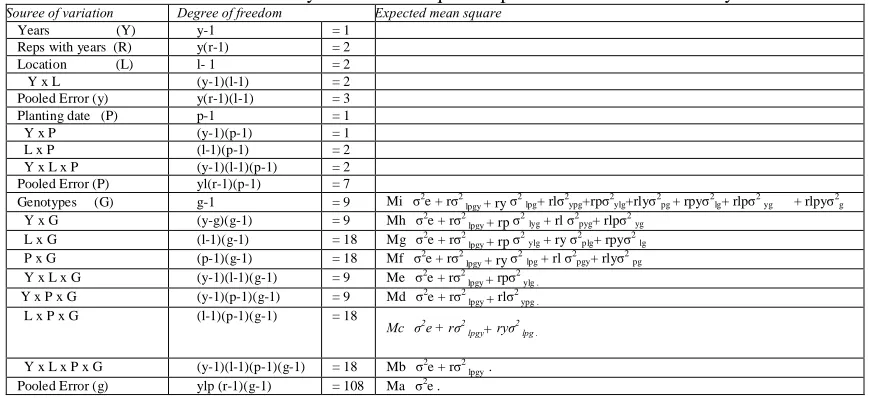
Sttaattiissttiiccaallaannaallyyssiiss: Plot means were used for statistical analysis. Data from each macro environment (combinations of years and locations) were analyzed and Barteltt’s test for heterogeneity of error variances across environments indicated that error terms were homogeneous. In the combined analysis across environmental effect has assumed to be fixed. Analysis of variance was computed for each trait in each location. A combined analysis for the three locations was done according to Gomez and Gomez (1984). The form of the variance analysis and the mean square expectations from which estimates of variance components were obtained is presented in Table-4. Separate estimates of the components of variation in each mean square expectation were calculated to evaluate the magnitude of the different effects .The estimates of these variance components and the expected composition of the mean squares were determined by the procedures described by Miller and Robenson (1959).
RESULTS AND DISCUSION
1- Analysis of variance and genotype
performance: Mean squares of the
environments, genotypes, their interactions
significant for all the studied traits except for sucrose % while the differences between the environments were significant for all traits studied. The interaction between genotypes (G) and environments (E) were found to be significant for all the studied traits. This indicates that genotypes interacted differently with the environ-ments. The partitioning of the G x E interaction variance into components, heterogeneity or nonadditivity and residual for the three traits studied is also shown in Table-5. The residual represents variation after the differential effect of a covariate (differential fertility, cultural practices at different environments) has been removed. The residual was significant for all traits studied. Similar results have obtained by Gherman and Kavots (1983) in Romania, Abo El-Ghait (1993) Al-Jbawi (2000) in Egypt and Gandorah and Refay (1994) in Saudi Arabia. They found that Genotypes x environment interaction had a significant effect on root fresh weight/plant, and sugar yield/fad, but insignificant on sucrose %.
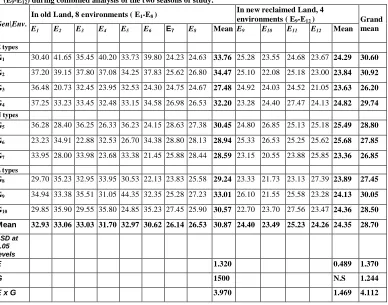
For root yield (ton/fed) in old land, the average of the genotypes was 30.87 ton /fed. The highest values recorded for the genotype G2 (34.47 ton/fed) while the
lowest value recorded for the genotype G3
27.48 ton / fed Table-6. The average of the environments was 30.78 ton /fed, the environment E2 and E3 recorded the highest
values of root yield (33.06 and 33.03 ton /fed) while the lowest value recorded for the E7 environment (26.14 ton / fed). The
highest value of root yield ton/Fadden obtained from the genotype G9 under E5
environment (44.35) ton / fed.
For root yield (ton/ fed) in new reclaimed land Table-6, the average of the genotypes was 24.35 ton/ fed. The highest values recorded for the genotype G6 25.68
ton / faded while the lowest value recorded for the genotype G7 23.36 ton / fed. The
average of the environments was 24.35 ton/fed, the environment E11 recorded the
highest values of root yield (25.23 ton /fed) while the lowest value recorded for the E10
environment (23.49 ton / fed). The highest value of root yield obtained from the genotype G10 under E11 environment (27.56
ton /fed).
The combined data over the environ-ments showed that the genotypes G1, G2
and G9 recorded the highest values for root
yield (30.60, 30.92 and 30.05 ton /fed, respectively) over all environments.
Concerning old land for sugar yield (ton/fed) Table-7, the average of the genotypes was 5.50 ton/ fed. The highest value was recorded for the genotype G2
(6.16 ton / fed) while the lowest value was recorded for the genotype G3 (4.67 ton /
fed.). The average of the environments was 5.50 ton / fed .The environments E2 and E3
recorded the highest values of root yield (6.01and5.89 ton /fed) while the lowest value has recorded by the E7 environment
(4.62 ton / fed). The highest value of sugar yield was obtained from the genotype G9
under E5 environment (7.70 ton / fed).
Data of newly reclaimed land concerning sugar yield Table-7 revealed that the average of the genotypes was 4.05 ton/ fed. The highest value was recorded for the genotype G5 (4.39 ton / fed), while
the lowest value was recorded for the genotype G3 (3.80 ton / fed). The average
of the environments was 4.05 ton/fed. The environment E11 recorded the highest
values of sugar yield (4.13 ton / fed) while the lowest value was recorded for the E9
environment (3.97 ton / fed). The highest value of sugar yield was obtained from the genotype G5 under E11 environment (4.56
ton / fed).
The combined data over the environments showed that the genotypesG2
sugar yield ton/Fed (5.43 and 5.36 ton /fed respectively) over all environments.
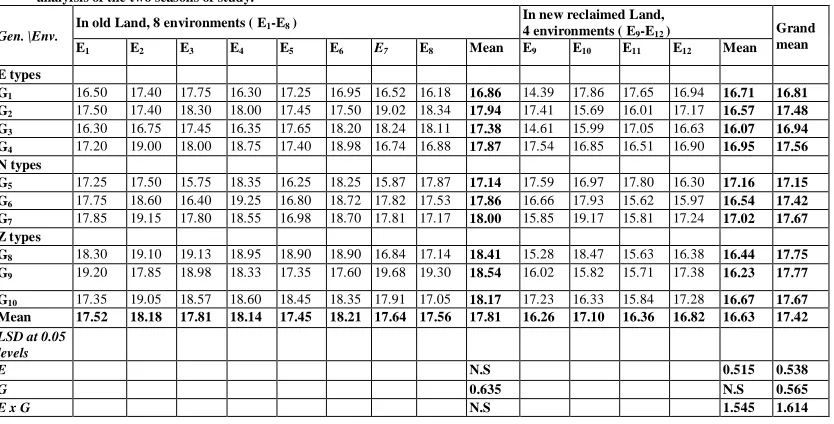
Moreover, sucrose % in old land (Table 8), the average of the genotypes was 17.81%. The highest values recorded for the genotype G8 and G9 (18.41 and 18.54
%) while the lowest value recorded for the genotype G1, which recorded percent of
sucrose 16.86%. The average of the envir-onments was 17.81%. The envirenvir-onments E2, E3 and E8 recorded the highest values of
sucrose % (18.18, 18.14 and 18.21% respectively) while the lowest value recorded for the E5 environment (17.45 %).
The highest value of sucrose % obtained from the genotype G9 under E7 environment
(19.68%).
Regarding sucrose % in new reclaimed land Table-8, the average of the genotypes was 16.63%. The highest values recorded for the genotype G5 (17.16%), while the
lowest value recorded for the genotype G3
(16.07%). The average of the environments was 16.63%. The environment E10 recorded
the highest values of sucrose% (17.10%) while the lowest value recorded for the E9
environment (16.26%). The highest sugar percent obtained from the genotype G7
under E10 environment (19.17%). The
combined data over the environments showed that the genotypes G8, G9 and G10
recorded the highest values for sucrose % (17.75, 17.77 and 17.67 % respectively) over all the environments.
2-Stability parameters: the methods of partitioning GE interaction, which provide a means of assigning a variance component to each genotype and a test of significance of the variance component, should be more useful in determining the stability of genotypes than those which do not assign a variance component to individual genotypes.
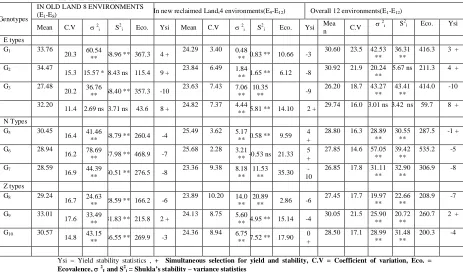
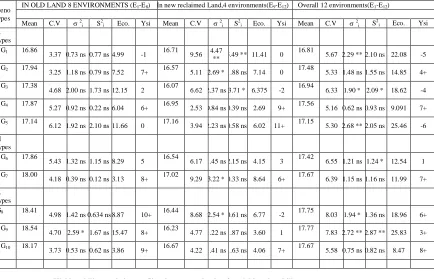
Estimates of the stability parametersand means for each of the ten genotypes are
given in Table - 9 for root yield (ton /fed), in Table-10 for sugar yield (ton /fed) and in Table-11 for sucrose %. Genotypes with a significant F value were considered to be unstable.
For root yield (ton /fed) data showed that the genotype G4 recorded insignificant
variance (ecovalence, 2i and S2i) statistics and low C.V values and G2 recorded
insignificant values for S2i and low C.V indicating their stability compared to the other genotypes. The integrating yield and stability of performance (Y si) showed stability for four genotypes (G1, G2, G4 and
G9) in old land environments and four
genotypes (G4, G5, G6 and G9) in new
reclaimed land and G6 recorded
insignificant variance S2i statistics and low C.V values indicating their stability compared to the other genotypes. Also, this genotype seemed to have high root yield above the grand mean.
In combined data, overall the environments data showed that G4 genotype
recorded insignificant values for ecova-lence, 2i, S2i and low C.V indicating the stability compared to the other genotypes. The integrating yield and stability of performance (Y Si) showed stability for
five genotypes (G1, G2, G4, G5 and G9) over
all environments. The aforementioned discussion showed that the statistical parameters were differed in their efficiency for determining the true stable genotypes. But the four proposed parameters were in line for determining stability of G4 in old
land and over all the environments with considering mean yield so it could be recommended for growing under conditions of old land and three proposed parameters were in line for determining stability of G6
For sugar yield (ton /fed), data showed that the genotypes G2 and G4 genotype
recorded insignificant variances (ecova-lence, 2 and S2i) and low) C.V values indicating their stability compared to the other genotypes. The integrating yield and stability of performance (Y Si) showed
stability for five genotypes (G1, G2,G3, G4
and G9) in old land environments and six
genotypes (G3, G4, G5, G6, G7 and G9) in
new reclaimed land and G3 recorded
insignificant variances (ecovalence, 2i and S2i) statistics and low C.V values indicating their stability compared to the other genotypes.
In combined data, overall the environments data showed that G4 genotype
recorded insignificant variances (ecova-lence, 2 and S2i) and low C.V indicating its stability compared to the other geno-types. G2 genotype recorded insignificant
values for S2 i indicating its stability compared to the other genotypes. The integrating yield and stability of performance (Y Si) showed stability for
five genotypes (G1, G2, G3, G4 and G9) over
all environments. The afore-mentioned discussion showed that the statistics parameters were differed in their efficiency for determining the true stable genotypes. But the four proposed parameters were in line for determining stability of G4 in old
land and over all the environments with considering mean yield so it could be recommended to grow under conditions of old land and four proposed parameters were in line for determining stability of G3 in
new land reclaimed with considering mean yield so it could be recommended to grow under conditions of new land reclaimed environments.
For sucrose %, data showed that the genotypes except G9 had insignificant
variances statistic (ecovalence, 2i and S2i) and low C.V values indicating their
stability in old lands. The integrating yield and stability of performance (Y Si) showed
stability for six genotypes (G2, G4, G7, G8,
G9 and G10) in old land environments and
four genotypes (G4, G5, G7 and G10) in new
reclaimed land .In new reclaimed land five genotypes (G4, G5, G6, G9 and G10) had
insignificant variances statistic (ecovalence, 2i and S2i) values indicating their stability compared to the other genotypes. However, the other genotypes gave different responses for variances statistic (ecova-lence, 2i and S2i) values.
In combined data of over all the environments showed that four genotypes (G2, G4, G7 and G10 recorded insignificant
values for 2i and S2i indicating their stability compared to the other genotypes. The other genotypes gave different responses for variances statistic (ecova-lence, 2i and S2i) values. The integrating yield and stability of performance (Y Si)
showed stability for six genotypes (G2, G4,
G7, G8, G9 and G10) over all environments.
The afore-mentioned discussion showed that the statistics parameters were differed in their efficiency for determining the true stable genotypes. But the three proposed parameters were in line for determining stability of four genotypes (G2, G4, G7 and
G10) in over all the environments with
considering sucrose % so it they could be recommended.
same. This requires that a decision must be made which of the two methods should be used to obtain stability- variance parame-ters for genotypes. The calculations involved in determining ecovalence are fewer and relative simpler than those for 2 I. Shukla's method would be preferred, however, if a covariate were used (Kang and Miller, 1984).
3-Variance components in all traits studied: Estimates of pertinent variance components for root yield, sugar yield and sucrose % are presented in (Table-12). For root yield the relative magnitude of these components indicates the relative importance of the corresponding source of variation. The plot error variance σ²e and the components of variance σ²g, σ²gl, σ²gp and σ²glp were higher in magnitude than the σ²gy component. The relatively small value for σ²gy indicated that the heritability was low. It means that the large effect by environmental.
Estimates of variance components for sugar yield indicated that the relative magnitudes of these components in relative importance of the corresponding sources of variation. The plot error variance σ²e and the components of variance σ²g, σ²gp and
σ²gld were very much higher in magnitude than the σ²gy and σ²glp component. The large σ²g may be due to the large stability of these genotypes. The relative magnitude of these components indicates the relative importance of the corresponding source of variation. Estimates of variance compo-nents for sucrose % showed that the relative magnitude of plot error variance σ²e and the components of variance σ²g were much higher than the interaction σ²gl components. The small values of inter-action σ²gp and σ²glp indicate that there were no environmental effects.
Table-3: Monthly meteorological data of location and seasons.
Monthly report, Agro meteorological data ARC, Egypt
Table -4: Form of variance analysis and mean square expectations in combined analysis
Souree of variation Degree of freedom Expected mean square Years (Y) y-1 = 1
Reps with years (R) y(r-1) = 2
Location (L) l- 1 = 2
Y x L (y-1)(l-1) = 2
Pooled Error (y) y(r-1)(l-1) = 3
Planting date (P) p-1 = 1
Y x P (y-1)(p-1) = 1
L x P (l-1)(p-1) = 2
Y x L x P (y-1)(l-1)(p-1) = 2
Pooled Error (P) yl(r-1)(p-1) = 7
Genotypes (G) g-1 = 9 Mi σ2e + rσ2 lpgy + ry σ
2
lpg+ rlσ2ypg+rpσ2ylg+rlyσ2pg + rpyσ2lg+ rlpσ2yg + rlpyσ2g
Y x G (y-g)(g-1) = 9 Mh σ2e + rσ2
lpgy + rp σ 2
lyg + rl σ2pyg+ rlpσ2yg
L x G (l-1)(g-1) = 18 Mg σ2e + rσ2
lpgy + rp σ 2
ylg + ry σ2plg+ rpyσ2lg
P x G (p-1)(g-1) = 18 Mf σ2e + rσ2
lpgy + ry σ 2
lpg + rl σ2pgy+ rlyσ2pg Y x L x G (y-1)(l-1)(g-1) = 9 Me σ2e + rσ2
lpgy + rpσ 2
ylg .
Y x P x G (y-1)(p-1)(g-1) = 9 Md σ2
e + rσ2 lpgy + rlσ
2 ypg .
L x P x G (l-1)(p-1)(g-1) = 18
Mc σ2e + rσ2 lpgy+ ryσ2 lpg .
Y x L x P x G (y-1)(l-1)(p-1)(g-1) = 18 Mb σ2e + rσ2 lpgy . Pooled Error (g) ylp (r-1)(g-1) = 108 Ma σ2
e . MONTHS
Temperature oC Relative Humidity %
Maximum Minimum
Kafr
El-Sheikh Dakahlia Fayoum Kafr El-Sheikh Dakahlia Fayoum Kafr El-Sheikh Dakahlia Fayoum
2004/2005 SEASON
Oct. 30.2 30.5 31.8 19.2 17.7 18.3 71 66 54
Nov 25.7 26.0 28.1 16.7 16.3 13.7 57 68 54
Des. 20.8 20.2 21.2 11.9 11.0 8.2 75 73 59
Jan. 19.0 19.0 21.1 9.6 9.0 7.6 57 65 55
Feb. 19.1 19.4 21.0 9.3 8.1 6.9 71 64 60.5
March 22.6 22.1 25.2 10.8 10.1 9.4 56 64 53
April. 25.2 25.8 30.1 14.2 13.1 13.0 54 63 51
2005/2006 Season
Oct. 28.5 27.2 29.9 18.2 15.6 16.7 71 65 55
Nov 24.4 24.1 24.4 14.7 12.5 11.0 70 65 57
Des. 21.1 20.1 21.3 12.1 10.7 8.9 75 70 59
Jan. 18.7 18.6 19.4 9.9 7.7 6.6 74 69 59
Feb. 20.8 20.0 22.2 11.1 8.8 8.4 76 68 60.5
March 23.0 22.8 26.3 11.4 10.3 9.7 56 64 51.9
Table - 5: Mean squares across 8 old land., and 4 new reclaimed land, and all 12 environments for root yield, sugar yield(ton/fed.) and sucrose % sugar beet genotypes.
S.V
In old Land, Environments New reclaimed Environments All Environments
d.f
Mean square
d.f
Mean square
d.f
Mean square
Root yield Ton/fed.
Sugar yield ton/fed.
Sucrose %
Root yield Ton/fed.
Sugar yield ton/fed.
Sucrose %
Root yield Ton/fed.
Sugar yield ton/fed.
Sucrose %
Genotypes (G)
9 90.585** 3.176* 4.654** 9 4.72 ns 0.260 0.947 9 62-639* 2.166* 2.818
Environments (E) 7 171.484** 5.947** 2.052 3 10.17 ** 0.116** 3.159* 11 318.221** 13.869** 8.893**
G x E 63 40.337** 1.295** 1.301 27 5.68 ** 0.218** 2.254** 99 30.188** 0.999** 1.696**
Heterogeneity 9 40.118 1.514 2.614* 9 4.32 ns 0.106 3.036 9 65.933* 2.203* 2.460
Residual 54 40.373** 1.259** 1.082 18 6.35 ** 0.273** 1.864* 90 26.614** 0.879** 1.620**
Pooled Error 72 5.977 0.253 1.072 36 0.786 0.021 0.869 108 6.427 0.271 0.997
*&** denote significant or 0.05 and 0.01 probability, respectively
Table - 6: Root yield (ton/fed.) means of 10 sugar beet varieties grown in old (E1-E8) and new reclaimed land
(E9-E12) during combined analysis of the two seasons of study.
Gen\Env.
In old Land, 8 environments ( E1-E8 )
In new reclaimed Land, 4
environments ( E9-E12 ) Grand
mean
E1 E2 E3 E4 E5 E6 E7 E8 Mean E9 E10 E11 E12 Mean
E types
G1 30.40 41.65 35.45 40.20 33.73 39.80 24.23 24.63 33.76 25.28 23.55 24.68 23.67 24.29 30.60
G2 37.20 39.15 37.80 37.08 34.25 37.83 25.62 26.80 34.47 25.10 22.08 25.18 23.00 23.84 30.92
G3 36.48 20.73 32.45 23.95 32.53 24.30 24.75 24.67 27.48 24.92 24.03 24.52 21.05 23.63 26.20
G4 37.25 33.23 33.45 32.48 33.15 34.58 26.98 26.53 32.20 23.28 24.40 27.47 24.13 24.82 29.74
N types
G5 36.28 28.40 36.25 26.33 36.23 24.15 28.63 27.38 30.45 24.80 26.85 25.13 25.18 25.49 28.80
G6 23.23 34.91 22.88 32.53 26.70 34.38 28.80 28.13 28.94 25.33 26.53 25.25 25.62 25.68 27.85
G7 33.95 28.00 33.98 23.68 33.38 21.45 25.88 28.44 28.59 23.15 20.55 23.88 25.85 23.36 26.85
Z types
G8 29.70 35.23 32.95 33.95 30.53 22.13 23.83 25.58 29.24 23.33 21.73 23.13 27.39 23.89 27.45
G9 34.94 33.38 35.51 31.05 44.35 32.35 25.28 27.23 33.01 26.10 21.55 25.58 23.28 24.13 30.05
G10 29.85 35.90 29.55 35.80 24.85 35.23 27.45 25.90 30.57 22.70 23.70 27.56 23.47 24.36 28.50
Mean 32.93 33.06 33.03 31.70 32.97 30.62 26.14 26.53 30.87 24.40 23.49 25.23 24.26 24.35 28.70
LSD at 0.05 levels
E 1.320 0.489 1.370
G 1500 N.S 1.244
Table -7: Sugar yield (ton/fed.) means of 10 sugar beet varieties grown in old (E1-E8) and new reclaimed land (E9-E12) during combined analysis of the two seasons of study.
Gen. \Env. In old Land, 8 environments ( E1-E8 )
In new reclaimed Land,
4 environments ( E9-E12 ) Grand mean E1 E2 E3 E4 E5 E6 E7 E8 Mean E9 E10 E11 E12 Mean E types
G1 5.05 7.25 6.30 6.55 5.80 6.75 4.00 4.00 5.71 3.63 4.22 4.36 4.01 4.06 5.16 G2 6.50 6.80 6.90 6.65 6.00 6.60 4.90 4.95 6.16 4.36 3.46 4.02 4.00 3.96 5.43 G3 5.95 3.45 5.70 3.90 5.75 4.35 4.50 4.45 4.76 3.64 3.84 4.18 3.53 3.80 4.44 G4 6.40 6.30 6.05 6.10 5.80 6.55 4.50 4.50 5.78 4.12 4.11 4.54 4.07 4.21 5.25 N types
G5 6.25 4.95 5.70 4.80 5.90 4.40 4.55 4.85 5.18 4.38 4.56 4.51 4.10 4.39 4.91
G6 4.10 6.50 3.75 6.25 4.50 6.40 5.20 4.90 5.20 4.24 4.72 3.97 4.10 4.26 4.89 G7 6.05 5.40 6.00 4.40 5.65 4.05 4.60 4.90 5.13 3.66 3.94 3.78 4.50 3.97 4.74 Z types
G8 5.45 6.70 6.30 6.45 5.75 4.20 4.05 4.40 5.41 3.56 4.01 3.61 4.53 3.93 4.92 G9 6.70 5.90 6.70 5.70 7.70 5.65 5.00 5.25 6.08 4.18 3.40 4.02 4.09 3.92 5.36
G10 5.15 6.85 5.50 6.65 4.60 6.45 4.90 4.40 5.56 3.95 3.84 4.37 4.06 4.05 5.06 Mean 5.76 6.01 5.89 5.75 5.75 5.54 4.62 4.66 5.50 3.97 4.01 4.13 4.10 4.05 5.02
LSD at 0.05 levels
E 0.272 0.080 0.280
G 0.308 0.138 0.253
E x G 0.871 0.240 0.841
Table - 8: Sucrose % means of 10 sugar beet varieties grown in old (E1-E8) and new reclaimed land (E9-E12) during Combined analyfsis of the two seasons of study.
Gen. \Env.
In old Land, 8 environments ( E1-E8 )
In new reclaimed Land,
4 environments ( E9-E12 ) Grand mean E1 E2 E3 E4 E5 E6 E7 E8 Mean E9 E10 E11 E12 Mean
E types
G1 16.50 17.40 17.75 16.30 17.25 16.95 16.52 16.18 16.86 14.39 17.86 17.65 16.94 16.71 16.81 G2 17.50 17.40 18.30 18.00 17.45 17.50 19.02 18.34 17.94 17.41 15.69 16.01 17.17 16.57 17.48 G3 16.30 16.75 17.45 16.35 17.65 18.20 18.24 18.11 17.38 14.61 15.99 17.05 16.63 16.07 16.94 G4 17.20 19.00 18.00 18.75 17.40 18.98 16.74 16.88 17.87 17.54 16.85 16.51 16.90 16.95 17.56 N types
G5 17.25 17.50 15.75 18.35 16.25 18.25 15.87 17.87 17.14 17.59 16.97 17.80 16.30 17.16 17.15 G6 17.75 18.60 16.40 19.25 16.80 18.72 17.82 17.53 17.86 16.66 17.93 15.62 15.97 16.54 17.42 G7 17.85 19.15 17.80 18.55 16.98 18.70 17.81 17.17 18.00 15.85 19.17 15.81 17.24 17.02 17.67 Z types
G8 18.30 19.10 19.13 18.95 18.90 18.90 16.84 17.14 18.41 15.28 18.47 15.63 16.38 16.44 17.75 G9 19.20 17.85 18.98 18.33 17.35 17.60 19.68 19.30 18.54 16.02 15.82 15.71 17.38 16.23 17.77
G10 17.35 19.05 18.57 18.60 18.45 18.35 17.91 17.05 18.17 17.23 16.33 15.84 17.28 16.67 17.67 Mean 17.52 18.18 17.81 18.14 17.45 18.21 17.64 17.56 17.81 16.26 17.10 16.36 16.82 16.63 17.42 LSD at 0.05
levels
E N.S 0.515 0.538
G 0.635 N.S 0.565
Table -9: Mean of root yield (ton/fed.) and estimates of stability parameters for ten sugar beet genotypes across each of the three sits of environments.
Genotypes
IN OLD LAND 8 ENVIRONMENTS (E1-E8)
In new reclaimed Land,4 environments(E9-E12) Overall 12 environments(E1-E12)
Mean C.V 2i S 2
i Eco. Ysi Mean C.V 2i S 2
i Eco. Ysi Mea
n C.V
2
i S
2
i Eco. Ysi
E types
G1 33.76
20.3 60.54
** 58.96 ** 367.3 4 +
24.29 3.40 0.48
** 0.83 ** 10.66 -3
30.60 23.5 42.53 **
36.31 **
416.3 3 +
G2 34.47
15.3 15.57 * 8.43 ns 115.4 9 + 23.84 6.49 1.84
** 1.65 ** 6.12 -8
30.92 21.9 20.24 **
5.67 ns 211.3 4 +
G3 27.48
20.2 36.76
** 68.40 ** 357.3 -10
23.63 7.43 7.06 **
10.35
** -9
26.20 18.7 43.27 **
43.41 **
414.0 -10
32.20
11.4 2.69 ns 3.71 ns 43.6 8 + 24.82 7.37 4.44
** 5.81 ** 14.10 2 +
29.74 16.0 3.01 ns 3.42 ns 59.7 8 +
N Types
G5 30.45
16.4 41.46
** 48.79 ** 260.4 -4
25.49 3.62 5.17
** 0.58 ** 9.59 4 +
28.80 16.3 28.89 **
30.55 **
287.5 -1 +
G6 28.94
16.2 78.69
** 57.98 ** 468.9 -7
25.68 2.28 3.21
** -0.53 ns 21.33 5 +
27.85 14.6 57.05 **
39.42 **
535.2 -5
G7 28.59
16.9 44.39
** 50.51 ** 276.5 -8
23.36 9.38 8.18 **
11.53 ** 35.30
-10
26.85 17.8 31.11 **
32.90 **
306.9 -8
Z types
G8 29.24
16.7 24.63
** 28.59 ** 166.2 -6
23.89 10.20 14.0 **
20.89
** 2.86 -6
27.45 17.7 19.97 **
22.66 **
208.9 -7
G9 33.01
17.6 33.49
** 31.83 ** 215.8 2 +
24.13 8.75 5.60
** 4.95 ** 15.14 -4
30.05 21.5 25.90 **
20.72 **
260.7 2 +
G10 30.57
14.8 43.15
** 46.55 ** 269.9 -3
24.36 8.94 6.75
** 7.52 ** 17.90 0 +
28.50 17.1 28.99 **
31.48 **
200.3 -4
Ysi = Yield stability statistics , + Simultaneous selection for yield and stability, C.V = Coefficient of variation, Eco. = Ecovalence, 2
I and S2i = Shukla’s stability – variance statisties
Table -10: Mean of sugar yield (ton/fed.) and estimates of stability parameters for ten sugar beet genotypes across each of the three sits of environments.
Genotypes
IN OLD LAND 8 ENVIRONMENTS (E1-E8) In new reclaimed Land,4 environments(E9-E12) Overall 12 environments(E1-E12)
Mean C.V 2
i S2i Eco. YS I
Mea
n C.V
2
i S2i Eco. Ysi Mea
n C.V
2
i S
2
i Eco. Ysi
E types
G1 6.08 14.7 0.98** 1.17** 6.40 3 + 3.92 8.99 0.27 ** 0.42 ** 0.72 -8 5.36 24.1 0.99 ** 0.84 ** 983 3+
G2 6.16 13.1 0.13 ns 0.37 ns 1.62 13 + 3.96 9.38 0.34 ** 0.48 ** 0.88 -5 5.43 23.5 0.51 ** 0.13 ns 5.57 8+
G3 5.56 17.3 1.37 ** 1.63 ** 8.59 -1+ 4.05 5.66 0.04 ns 0.02 ns 0.17 7+ 5.06 21.3 0.88 ** 0.99 ** 8.79 -1+
G4 5.78 14.2 0.23 ns 0.18 ns 2.17 9 + 4.21 5.19 0.55 ns 0.07 * 0.20 8+ 5.25 19.4 0.15 ns 0.15 ns 2.46 9+
N types
G5 5.18
13.2 0.85 ** 0.88 ** 5.66 -7 4.39 4.63 0.11 ** 0.12 ** 0.33 5+ 4.91 13.8 0.81 ** 0.55 * 8.26 -5
G6 5.20
20.7 3.34 ** 3.22 ** 19.62 -6 4.26 7.69 0.34 ** 0.19 ** 0.88 3+ 4.89 20.3 2.36 ** 2.13 ** 21.85 -6
G7 5.13 14.7 1.09 ** 1.17 ** 6.99 8- 3.97 9.39 0.27 ** 0.39 ** 0.72 -4+ 4.74 18.0 0.80 ** 0.80 ** 8.16 -8
Z types
G8 5.41 19.7 1.04 ** 0.92 ** 6.74 -4 3.93 11.40 0.45 ** 0.67 ** 1.14 -7 4.92 23.3 0.77 ** 0.81 ** 7.89 -4
G9 5.71 21.7 1.54 ** 1.05 ** 9.54 0 + 4.06 7.79 0.16 ** 0.16 ** 0.44 0+ 5.16 25.1 1.04 ** 0.91 ** 10.21 0+
G10 4.76 19.6 2.28 ** 2.32 ** 14.25 -10 3.80 7.55 0.14 ** 0.21 ** 0.40 -10 4.44 20.1 1.68 ** 1.49 ** 15.89 -10
Table -11: Mean of sucrose % and estimates of stability parameters for ten sugar beet genotypes across each of the three sits of environments.
Ysi = Yield stability statistics , + Simultaneous selection for yield and stability C.V = Coefficient of variation, Eco. = Ecovalence, 2
I and S2i = Shukla’s stability – variance statisties
Table -12: Variance component estimates from combined ANOVA for root yield , sugar yield and sucrose of 10 genotypes grown in 12 environments .
Variance Components
Root yield ton/fed.
Sugar yield ton/fed.
Sucrose %
E.M. S E.M. S E.M. S
2g 6.804 ** 0.225 ** 0.389 *
2
gy 0.743 * 0.045 * 0.246 *
2g1 1.392 ** 0.042 ** 0.181 *
2
gp 5.616 ** 0.197 ** 0.087
2glp 3.313 ** 0.126 ** 0.055 **
2
gylp 8.184 ** 0.209 ** 0.268
2e 6.472 0.271 0.997
2Ph
26.324 1.115 2.223
hb2 25.85 20.22 17.51
2g, 2gy, 2g1, 2gp, 2glp and 2gylp are the variance attributed to genotypes, genotype x year genotype x location, genotype x planting date, genotype x location x planting date and genotype x year x location x planting date respectively. hb2 Heritability in broad sen
Geno types
IN OLD LAND 8 ENVIRONMENTS (E1-E8) In new reclaimed Land,4 environments(E9-E12) Overall 12 environments(E1-E12)
Mean C.V 2
i S2i Eco. Ysi Mean C.V 2i S2i Eco. Ysi Mean C.V 2i S2i Eco. Ysi
E types
G1 16.86
3.37 0.73 ns 0.77 ns 4.99 -1 16.71 9.56 4.47
** 5.49 ** 11.41 0 16.81
5.67 2.29 ** 2.10 ns 22.08 -5 G2 17.94
3.25 1.18 ns 0.79 ns 7.52 7+ 16.57 5.11 2.69 * 1.88 ns 7.14 0 17.48 5.33 1.48 ns 1.55 ns 14.85 4+ G3 17.38
4.68 2.00 ns 1.73 ns 12.15 2 16.07 6.62 2.37 ns 3.71 * 6.375 -2 16.94 6.33 1.90 * 2.09 * 18.62 -4 G4 17.87
5.27 0.92 ns 0.22 ns 6.04 6+ 16.95 2.53 0.84 ns 0.39 ns 2.69 9+ 17.56 5.16 0.62 ns 0.93 ns 9.091 7+ G5 17.14
6.12 1.92 ns 2.10 ns 11.66 0 17.16 3.94 2.23 ns 0.58 ns 6.02 11+ 17.15 5.30 2.68 ** 2.05 ns 25.46 -6 N
types G6 17.86
5.43 1.32 ns 1.15 ns 8.29 5 16.54 6.17 1.45 ns 2.15 ns 4.15 3 17.42 6.55 1.21 ns 1.24 * 12.54 1 G7 18.00
4.18 0.39 ns 0.12 ns 3.13 8+ 17.02 9.29 3.22 * 0.33 ns 8.64 6+ 17.67 6.39 1.15 ns 1.16 ns 11.99 7+ Z
types G8 18.41
4.98 1.42 ns 0.634 ns 8.87 10+ 16.44 8.68 2.54 * 0.61 ns 6.77 -2 17.75 8.03 1.94 * 1.36 ns 18.96 6+ G9 18.54
4.70 2.59 * 1.67 ns 15.47 8+ 16.23 4.77 1.22 ns 1.87 ns 3.60 1 17.77 7.83 2.72 ** 2.87 ** 25.83 3+ G10 18.17
REFERENCES
Abd El-Aal, A.M. and A.Z.A. Mohamed, Genotype x environment interaction and stability analysis for yield and quality of some sugar beet genotypes. Annals of Agric. Sci. Moshtohor 43 (2): 527-544 (2005).
Abo El-Ghait., R.A.M., Evaluation of some sugar beet varieties under different environmental conditions.M.Sc.Thesis. El-Minufiya Univ., Egypt (1993). Al-Jbawi, E.M., Performance of some sugar
beet genotypes under different environ-ments. M.Sc. Thesis, Fac. of Agric., Cairo Univ., Egypt (2000).
Francis, T.R. and L.W. Kannenberg, Yield stability studies in short-season maize. 1. A descriptive method for grouping genotypes. Can. J. Pl. Sci. 58: 1029-1034 (1978)
Ghandorah, M.O. and Y.A. Refay, Effects of sowing date and cultivar on sugar beet (Beta vulgaris L.) production in the central region of Saudi Arabia. Arab Gulf Journal of Scientific Research 12 (3): 465-478 (1994). Gomez, K.A. and A.A. Gomez, Statistical
Procedures for Agricultural Research. A Wiley-Inter-Science Publication, John Wiley and Sons, New York (1984).
Kang, M.S., Interactive BASIC program for calculating stability-variance para-meters. Letter to the editor. Agron. J. 80: 153 (1988).
Kang, M.S., Simultaneous selection for yield and stability in crop performance trials: Consequences for growers. Agron. J. 85: 754-757 (1993).
Kang, M.S. and J.D. Miller, Genotype x Environments for cane and sugar yield and their implications in sugarcane
breeding. Crop Science 24: 435-440 (1984).
Kang, M.S. and R. Magari, Stable a BASICA program for calculating stability and yield-stability statistics. Agron. J. 7: 276-277 (1995).
Kang, M.S. and R. Magari, New develop-ments in selection for phenotypic stability in crop breeding. In Genotype-by-environment interaction, Advances in Agron. 62: 199-252 (1996).
Kang, M.S. J.D. Miller and L.L. Darrah, (1987). A note on relationship between stability variance and ecovalence. J. Hered. 78:107. (1996).
Gherman, I. and M. Kavots, The heri-tability and variability of components of yield in sugar beet. Probleme de Genetica Teoretica sci. Aplicata. 15(2): 195-213 (1983).
Miller, J.C. W. and H.F. Robenson, Variety -environment interaction and their implication on testing methods. Agron. Jour., 51: 132-135 (1959).
Piper, C.S., Soil and plant analysis. Univ. of Adelaide, Australia, Pp.178 (1955). Shalaby, N.M.S., Effect of environmental
conditions on the behavior of different genotypes of sugar beet for rot yield and quality. Ph.D. Thesis, Fac. of Agric., Al-Azhar Univ., Egypt (2003). Shukla, G.K., Some statistical aspects of
partitioning genotype- environmental components of variability. J. Heredity 29: 237-245 (1972).
Weber, W.E. and P. Muller, Biometrical criteria for the evaluation of locations in sugar beet breeding. Kuhn Archiv., 90(2): 187-200. (1996).