#Assistant Professor &Head, Department of computer science, School of Computing Sciences, Vels University, Chennai - 600117
*Research Scholar, Department of computer science,School of Computing Sciences, Vels University, Chennai - 600117
{[email protected],[email protected]}
1.Introduction
Due to the innovation made in Information and Communication Technologies (ICT), a tremendous volume of data and its metadata has been growing incessantly in this digital era. These huge amounts of data have to be monitored and managed efficiently, so as to retrieve the required information in a rapid manner [1]. Every organization is looking for Information Management Systems to thrive the world. Changing conditions and circumstances have required the prerequisite for the most ideal spread of information at various levels of organization. The change and usage of information organization systems (MIS) is a front line wonder stressed over the use of fitting information that will incite better orchestrating, better essential initiative and better results. Since, the gained data is unpredictable in nature, it is very irritating undertaking [2]. Knowledge mining is the promiscuous field that scans voluminous data repositories, create the information and innovate the
knowledge. Most of the knowledge mining techniques reveal the ground truths of the obtained information [3]. The assignment of learning mining framework is to make sense of the information designs, sort out data of concealed connections, structure affiliation rules, gauge obscure things' esteems to characterize objects make groups out of homogeneous questions, and divulge numerous sorts of discoveries that are not effortlessly created by a great CBIS. Subsequently, KM results speak to a profitable help for choices making. In concern to education, knowledge mining systems play a vital role in the knowledge discovery, decision making and recommendation.
For advanced education establishments whose objective is to add to the change of nature of advanced education, the achievement of the production of human capital is the subject of a persistent examination. Thusly, the expectation of understudies' prosperity is pivotal for advanced education foundations, in light of the fact that the nature of the showing procedure is the capacity to address understudies' issues [4]. In this sense essential
Research Article
PREDICTING INSTRUCTORS PERFORMANCE IN
HIGHER EDUCATION SYSTEMS
Dr. K.Kalaiselvi
#1, J. Sowmiya
*2EAI Endorsed Transactions
on Energy Web and Information Technologies
Abstract
In recent years, knowledge mining has become one of the effective tools for data analysis and information management systems. Educational sector is the recent research endeavors that make use of data mining algorithms. Prior works carried in data mining algorithms like J48 Decision Tree, Multilayer Perception, Naïve Bayes, and Sequential Minimal Optimization impose issues like the curse of dimensionality, cardinality and imbalance attributes. In this paper, we have proposed FA-Paired t-test method which is a novel knowledge discovery process to predict the performance of the instructors. The aim of the study is to find the factors that associated for the prediction of teaching quality. Thus, the contribution of the factor analysis method helps to find the relevant attributes from a set of attributes. Then, the selected attributes are fed as input to paired t-test model which find the associations between those linked attributes. The selected attributes are experimenting using SPSS modeler. Many attributes test for the performance evaluation. It is strongly found that content arrangement, delivery of speech, effective class hours and completion of the course helps to predict the quality of the teaching. In addition to, the proposed model is compared to prior two classifiers, named, J48DT and Naïve Bayes which shows our proposed method works better than other two classifiers in term of Attribute reduction and evaluation process.
Keywords: Knowledge mining; Educational sector; knowledge discovery process; data mining algorithms, imbalance attributes and
Data analysis.
Received on 06 April 2018, accepted on 02 May 2018, published on 12 June 2018
Copyright © 2018 K.Kalaiselvi and J. Sowmiya, licensed to EAI. This is an open access article distributed under the terms of the Creative Commons Attribution licence (http://creativecommons.org/licenses/by/3.0/), which permits unlimited use, distribution and reproduction in any medium so long as the original work is properly cited.
doi: 10.4108/eai.12-6-2018.154811
EAI Endorsed Transactions on
Energy Web and Information Technologies 04 2018 - 06 2018|Volume5|Issue 18|e1
1
information and data are accumulated all the time, and they are considered by the suitable specialists, and principles to keep up the quality are set. One of the greatest difficulties that higher foundations confront today is the way to enhance the nature of administrative choices. The administrative basic leadership process turns out to be more mind boggling as the unpredictability of instructive elements increment [5].
The rest of the paper is organized as follows: Section II presents prior work; Section III presents proposed work; Section IV presents the experimental analysis and concludes in Section V
2
Prior Works
This section presents the related works processed by other researchers in the field of educational knowledge mining systems.
Ashish Dutt et al[3] conducted a survey on educational knowledge mining over data like student enrollment, attendance records and grade records. They discussed about the importance of clustering processes towards their collected data. Beat A Schwendimann et al [2]presented a dashboard sort of research in learning systems. They surveyed 55 papers that depict the importance of knowledge, prediction using educational data. Jun Xie et al[10] incorporated algebraic geometry properties on obtained educational records and solved the certainty issues over the grading systems. For, the author has used general topology of big data, it can’t apply to real time applications.
Yaoguang Hu et al[8] presented knowledge mining systems for agricultural machinery maintenance systems. Apriori algorithm was used for the framing rule which throws higher complexity due to the combination of multiple variables. Dong Sihui et al[4] derived knowledge of university libraries. Xin Chen et al[11] discussed about the impact of social media over learning systems. Due to the growth of different social networks, the performance of the student’s was analyzed. Multi-label classification model was developed for analyzing the collected data. Hashtags data were used to predict the learning experiences. But, it fails to support the non-technical researchers. Jui Long Hung et al[1] presented risk identification for the online students. A data aggregation model is developed for the learning activities performed by the students. The trained model was built of out-of sample validation. Petra Vrablecova et al[5] studied about the semantic annotation of the educational data that built hierarchical domain relationship between the attributes. Dewan Md. Farid et al[12] studied about the Knowledge Mining for Effective Teaching and Enhancing Engineering Education via web technologies. They easily identified strong and weak students.
Tanvir Atahary et al[7] presented knowledge mining for cognitive agents through path based forw ard checking model. The aim of the study was to solve the Cognitive Domain Ontologies (CDO) from the baseline of Constraint Satisfaction Problem (CSP). Based on the events, the CDO mapping was constrained. Most of the pruning search spaces can’t be reused. Mamoun Al Mardini et al[6] presented knowledge mining systems for the healthcare applications. The aim of this study was to make better decision making systems using hospital admissions datasets. They explored the transitive state of each record and formed the clusters. Each cluster depicts relationship with the hospitals,which is so small. Thus, it holds lesser subsets. Po Hsun Wu et al[9] discussed an analog layout synthesis model for knowledge mining systems. Though, reusage efficiency rate is higher, yet fails to coordinate symmetry and proximity constraints are not focused.
3
Research Methodology
3.1 Enhanced knowledge mining systems
The aim of the study is to expose the knowledge regarding the performance of the teachers (or) instructors from the student’s evaluation data set.
Data collection and Exploration:
Data collection is the first step in Knowledge Discovery Process. The data set used in this study was collected from the UCI machine repository, named, Turkiye Student Evaluation dataset. The dataset contains 5820 instances with 33 attributes. The attributes are responded by the student based on a Likert scale. The table 1 presents the attribute description and its possible values. Next step is the exploration of the data that seeks to understand the dataset in handy. It’s been visualized in graphical plots and diagrams. This step in data mining is essential because it allows the researchers as well as the readers to understand the data before jumping into applying more complex data mining tasks and algorithms.
a)Data preprocessing
Data preprocessing is the second step of the Knowledge Discovery Process. This step allows selecting the attributes for the knowledge discovery process. Table 2 presents the summary statistics about the dataset which includes the mode (the value with the highest frequency), the least (the value with least frequency), and the number of missing values.
2 Energy Web and Information TechnologEAI Endorsed Transactions ieson
Figure.1. Proposed workflow
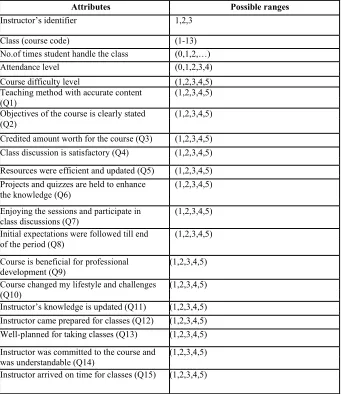
Table 1: Attribute’s description and its possible ranges
Attributes Possible ranges
Instructor’s identifier 1,2,3
Class (course code) (1-13)
No.of times student handle the class (0,1,2,…)
Attendance level (0,1,2,3,4)
Course difficulty level (1,2,3,4,5)
Teaching method with accurate content (1,2,3,4,5) (Q1)
Objectives of the course is clearly stated (1,2,3,4,5) (Q2)
Credited amount worth for the course (Q3) (1,2,3,4,5) Class discussion is satisfactory (Q4) (1,2,3,4,5) Resources were efficient and updated (Q5) (1,2,3,4,5) Projects and quizzes are held to enhance (1,2,3,4,5) the knowledge (Q6)
Enjoying the sessions and participate in (1,2,3,4,5) class discussions (Q7)
Initial expectations were followed till end (1,2,3,4,5) of the period (Q8)
Course is beneficial for professional (1,2,3,4,5) development (Q9)
Course changed my lifestyle and challenges (1,2,3,4,5) (Q10)
Instructor’s knowledge is updated (Q11) (1,2,3,4,5) Instructor came prepared for classes (Q12) (1,2,3,4,5) Well-planned for taking classes (Q13) (1,2,3,4,5) Instructor was committed to the course and (1,2,3,4,5) was understandable (Q14)
Instructor arrived on time for classes (Q15) (1,2,3,4,5)
3 Energy Web and Information TechnologEAI Endorsed Transactions ieson
Instructor has a smooth and easy to follow (1,2,3,4,5) delivery/speech (Q16)
Instructor made effective use of class (1,2,3,4,5) hours. (Q17)
Instructor explained the course and was (1,2,3,4,5) eager to be helpful to students (Q18)
Instructor demonstrated a positive approach (1,2,3,4,5) to students (Q19)
Instructor was open and respectful of the (1,2,3,4,5) views of students (Q20)
Instructor encouraged participation in the (1,2,3,4,5) course (Q21)
Instructor gave relevant homework (1,2,3,4,5) assignments/projects, and helped/guided
student (Q22)
Instructor responded to questions about the (1,2,3,4,5) course inside and outside of the course
(Q23)
Instructor's evaluation system effectively (1,2,3,4,5) measured the course objectives (Q24)
Instructor provided solutions to exams and (1,2,3,4,5) discussed them with students (Q25)
Instructor treated all students in a right and (1,2,3,4,5) objective manner (Q26)
Table 2: Summary statistics for evaluating instructor’s performance
Attributes Mode Least Missing
Values
Q1 3(1563) 5(836) 0
Q2 3(1681) 2(800) 0
Q3 3(1746) 2( 683) 0
Q4 3(1674) 2(809) 0
Q5 3(1699) 2(803) 0
Q6 3(1709) 2(768) 0
Q7 3(1713) 2( 823) 0
Q8 3(1711) 2( 903) 0
Q9 3(1777) 1(880) 0
Q10 3( 1771) 2(787) 0
Q11 3(1660) 2(678) 0
Q12 3(1696) 2(822) 0
Q13 4(1708) 2(631) 0
Q14 4(1789) 2(590) 0
Q15 4(1770) 2(572) 0
Q16 3(1681) 2(689) 0
Q17 4(1854) 2(499) 0
Q18 3(1659) 2(640) 0
Q19 3(1678) 2(600) 0
Q20 4(1670) 2(591) 0
Q21 4(1706) 2(581) 0
Q22 4(1718) 2(566) 0
Q23 3(1733) 2(673) 0
Q24 3(1720) 2(725) 0
Q25 4(1744) 2(571) 0
Q26 3(1699) 2(637) 0
Q27 3(1633) 2(725) 0
Q28 4(1695) 2(560) 0
4 Energy Web and Information TechnologEAI Endorsed Transactions ieson
From the table 2, it is inferred that there are no missing values and also presented the frequencies of each attributes with highest and least value. This summary statistic helps to resolve the issues of dimensionality and cardinality. The conversion of high dimensional value into low dimensional value is known as dimensionality issue, whereas the selection of appropriate attributes to predict the future trends is known as cardinality issue.
b)Attribute Reduction and Selection
Attribute reduction and selection is an essential process in the Knowledge discovery process. The optimal selection of attributes depicts the derivation of the knowledge in an effective way. We have used factor analysis method to balance the attributes. The factor analysis method consists of two phases, viz,
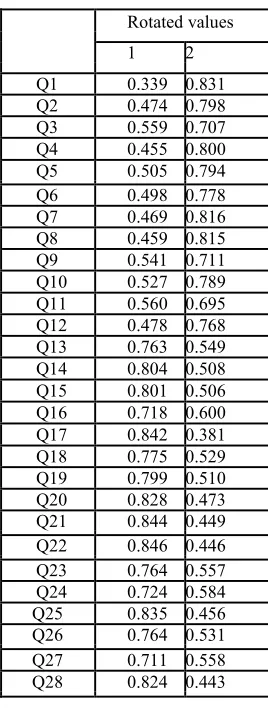
extraction and rotation. Extraction is the process of obtaining the relevant data from different factors of attributes. Similarly, rotation is the process of obtaining a smaller set of factors for the analysis purpose. In this work, we have used a Varimax rotation, which is a simpler rotation process of a small number of large loadings and large number of zero loadings. By doing so, the interpretations of the attributes are easy. Moreover, the elements can frequently be translated from the restriction of the couple of factors with positive loading excessively couple of factors with negative loading. The variance of the each attribute is estimated in factors in order to achieve the optimal attribute selection process. According to Eigenvalues and 2-factors solution is processed, and their values are given in Table 3.
Table 3. Extracted and rotated values.
Rotated values
1 2
Q1 0.339 0.831 Q2 0.474 0.798 Q3 0.559 0.707 Q4 0.455 0.800 Q5 0.505 0.794 Q6 0.498 0.778 Q7 0.469 0.816 Q8 0.459 0.815 Q9 0.541 0.711 Q10 0.527 0.789 Q11 0.560 0.695 Q12 0.478 0.768 Q13 0.763 0.549 Q14 0.804 0.508 Q15 0.801 0.506 Q16 0.718 0.600 Q17 0.842 0.381 Q18 0.775 0.529 Q19 0.799 0.510 Q20 0.828 0.473 Q21 0.844 0.449 Q22 0.846 0.446 Q23 0.764 0.557 Q24 0.724 0.584 Q25 0.835 0.456 Q26 0.764 0.531 Q27 0.711 0.558 Q28 0.824 0.443
5 Energy Web and Information TechnologEAI Endorsed Transactions ieson
Here, the rotated sums of squared loading with 46.16% variance of factor 1 and 40.59% variance of factor 2. We have chosen 15 attributes from 33 attributes. Both factor 1 and factor 2 should satisfy the greater than the threshold value, 0.5 are extracted for further process.
c)Knowledge discovery process
Knowledge discovery process is an important step in the learning environment. The objective of our study is to explore the teaching quality of the instructors. That is, regardless of the type and subject of analysis, the ultimate objective of learning analytics must be to enable data-driven educational decision making at all levels. In order to predict the future events, the relationships between those attributes are analyzed using Paired t-tests method. As the name suggests, the attributes
are analyzed dependently for prediction process. We have analyzed the relationship between the attributes using 5-cross validation process. Table 5 gives you the results of paired sample test. The t-score is calculated from the below formula:
( 1 ) Where
Mean(x1)- mean of first set of factor values Mean (x2) - mean of second set of factor values S1- standard deviation of first set of factor values S2- standard deviation of second set of factor values N –Number of attributes
Table 5: Results of relationship process
Paired differences
Mean Std. Std. 95% confidence interval
Deviation Error Lower Bound
Pair1(Q3,Q5) 0.073 0.709 0.009 0.055 0.091
Pair2(Q9,Q10) 0.075 0.644 0.008 0.059 0.092
Pair3(Q11,Q13) 0.059 0.805 0.011 0.080 0.038
Pair4(Q14,Q18) 0.068 0.581 0.008 0.053 0.083
Pair5(Q24,Q26) 0.055 0.625 0.008 0.071 0.039
4 Discussion
This section discusses the achieved results using the dataset. The Experiment is implemented using SPSS software. It is processed in Turkiye student evaluation dataset obtained from the UCI machine repository. The attribute selection result shows that Q3, Q5, Q9, Q10, Q11, Q13, Q14, Q15, Q16, Q18, Q19, Q23, Q24, Q26, and Q27.
The objective of this study is to derive the knowledge about the teaching quality in higher education systems. The other attributes like
attendance, instructor, class and Q1 contain redundant value which throws lowest impact on the dataset. The data include two basic categories of variables. The first group consists of the data obtained from evaluation questionnaires where student’s response anonymously 13 questions about the course (Q1–Q6) and instructor (Q7–Q13) characteristics. The 5-point Likert scale is used in this questionnaire. The below three algorithms are used for validating the performance of the instructors.
6 Energy Web and Information TechnologEAI Endorsed Transactions ieson
Table 6Shows the accuracy prediction after the attribute evaluation process.
Algorithm Accuracy prediction Accuracy prediction for selected attributes for all attributes
Evaluation
J48 Decision tree [21] 85.1% 84.8%
Naïve bayes [21] 84.3% 83.3%
FA-Paired t-test 87.7% 85.09%
Table 7 Performance accuracy of each instructor individually
Algorithm Instructor 1 Instructor 2 Instructor 3
J48 DT [21] 85.4% 85.7% 82.8%
NB [21] 85.5% 86.8% 82.0%
FA-Paired t-test 99.1% 98.7% 98.5%
From the table 7, it is inferred that our proposed method exhibits the best performance than the other two algorithms, J48 and NB. The instructor 1 performed better than the other two instructors 2 and 3. The performance of each instructor is validated from the selected attributes. When compared to other two classifiers, J48 DT and NB, the proposed method shows better accuracy results.
5 Conclusion
This study investigates the quality factors associated with the evaluation of instructor’s performance. In order to upgrade the quality of Higher Education Systems (HES), the teacher-student association should strongly relate to each other. In this study, we have proposed a novel data mining algorithm, named, FA-Paired t-test method. The objective of the study is to derive the knowledge i.e associated factors for prediction of instructor’s quality. The Turkiye student’s evaluation dataset is used to meet our research objectives. Initially, the obtained records are pre processed and then the relevant attributes are extracted using Factor analysis method. This method is used for selecting the relevant attributes from the set of attributes which analyze the significance of each attribute. Then, the selected attributes are processed for finding the relationship between those attributes using Paired t-test model. The selected attributes are experimenting using SPSS modeler. On dealing with execution, many characteristics have been tried, and some of them are discovered
viably on the execution forecast. The substance arranging is the most grounded ascribe which helps to discover an execution of educators. The speed of conveyance characteristic did not demonstrate any unmistakable impact while the general finish obviously and consistency trait has demonstrated some impact in a portion of the trials for anticipating the execution. Different characteristics had a level of impact on anticipating the execution.
References
[1]Jui-Long Hung et al, “Identifying At-Risk Students for Early Interventions–A Time-Series Clustering Approach”, IEEE Transactions on Emerging Topics in Computing, 5(1), 2017.
[2]Beat A. Schwendimann et al, “Perceiving learning at a glance: A systematic literature review of learning dashboard research”, IEEE transactions on Learning Technologies, 10 (1), 2017.
[3]Ashish Dutt et al, “A Systematic Review on Educational Data Mining”, IEEE transactions on Content mining, Iss.99, 2017.
[4]Dong Sihui and Xu Xueguo, “Research on Tacit Knowledge Mining of University Libraries Based on Data Mining”, 13th International Conference on Service Systems and Service Management (ICSSSM), 2016
[5]Petra Vrablecová et al, “Supporting Semantic Annotation of Educational Content by Automatic Extraction of Hierarchical Domain Relationships”, IEEE transactions on learning technologies, 9(3), 2016.
7 EAI Endorsed Transactions
on
Readmissions through Clustering Based Actionable Knowledge Mining”, IEEE/WIC/ACM International Conference on Web Intelligence (WI), 2016.
[7]Tanvir Atahary et al, “Knowledge mining for cognitive agents through path based forward checking”, IEEE/ACIS 16th International Conference on Software Engineering, Artificial Intelligence, Networking and Parallel/Distributed Computing (SNPD), 2015.
[8]Yaoguang Hu et al,” Research on knowledge mining for agricultural machinery maintenance based on association rules”, IEEE 10th Conference on Industrial Electronics and Applications (ICIEA), 2015.
knowledge mining”, European Conference on Circuit Theory and Design (ECCTD), 2015.
[10]Jun Xie et al, “Knowledge Mining in Big Data — A Lesson From Algebraic Geometry”, IEEE International Conference on Granular Computing, 2013.
[11]Xin Chen et al, “Mining Social Media Data for Understanding Students’ Learning Experiences”, IEEE transactions on learning technologies, 7(3), 2013. [12]Dewan Md. Farid et al, “Knowledge mining for effective teaching and enhancing engineering education”, 7th International Conference on Electrical and Computer Engineering, 2012.
8 Energy Web and Information TechnologEAI Endorsed Transactions ieson