Abstract
The increasing deployment of small cells aimed at off-loading data traffic from macrocells in heterogeneous networks has resulted in a drastic increase in energy consumption in cellular networks. Energy consumption can be optimized in a self-organized way by adapting the number of active cells in response to the current traffic demand. In this paper we concentrate on the complex problem of how to identify small cells to be reactivated in situations where multiple cells are concurrently inactive. Solely based on the received signal strength, we present cell-specific patterns for the generation of unique cell fingerprints. The cell fingerprints of the deactivated cells are matched with measurements from a high data rate demanding mobile device to identify the most appropriate candidate. Our scheme results in a matching success rate of up to 100% to identify the best cell depending on the number of cells to be activated.
Received on 29 March 2014, accepted on 27 July 2014, published on 24 September 2014
Keywords: Cell identification, cellular network, energy saving, fingerprinting, heterogeneous networks, localization, Long Term Evolution (LTE), Self-Organizing Networks (SON), small cells;.
Copyright © 2014 Elke Roth-Mandutz et al., licensed to ICST. This is an open access article distributed under the terms of the Creative Commons Attribution licence (http://creativecommons.org/licenses/by/3.0/), which permits unlimited use, distribution and reproduction in any medium so long as the original work is properly cited.
doi: 10.4108/mca.1.4.e4
*Corresponding author. Email: [email protected]
1. Introduction
The massive mobile data growth throughout the world (81% in 2013 [1]) demands the deployment of a large number of additional base stations. To offload the mobile data traffic, legacy networks are expanded by underlaying small cells. However, deploying large numbers of additional cells increases the energy consumption of cellular networks for example by up to 40 % between 2010 and 2020 [2]. Consequently, for environmental and economic reasons, operators need to introduce energy saving approaches that do not negatively impact the network quality. The energy saving use case proposed by the 3rd Generation Partnership Project (3GPP) as part of Self-Organizing Networks (SON) [3] is seen as a promising approach, especially for heterogeneous networks.
As cellular networks are generally dimensioned for peak traffic, energy can be saved by adjusting the network capacity to match the prevalent traffic demand. Considering
the strong local and periodical mobile traffic variations during the course of the day [4], small cells may be deactivated during low traffic periods and reactivated on a need basis.
Adapting the number of active cells to the current traffic demand reduces significantly the network power consumption as given in [5], [6] and [7]. However, the power saving in heterogeneous networks varies strongly depending on factors such as the network and cell layout, the traffic patterns and the power model. In [5] and [6] several network scenarios are analysed with a network power consumption reduction of 26-63%. In [7], the power saving is up to 90% in case of weekend traffic in business areas. Otherwise the network power is reduced by 30-40%.
While the cell deactivation is performed autonomously by each cell during off-peak hours, the cell activation requires the processing and triggering of neighbor cells as detailed in [8].
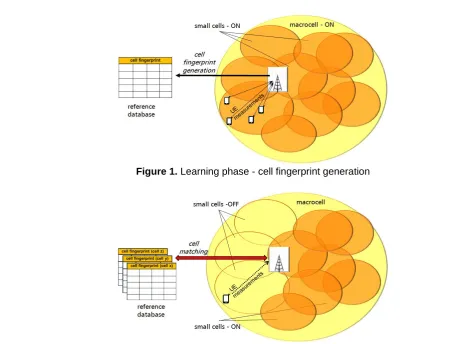
Figure 1. Learning phase - cell fingerprint generation
Figure 2. Operational phase - cell identification
(see [8]) is available on intelligent cell identification in the energy saving SON context. In this paper we present the fingerprinting method as an intelligent, self-organized approach to identify the most appropriate cell(s) to take over the emerging traffic. In contrast to the more common fingerprint applications for User Equipment (UE) positioning (e.g. [9], [10], [11], [12], [13], [14], [15] and [16]), this paper focuses on the identification of cell areas. The cell fingerprints are solely based on the Received Signal Strength (RSS) of the neighbor cells as measured by the UE. The neighbor cell RSS distributions are the input to derive specific cell patterns for the matching algorithm. The proposed cell fingerprinting method is a probabilistic approach, taking individual RSS distributions as well as RSS outliers into account. In the context of this paper, RSS is used interchangeably with Reference Signal Received Power (RSRP), the 3rd Generation Partnership Project (3GPP) term in Long Term Evolution (LTE) and Long Term Evolution - Advanced (LTE-A).
In the rest of this paper, we describe the framework for cell fingerprinting in Section 2, the simulation scenario in Section 3 and the simulation results in Section 4. We end with the conclusion and outlook in Section 5.
2. Framework for Cell Fingerprint Analysis
and Matching
As shown in Figure 1, we assume a heterogeneous network with macrocells underlaid by small cells as a second layer. While the macrocells provide basic network coverage, the small cells add the requisite additional capacity for mobile data traffic. In Figure 1 the macrocell is displayed as the large cell with multiple underlaying small cells. UEs located at different positions within a serving cell, scan the pilot channel to retrieve the RSS of all active neighbor cells. For the identification of deactivated cells we use the cell identity (cell id) and the associated RSS of its neighbor cells as measured by the UEs.
Figure 3. RSS distributions of different types of neighbor cells
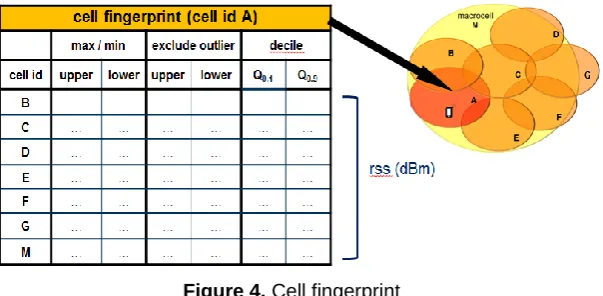
Figure 4. Cell fingerprint
The fingerprinting method involves two phases [12]: the learning phase for reference database preparation and the operational phase for cell identification by estimation of the cell location. During the learning phase (Figure 1) the cell fingerprints are generated and stored in the reference database as detailed in [8].
The operational phase (Figure 2) starts as soon as stable fingerprints are available. Any retrieved UE measurements in the operational phase are also incorporated into the cell fingerprints to keep the fingerprints updated. Continuous cell fingerprint updates are performed compensating any network modifications related to neighbor cell setting and signal strength as detailed in [8].
When the traffic in an active cell exceeds a predefined cell load, this cell initiates the cell activation procedure. As shown in Figure 2, UE measurements are retrieved and matched against the cell fingerprints of all inactive cells stored in the reference database of the overloaded cell. The best matching cell is identified as the cell providing the best radio conditions to take over the traffic from the overloaded cell, preferably from high data rate UE(s).
The cell activation procedure cannot be performed autonomously by the cell to be activated, but is triggered via the X2 interface by the neighbor cell performing the matching.
2.1. RSS Cell Fingerprint Generation and
Analysis
A cell fingerprint characterizes the radio conditions of the neighbor cells from the perspective of the UE. As a prerequisite for reliable cell fingerprints, RSS measurement samples are captured from multiple UEs at various positions within each cell. Figure 3 shows three examples of characteristic RSS probability distributions for different types of neighbor cells: a cell of the same BS (intra-BS adjacent cell), an adjacent cell of a different BS (inter-BS adjacent cell) and a not directly adjacent cell. The distributions represent the RSS measurements as retrieved by UEs connected to the same serving cell. Based on the analysis of multiple RSS distributions, the following characteristics were found:
Obviously, caused by the distance from the serving cell to the neighbor cell and environmental conditions, the neighbor cell distributions have different minimum and maximum RSS values, which partially overlap.
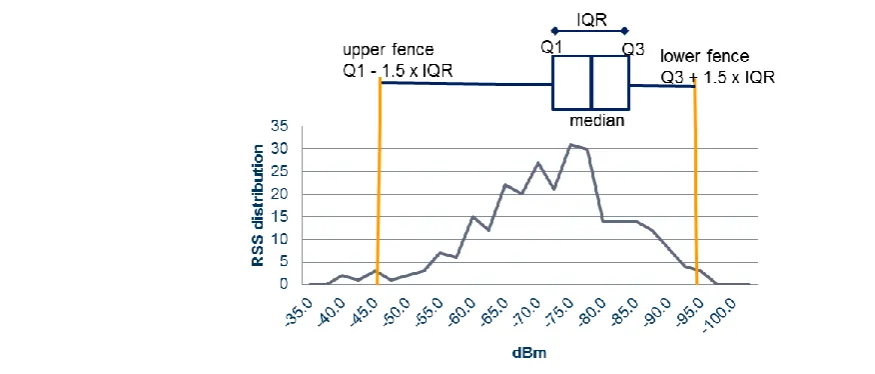
Figure 5. IQR based outlier upper and lower fence of an inter-BS neighbor cell
considered as a valid approach for modelling the RSS distributions.
Furthermore, outliers i.e., RSS measures distinctly separate from the rest of the RSS measures, were observed.
Based on the characteristics of the RSS distributions, cell patterns are derived for the cell matching procedure. The cell patterns provide the essential cell characteristics of the cell fingerprint shown in Figure 4. Each sample of an upper and lower fence for a given neighbor cell id results in one data record of the cell fingerprint. The complete cell fingerprint consists of a list of all neighbor cell ids with a data record for each neighbor. More details on cell patterns are given in Section 2.4.
2.2. RSS Outliers
In practice, outliers are unavoidable mainly due to hardware malfunction or failure, environmental factors or adversary attacks [17]. Outliers are RSS values numerically distant from the rest of the RSS measures. They may skew the RSS measurements and endanger the validity of the cell fingerprints. To ensure robust fingerprints, outliers should be discarded or separately treated during the matching process. Figure 5 shows an example for the upper and lower outlier fences.
One widely used and simple approach to calculate outliers is based on quartiles [18] using the box plot for graphical presentation. Any measurement outside the quartile-based upper and lower fence is seen as a potential outlier. First the interquartile range (IQR) is calculated, defined as the range between the first quartile Q1 and the third quartile Q3. The fences are then calculated as in equations (2) and (3).
– . (1)
– . (2)
In case of a high IQR, the fence may exceed the minimum and/or maximum RSS sample. If so, the concerned outlier fence is replaced by the appropriate minimum and/or maximum RSS sample. The upper and lower outlier fences provide the range for measurements considered as unreliable.
2.3. Matching Algorithm
Based on a matching algorithm, the cell with the best matching cell fingerprint is identified as the appropriate cell to take over mobile data traffic. Any macrocell or small cell that is a neighbor cell to the deactivated cell may initiate the cell identification procedure. Two preconditions must be fulfilled to initiate the cell activation procedure. First, the measured traffic in a cell must exceed a predefined threshold indicating the need for additional capacity. Second, there should be more than one neighbor cell that is deactivated. Otherwise, if only one neighbor cell is deactivated, this cell is activated immediately.
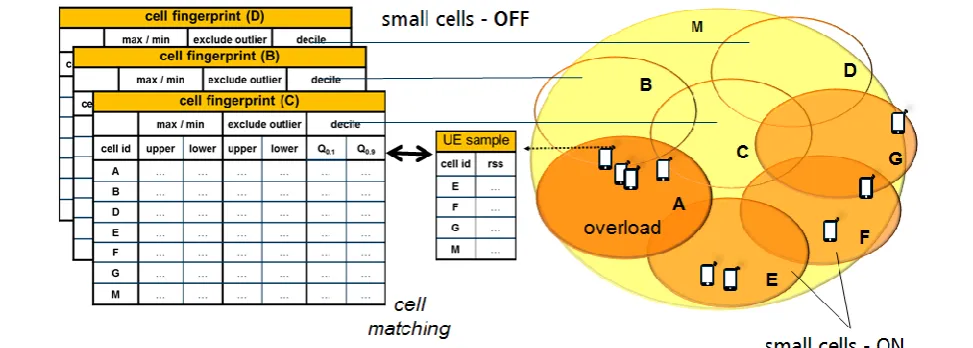
Figure 6 gives an example of the cell identification procedure, where the cells B, C and D are initially switched off. Due to the presence of a high data rate user at the edge of cell B, cell A experiences high load. Cell A thus initiates the cell identification and activation procedure. The complete procedure can be broken into 3 major activities - retrieval of a sample measurement, fingerprint matching and cell selection.
(i) UE measurement sample(s): To initiate the cell identification procedure, one or multiple UE measurement samples are retrieved from a high data demanding UE of the overloaded cell (Figure 6). This sample is to be used to match against all available fingerprints.
Figure 6. Cell Matching
Figure 7. Cell matching algorithm
deactivated cells included in the cell fingerprints are ignored. The matching of fingerprints is done based on the characteristics of the ranges of RSS values for the respective cells. Three such options, which we refer to as RSS patterns, are considered for the matching as described in the next section. (iii) Cell selection: For each patterns used, the degree of
matching of the sample to the each fingerprint (inactive cell) is scored. Then, the cell(s) with the highest number of scores are determined as the best fitting cell(s) to be activated. The number of cells to be concurrently activated is controlled by input policy as set by the operator. Meanwhile, the activation of the selected cell(s) is triggered via the X2 interface by the overloaded cell that undertakes the matching.
2.4. Matching Patterns
We consider three RSS patterns whose respective scores are incremented when a cell in the UE measurement sample matches to a fingerprint as shown in Figure 6. In each case, the cell is considered to match the fingerprint, if two conditions are fulfilled:
(i) the cell id of the UE measurement sample matches the cell id in the fingerprint and
(ii) the RSS of the UE measurement sample falls within the fingerprint RSS range defined by the pattern.
The patterns and their associated scores represent (see Figure 7):
(i) minMax: the score sMinMax is incremented, if the received measurement lies within the minimum to maximum RSS (minMax) range for the given neighbor cell.
(ii) exclOutlier: the score sExclOutlier is incremented, if the measurement lies within the exclOutlier range that excludes outliers as described in Section 2.2.
(iii) decile: the score sDecile is incremented, if the received measurement lies within the RSS range between the lower and the upper decile.
(iv) sum: the sum of the scores of the three single patterns. It adds up the scores to compensate for possible limitations of the individual pattern.
3. Simulation Scenario and Environment
Simulation studies were done using a C++ implementation of an event-driven LTE downlink system level simulator based on software libraries provided by Alcatel-Lucent Bell Labs Germany and the University of Stuttgart’s Institute of Communication Networks and Computer Engineering.
The network environment assumes an urban area covered by a small-cell network overlaid with a legacy network. Cells in the overlay network are considered to be always on, ensuring stable coverage for low data rate users. The simulated network scenario consists of 7 base stations (BS) each with 3 cells (Figure 8) representing the 21 small cells expected to serve high data rate UEs. Any of the small cells may be deactivated or activated depending on the prevailing data traffic demand as the coverage is still provided by the legacy network. For the analysis and validation of the cell fingerprinting principles, the simulation is restricted to 21 small cells. Additional neighbors from the legacy network are assumed not to impact the cell fingerprinting principle, but may provide additional accuracy by adding further cell fingerprints.
The simulation is split into two phases, the cell fingerprint generation followed by the cell identification phase. We assume that all users are connected to the network throughout the complete simulation interval. A prerequisite for the generation of reliable cell fingerprints is the recording of UE RSS measurements from different positions per cell area. 60 mobile users, which are initially randomly placed in the coverage area, move with a random-walk mobility model. For modelling the mobility in urban area and thus ensure UE measurements from multiple and varying positions, three mobile user groups are considered. The three mobile user groups consisting of 20 users each represent typical speed groups in urban area, i.e., pedestrians, bicycles and cars. Each mobile user group uses a defined speed varying by 40% as detailed in Table 1.
For cell fingerprinting the relevant measurements are the unique identification of the neighbor cell, i.e., the target cell id (TCI) and the associated RSS cell patterns as shown in Figure 4. A snapshot of UE measurement samples from all UEs is taken every 20 seconds. To ensure uniformly distributed statistics for fingerprint generation, the simulations are repeated in multiple batches with each batch simulating a network operation of 100s. In each batch, users are repositioned into the network and connected to the best serving cell. Besides 3 simulations respectively running 50, 100 and 200 batches were executed generating 3 fingerprint databases each based on a different number of UE measurements. In all 3 simulations an average number of 14.14 UE measurements per batch was used for each cell, i.e., for 200 simulation runs the computed cell fingerprints were based on an average of 2828 UE measurements per cell. UE measurement samples collected from all simulation runs are equally weighted. 1.4% of the UE measurements are marked as outliers according to (1).
On completion, the cell fingerprints are computed. To evaluate cell matching, one UE measurement sample per cell is taken from a consecutive simulation run and matched against all cell fingerprints. Details of the simulation assumptions and parameters are given in Table 1. While we present simulation results for one carrier, it is assumed, that fingerprinting works in a similar fashion on multiple carrier frequencies as detailed in [19].
Figure 8. Network Setup
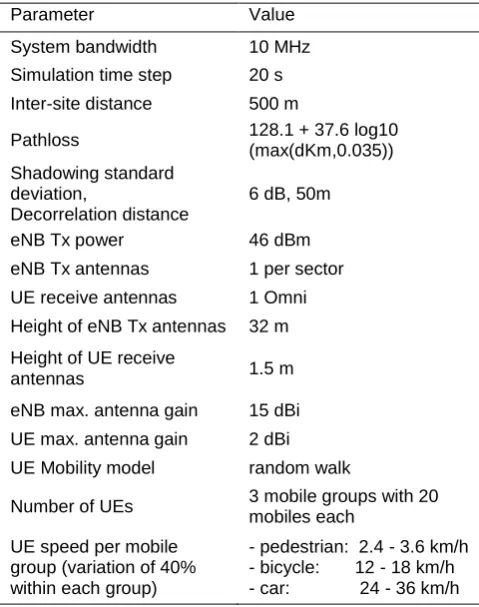
Table 1. LTE simulator – system parameters and values
Parameter Value
System bandwidth 10 MHz
Simulation time step 20 s Inter-site distance 500 m
Pathloss 128.1 + 37.6 log10
(max(dKm,0.035)) Shadowing standard
deviation,
Decorrelation distance
6 dB, 50m
eNB Tx power 46 dBm
eNB Tx antennas 1 per sector UE receive antennas 1 Omni Height of eNB Tx antennas 32 m Height of UE receive
antennas 1.5 m
eNB max. antenna gain 15 dBi UE max. antenna gain 2 dBi UE Mobility model random walk
Number of UEs 3 mobile groups with 20 mobiles each
UE speed per mobile group (variation of 40% within each group)
neighbour showing the four patterns
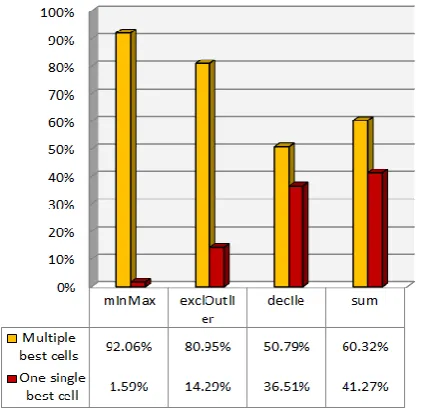
Figure 10. Matching results: Multiple best cells vs. one single best cell
Table 2. Number of cells with highest score
Average number of cells achieving the highest score
minMax exclOutlier decile sum 8.37 3.60 1.49 1.29
4. Simulation Results
In this section we show the results of our simulations. First, we present a typical profile of the RSS measurements highlighting the four patterns. We then show the results of the matching algorithm based on the three patterns and their combination.
of all neighbour cells each with such a data record of fence values for the three patterns.
4.2. Success of Cell Matching
For the matching, we wish to determine the deactivated cell(s) to which the candidate UE would be connected at the time the UE measurement sample was sent, if all cells had been active. We distinguish two cases:
(i) single candidate cell - the case where the cell patterns identify exactly the true serving cell based on the highest scores as the one best cell and (ii) candidate cell set - the case where the cell patterns
identify the best candidate cell as the one best cell or multiple best cells including the true best cell, if the highest score is computed for multiple cells. The candidate set, the size of which is the number of cells achieving the highest score, may be seen as a set of neighbor cells that could all effectively serve the candidate UE. The candidate cell set includes both cases, one single and multiple best cells
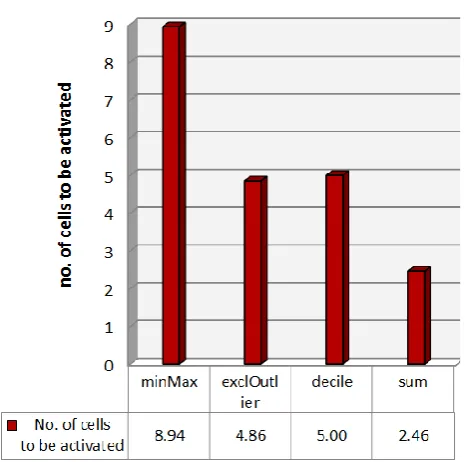
Figure 11. Average number of cells to be activated to include the candidate cell
The exclOutlier pattern improves isolation of the true serving cell candidate achieving more than 14% success, but with worse general results (81%). Thus, removing outliers causes significantly less false positive reducing the average number of candidates to 3.6.
Similar behaviour is observed with the decile pattern, which improves the isolation of a single candidate to 37% albeit with reduced general success of only 51%, when multiple cell activation is accepted. The exclusion of the upper and lower decile at the edges of the RSS range eliminates multiple valid RSS values. However, this pattern is used in combination with the minMax and exclOutlier patterns for the sum pattern giving higher weight to the more reliable and stable RSS values around the median.
Finally the sum adds up the scores of the three single patterns to compensate for possible limitations of the individual pattern. We assume, that the combination of the 3 patterns with higher weight given to the more reliable and stable RSS values around the median, improve the success to identify the true candidate cell. In so doing, values within the decile range are scored 3 times, i.e., for the minMax, the exclOutlier and the decile pattern resulting in a weighting factor of 3 for the more reliable values. In contrast, values within the minimum to maximum range but computed as outliers are scored only once by the minMax pattern giving in a weighting factor of 1 for the less reliable values at the very edge of the pattern range.
Figure 10 shows for the sum pattern a hit rate exceeding 60 %, if a single candidate or candidate set is accepted. This result is impacted by the very low average number of 1.3 cells given in Table 2 achieving the highest score, i.e., in average only 1.3 cells would be activated with more than 60 % probability to include the true serving cell. The low number of cells to be activated primarily originates in the extended range of the scores for the sum pattern caused by adding up the scores of the three patterns. Thus, the probability for multiple identical high scores decreases. Consequentially, for exclusive detection of the true best cell, the sum pattern achieves with more than 41% the best result for single candidate identification.
4.3. Cell Pattern Accuracy
Restricting the activation set (the cells that should be activated) to the cell(s) achieving the highest score, disregards any other cell that could be activated. Analysing the scoring results, the true serving cells often achieves just one score less than the highest score. In this section, we wish to compare the accuracy and thus the impact on the energy efficiency of each cell pattern by evaluating the number of cells required for activation if the true serving cell is to be included in the activation set; regardless
whether the true serving cell achieved the highest score or not. For example, an activation set of 3 cells is required if the true serving cell achieves the second highest score while two other cells got the highest score or if all three cells achieve the highest score. Both cases would be considered equivalent since the focus is on the minimum number of cells required to include the true server.
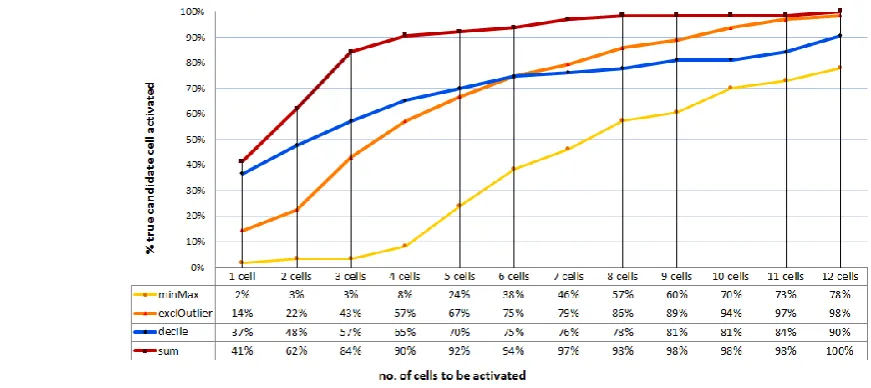
Figure 11 presents the average size of the activation set for each of the patterns if the true server is to be included in the activation set. Figure 12 then gives the detailed description in terms of the probability of activating the true server for selected sizes of the activation set. We observe in Figure 11 that the sum pattern achieves the best result with an average size of the activation set of 2.5 cells contrasted to minMax that requires almost 9 cells in order to ensure inclusion of the true server.
5. Conclusion and Future Outlook
In this paper we showed that cell fingerprinting is a promising approach for the identification of inactive cells in cellular networks. The intelligent, self-organized approach is a big step forward for the implementation of the energy saving SON. It is a simple, distributed solution affecting the base station only and requires no extra interface.
While we describe the cell fingerprinting approach in the energy saving context, it may also be applicable in other cell location sensitive applications, such as macrocell to microcell handover to identify the best cell to take over the data traffic or for minimizing drive tests as localization information.
Best results were achieved using the sum pattern. If all cells were considered for activation, 90% matching with the true candidate cell were achieved, if 4 cells were activated, 97% in case of 7 cells and 100% in case 12 cells were activated (Figure 12). However, the more cells are activated, the more the energy efficiency is impacted. But even in case just one single cell should be activated, the sum pattern reached with more than 60 % matching the best results.
Ongoing studies indicate in case another cell exceeds the scores of the best candidate, this cell is virtually always an adjacent neighbor of the candidate cell, which is expected to relieve the overloaded cell. Furthermore, we expect a major matching improvement by using more than one UE measurement for the matching. Besides the matching algorithm, the design of the cell patterns is found to be the challenging task.
Meanwhile, further studies are planned to investigate the impact of multiple switched off cells with low numbers of neighbor cell RSS values for the matching and the use of additional cell patterns in the matching procedure on the stability of the algorithms.
Acknowledgements.
We would like to thank Siegfried Klein and Edgar Kühn from Alcatel-Lucent Bell Labs, Germany for their support with the simulator libraries.
References
[1] Cisco VNI Mobile. Cisco Visual Networking Index: Global Mobile Data Traffic Forecast Update 2013–2018.
http://www.cisco.com/c/en/us/solutions/collateral/service- provider/visual-networking-index-vni/white_paper_c11-520862.html (accessed on 24 February 2014).
[2] Biczók, G., Malmodin, J., Fehske, A. (2011) Economic and Ecological Impact of ICT. EARTH Project, Public
Deliverable D2.1(2.0).
[3] 3GPP Evolved Universal Terrestrial Radio Access Network (E-UTRAN (2011) Self-configuring and self-optimizing network use cases and solutions (Release 9). TR
36.902(V9.3.1).
[4] 3GPP Telecommunication Management (2010) Study on Energy Saving Management (ESM) (Release 10). TS
32.826(V10.0.0).
[5] Hiltunen, K., (2013) Utilizing eNodeB sleep mode to improve the energy-efficiency of dense LTE networks. In Proceedings
of the24th International Symposium on Personal Indoor and
Mobile Radio Communications (PIMRC), London, United
Kingdom, 8-11 Sept. 2013: 3249-3253.
doi: 10.1109/PIMRC.2013.6666707.
[6] Hiltunen, K., (2013) Improving the energy-efficiency of dense LTE networks by adaptive activation of cells. In
Proceedings of the Communications Workshops (ICC),
Budapest, Hungary, 9-13 June 2013: 1150-1154.
doi: 10.1109/ICCW.2013.6649410.
[7] Marsan, M.A., Chiaraviglio, L., Ciullo, D., Meo, M. (2013) On the Effectiveness of Single and Multiple Base Station Sleep Modes in Cellular Networks. Computer Networks,
57(17): 3276-3290. doi: 10.1016/j.comnet.2013.07.016. [8] Roth-Mandutz, E., Mitschele-Thiel, A. (2013) LTE Energy
Saving SON Using Fingerprinting for Identification of Cells to be Activated. In Proceedings of Future Network & Mobile
Summit, Lisbon, Portugal, 3-5 July 2013: 1-8.
[9] Wigren, T. (2011) Clustering and Polygon Merging Algorithms for Fingerprinting Positioning in LTE. In
Proceedings of 5th International Conference on Signal
Processing and Communication Systems (ICSPCS),
Honolulu, Hawaii, USA, 12-14 December 2011: 1-10.
Telecommunications Forum (TELFOR), Belgrade, Serbia,
20-22 November 2012: 1788-1791.
[11] Vaupel, T., Seitz, J., Kiefer, F., Haimerl, S., Thielecke, J. (2010) Wi-Fi positioning: System considerations and device calibration. In Proceedings of International Conference on Indoor Positioning and Indoor Navigation (IPIN), Zurich,
Switzerland, 15-17 September 2010: 1-7.
[12] Xin-di, L., Wei H.; Zeng-shan, T. (2012) The Improvement of RSS-based Location Fingerprint Technology for Cellular Networks. In Proceedings of International Conference on
Computer Science and Service System (CSSS), Nanjing,
China, 11-13 August 2012: 1267-1270.
[13] Hossain, M., Nguyen Van, H., Soh, W.-S. (2008) Fingerprint-based Location Estimation with Virtual Access Points. In
Proceedings of the 17th International Conference on Computer Communications and Networks (IEEE ICCCN), St.
Thomas, Virgin Islands, USA, 3-7 August 2008: 1-6.
[14] Rao, P., Siccardo, P. (2001) Location determination using RF fingerprinting. U.S. Patent US6269246 B1, 31 July 2001.
[15] Stella, M.., Russo, M., Begusic, D. (2007) Location Determination in Indoor Environment based on RSS Fingerprinting and Artificial Neural Network. In Proceedings of 9th International Conference on Telecommunications
(ConTel), Zagreb, Croatia, 13-15 June 2007: 301-306.
[16] Mo, Y., CAO, Z., Wang, B. (2012) Occurrence-Based Fingerprint Clustering for Fast Pattern-Matching Location Determination. IEEE Communications Letter, 16(12): 2012-2015. doi: 10.1109/LCOMM.2012.111412.121909.
[17] Lirong J., Zheng Y., Yunhao L. (2011) Beyond Triangle Inequality: Sifting Noisy and Outlier Distance Measurements
for Localization. In Proceedings of the INFOCOM (IEEE),
San Diego, California, USA, 14-19 March 2010: 1-9.
[18] Tukey, J. W. (1977) Exploratory Data Analysis, 1st ed. (Reading, Mass.: Addison Wesley Pub Co Inc).
[19] Prasad, A., Tirkkonen, O., Lunden, P., Yilmaz, O.N.C., Dalsgaard, L., Wijting, C. (2013) Energy-efficient inter-frequency small cell discovery techniques for LTE-advanced heterogeneous network deployments. IEEE Communications