© 2016 IJSRSET | Volume 2 | Issue 1 | Print ISSN : 2395-1990 | Online ISSN : 2394-4099 Themed Section: Engineering and Technology
Application of SCS-CN for Estimation of Non-Point Source Storm
Water Surface Runoff Using Spatial Information & GIS Integrated
Event Based Hydrological Model
Narasayya Kamuju
Central Water and Power Research Station, Pune, Maharashtra, India
ABSTRACT
Coastal and Inland water quality issues are of increasing concern among water resources managers and planners worldwide as pollution and sediment levels from point source and non-point source to continue to mount. Prediction of surface runoff is one of the most useful capabilities of GIS system. Calculation of runoff can be used to estimate the impact of developments in the basin with computation of pre and post runoff at catchment outlet. In the present paper simple approach of runoff analysis by the use of the event based hydrological model of „Non-Point Source Pollution and Erosion Comparison Tool‟ (N-SPECT) with elevation, land cover, soils and precipitation data sets are processed. This model utilises Soil Conservation Services- Curve Number (SCS-CN) approach to estimate surface runoff on event base of the basin. To apply this model, a sub-basin of „Bhima‟ named as „Karha‟ basin is chosen as study area with relevant grid maps. In this approach, the spatial pattern of accumulated runoff analysis has been studied, though the model has the capability to predict pollution and erosion events. The results obtained from N-SPECT Model is that the accumulated runoff volume is 2.07222 e+011 (L) which is equivalent to 207.22 Gm3 and the observed runoff at Barahanpur gauge station is 233.86 mm. The predicted runoff from N-SPECT model is nearly 70% of the observed runoff.
Keywords : Accumulated Runoff, Curve Number, Hydrological Model, N-SPECT, Remote Sensing
I.
INTRODUCTION
Hydrologic models are symbolic or mathematical representation of known or assumed functions expressing the various components of hydrological cycle (Beven k.J et al.,1979). Estimation of surface runoff is one of the most useful capabilities of Geographical Information System (GIS) using satellite and remote sensing data. For flood forecasting in ungauged catchments, it is necessary to know the relationship between precipitation and runoff. Knowing the amount of runoff from a catchment gains a vital importance thus calls for the use of a precise hydrological model. According to Singh, V. P. (Singh V.P, 1988), the Rainfall-Runoff models can be classified according to their degree of representation of the physical processes and to the spatial and temporal description. Moreover, physically based models are the closest representation of the real system and try to incorporate as many components of actual physical processes as possible.
Cowan (1975) SCS-CN method is comfortably used for estimation of runoff in a watershed where soils, vegetation and other characteristics affecting runoff have not been evaluated experimentally. Apart from this method, there are also other models used in different studies, such as: KINEROS (Hernandez M., et al 2010),
to the estimation of runoff, these calculations are the basis of many of the other N-SPECT functions and processes (Schueler,et al, 2000).
1. Study Area
Karha river basin in Maharashtra State, is a part of Neera basin which is a sub-basin of Bhima river basin. Karha is the principal river of the Karha basin. The river originates in the hills of Sahyadri, upstream of village Garade and flows through Purandar hills, plateau region of Kade Pathar, plains of Baramati region of Pune District and then joins river Neera. The basin is landlocked between Upper Bhima basin and the remaining Neera basin. The river is seasonal in nature, flows in monsoon months only. The river is intermittent since i.e. streamflow falls to zero most of the time, especially during non-monsoon period. It is one of the driest watersheds of the Bhima basin classified under drought-prone zone. The catchment area of Karha basin is 1317 km2. The location map of the Karha basin is shown in Fig. 1. The river is gauged at Barhanpur by Water Resources Division (WRD) of Government of Maharashtra. The commencement of the hydrologic year for the Karha basin in the month of June, when groundwater is at its lowest water level.
Figure 1: Location Map of Karha Watershed
2. Input Data Sets
The material required for the models in respect of spatial data and hydrometeorological data prepared in the form of grid and shape file format as thematic layers as fallows.
A. Thematic layers
Digital elevation model (DEM)
Land cover grid
Soils shapefile
Rainfall grid
R-factor grid
N-SPECT makes use of a variety of data sets, but only a few of these are required for basic analyses. Preparation of each input data set in the form of thematic layer is described in detailed as fallows.
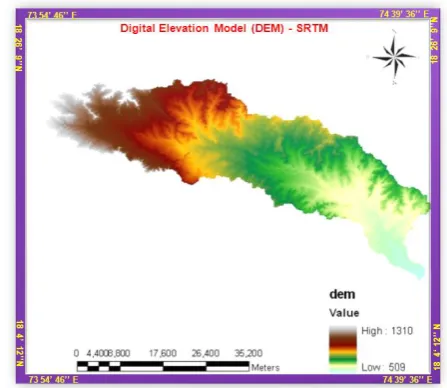
B. Digital elevation model (DEM)
A 90-meter SRTM digital elevation model data down loaded from website (
srtm.usgs.jspacesystems.or.jp/)
and re-sampled to a 24-meter grid. Although Care must be taken to ensure the grid cells of the DEM and land cover data sets (and all other grid data sets) are aligned to each other. The entire runoff and pollutant routing process is based on flow direction and flow accumulation grids derived from the DEM. Although it is possible to use higher resolution DEMs with N-SPECT, these data sets will result in increased processing times. The filled SRTM–DEM is used as one of the input data as shown in Fig:2.
Figure 2 : Digital Elevation Model Grid Map
C. Land cover grid
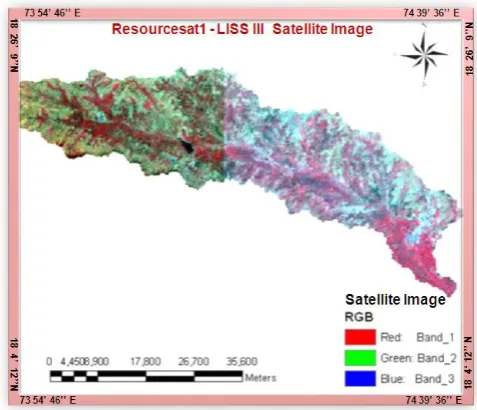
toposheets 43H15, 43H16, 43I07, 43I8, 43I11 and 43I12. All the images are mosaic into a single image and the next step is to subset and reproject the data using ArcGIS software package. All input data sets must be converted to a common projection into UTM Zone 43 with datum WGS 1984. Finally, export the image file as a grid as shown in Fig: 3.
Figure 3: LISS III satellite Image Grid Map The National Remote Sensing Centre supplied the Land cover classes of the entire India. The NRSC-BHUVAN web site supply the digital land cover classes of the entire India(Website:bhuvan.nrsc.thematic).
Figure 4: Land use –Land Cover map of Karha Basin
This thematic layer gave preliminary idea to classify the Karha basin into 9 different land use /land cover classifications. From 1302 kmn2 area of the karha basin, Agricultural group of land classes covered a higher percentage of about 36, forest classes covered 32% and lowest percentage of 0.38% of area covered water bodies. The classified land use land cover amp is shown in Fig :4.
D.Soils shape file
The soils data used to run N-SPECT is taken from the U.S. Department of Agriculture‟s (USDA) Food and Agricultural Organization (FAO) database (Website: FAO) specifications are necessary before the data can be loaded into N-SPECT. The layer table contains the kfactor values, the comp table contains the hydrologic soil group attributes, and the mapunit table contains the information needed to link the comp and layer tables to the shapefile. While each soil unit is associated with one unique component, each component may be associated with many layers. This one-to-many relationship must be simplified before the soil features are converted to rasters. Once all the joins have been established, the shapefile can be exported and cleaned to eliminate the unnecessary fields contained in the attribute table. Occasionally (usually when a polygon is over water) there records do not contain kfactor or hydrologic soil group data. N-SPECT has a tool (in NSPECT à Advanced Settings à Soils) that allows a user to define a new soils data set.
Use the newly created shapefile and select the appropriate fields for kfactor and hydrologic soil group. In these instances, the user must populate these fields with conservative data. Set the kfactor to 0 and the hydrologic soil group to D, unless prior knowledge indicates that different values are more appropriate. The karha basin has 854 km2 area covered under Hydrologic Soil Group (HSG) of C, HSG of B covered an area of 268 km2, and 175 km2, 9.14 km2 area under A and D. The study area of Karah basin covered a highest percentage of about 65% contains HSG of C and least percentage of 0.7% contains HSG of D type of soils as shown in Fig: 5.
E. Rainfall grid
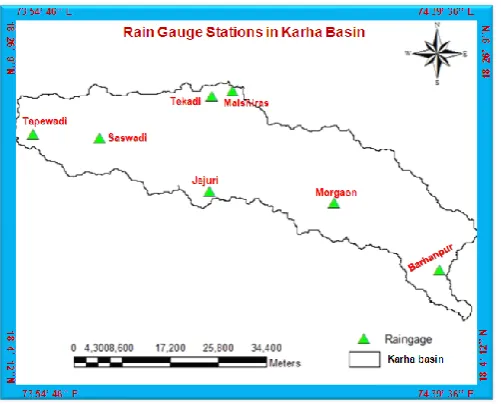
The runoff component of N-SPECT is driven by the precipitation grid. N-SPECT includes several precipitation grids for the Karha watershed region, but the tool also allows users to import additional precipitation grids for other regions. The Indian Meteorological Department (IMD) is the primary repository for precipitation data collected by stations in the present watershed. There are 7 rain gage stations are available in the Kara basin namely Tapewadi, Saswadi, Jejuri, Tekodi, Malshiras, Morgaon, and Barhanpur. Each station contains 28 years daily rainfall data from 1983 to 2007. The location of rain gauge stations shown in Fig: 6. Each rain gauge station prepared as shape file in ArcGIS environment and enters annual rainfall for each station in attribute table.
Figure 6: Rain gauge Stations Covered in Karha Basin
F. R-factor grid
After preparation of a rainfall data for each station, the shape file is converted in to a raster map using raster calculator in spatial analyst tools. This point map of rainfall is interpolate to raster map using Inverse Distance Weighted (IDW) method and converted into a grid map. The prepared grid map of Rfactor is shown in Fig.7.
Figure 7: IDW Method used Rainfall Factor Map
II.
METHODOLOGY
N-SPECT uses the method presented in the Natural Resources Conservation Service‟s Urban Hydrology for Small Watersheds: Technical Release 55 as the basis for its runoff estimates (USDA-NRCS. 1986)
A. SCS Curve Number Method
Q = (P – Ia)2 / [(P – Ia) + S] Ia = 0.2 * S
S = (1000 / CN) – 10 Where:
Q = runoff (in) P = rainfall (in)
S = potential maximum retention after runoff begins (in)
If the initial abstraction at a given cell is greater than the rainfall at that cell, N-SPECT sets runoff depth to zero. This prevents the reintroduction of artificial sinks to the runoff analysis. Runoff curve numbers were developed by NRCS based on soil properties and represent overall permeability. This number varies from 0 (100 percent rainfall infiltration) to 100 (0 percent infiltration i.e., pavement) and is used to estimate runoff depth. N-SPECT generates a curve number grid based on the combination of land cover and hydrologic soil group at each cell within a given analysis area retention represents the ability of the soil to absorb or retain moisture. Precipitation that is absorbed or retained by the soil does not contribute to runoff. N-SPECT calculates retention at each grid cell as shown below:
Retention, S = (1000 / Curve Number) – 10
Abstraction refers to the losses that occur before runoff begins. This can include water stored by surface depressions and water intercepted by vegetation, evaporation, and infiltration. N-SPECT calculates abstraction at each grid cell as shown below:
Abstraction, Ia = (0.2 * Retention)
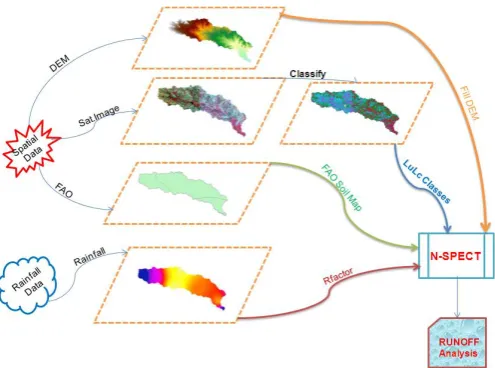
The entire methodology applied for N-SPECT Model is shown in Fig: 8.
Figure 8: Methodology Applied for N-SPECT Model
B. Calculate Runoff
Event -based runoff depth is estimated according to the following equation taken directly from Technical Release 55:
Runoff Depth = (Rainfall – Abstraction)2 / (Rainfall – Abstraction) + Retention
N-SPECT checks for instances where abstraction is greater than rainfall and sets runoff to zero. This method is designed for average conditions, does not explicitly account for rainfall intensity or duration, and is less accurate when precipitation is 0.5 inches or less (NOAA, N-SPECT,User‟s Manual, 2004).
Annual runoff depth is estimated based on the following equation, which accounts for the average number of days it rains per year. The estimated abstraction and retention are multiplied by the number of rain days, thus reducing estimated runoff.
Runoff Depth =
(Rainfall – (Abstraction * Rain Days))2 / [(Rainfall – (Abstraction * Rain Days)) + (Retention * Rain Days)]
C. Over View of N-SPECT MODEL
annual conditions. The runoff curve number (also called a curve number, or CN) is a parameter that is related to an area‟s hydrologic soil group and land use or land cover. N-SPECT stores curve numbers in a personal geo-database, allowing users to add, modify, and delete values through the GUI. Once finished the run new raster layers are produced. Through GIS functions of flow direction and flow accumulation, the output data show how accumulated runoff transported through landscapes (NOAA, N-SPECT, Technical Guide, 2004). The screen shot of the N-SPECT Model is shown in Fig.9.
Figure 9: Screen shot view of N-SPECT Model
III.
RESULTS AND DISCUSSION
Model Application and Discussion
A typical N-SPECT run begins with watershed delineation. N-SPECT removes artificial sinks and other imperfections that are commonly found in raw topography data sets using the FILL command. The accumulated runoff grid displays accumulated volume (litres) of water at each cell in the analysis area. The accumulated runoff obtained for Karah watershed is 2.07222 x 10¹¹ L is equivalent to 207222 ML and is equal to 207.222 Gm3. The accumulated runoff for karah watershed from N-SPECT model is 157.34 mm. The spatial pattern of accumulated runoff is shown in Fig.10.
Figure 10: Accumulated Runoff Volume (L) The figure 10 reveals that the lowest runoff is showing at upstream end of the karah basin, because of its higher topography. And it is difficult to visualize the topography and placing it beneath the drainage network as shown in Figure10. To overcome this difficulty, creating a sun-illuminated view of the topography and placing it beneath the N-SPECT resulted runoff data helps the user to visualize unique watersheds and better understand the topographic influence on runoff patterns across the landscape. Keeping in view of this a sun-illuminated Fig.11 was developed. These drainage patterns indicate that streams in the Karha basin transported runoff very quickly without much opportunity for instream or floodplain deposition.
IV.
CONCLUSION
N-SPECT is a Geographical Information System tool implemented to assess spatial pattern of surface water runoff. The ESRI ArcMap software package requires land cover, topography, soils in the form of spatial information from Remote Sensing Technology along with precipitation data sets to estimate storm water runoff volume at both the local and watershed scales. The model predicted the accumulated surface runoff volume is 207.22 Gm3. The observed runoff at the Barhanpur gauge station is 308 Gm3. The advantage of this model is that the accumulated runoff volume shown in spatial pattern. This approach allows the user to more easily identify specific areas of concern that may be logical targets for further investigation and monitoring. The observed runoff from gauge discharge site at Barhanpur is 233.86 mm and the predicted surface runoff is 157.34 mm from N-SPECT Model. The estimated runoff from event based model is about 70% of the observed runoff. One of the physiographic reason of karha basin for the low prediction of runoff is that more than 65% of the area covered with Agricultural fallow land, also forest type of land is nearly 25%. Where the soil covered under such type of land, the HSG Curve Number (CN) values are less, therefore it leads to more infiltration and resulted in obtain less runoff rates. The other reason is the gauge discharge site is 5 km upstream to the end point of the Karha basin, so that the discharge between Barhanpur and tail portion of the catchment is not included in the observed runoff. Therefore, the application of N-SPECT model is reliable tool for hydrologists and environmentalists to use this model for different problems.
V.
REFERENCES
[1] AlFugura A., Billa, L., Pradhan B., Mohamed T.A., Rawashdeh S., Coupling of hydrodynamic model and aerial photogrammetry-derived digital surface model for floods simulation scenarios using GIS: Kuala Lumpur flood, Malaysia, Disaster Advances, 4(4), 2011, 20-28 [2] Beven K. J. and Kirkby M. J., 1979, “A physical based variable
contributing area model of basin hydrology”, Hydrological Science Bulletin, 24 (1), pp 43-69.
[3] Billa L., Assilzadeh H., Mansor S., Mahmud A. R., Ghazali A. H., Comparison of recorded rainfall with quantitative precipitation forecast in a rainfall-runoff simulation for the
Langat River basin, Malaysia,
Central European Journal ofGeosciences, 3(3), 2011, 309-317.
[4] Domnita M., Runoff modeling using GIS. Application in torrential basins in the 591 Apuseni Mountains, Ph.D Thesis, Cluj Napoca. 2012
[5] Food and Agricultural Organization (FAO) Web site for digital soil map: http://www.fao.org/soils-portal/soil-survey/soil-maps/Last Accessed December 18, 2015.
[6] Hernandez M., Miller S. N., Goodrich D. C., Goff B. F., Kepner W. G., Edmonds C. M., Jones K. B., Modeling runoff response to land cover and rainfall spatial variability in semi-arid watersheds, Environmental Monitoring And Assessment, 64, 2000, 285-298.Sciences, Vol.22 (3) M, 889-894, (2010). [7] Kopp, S., Noman, N., 2008. ArcGIS Spatial Analyst-Hydrologic
Modeling, ESRI User
ConferenceTechnicalWorkshop,http://www.scdhec.gov/gis/pres entatios/ESRI_Conference_08/tws/workshops/tw_37.pdf, visited 25 April 2011.
[8] National Oceanic Atmospheric Administration (NOAA ), Coastal Service Center, 2004 , Non-Point Source Pollution And Erosion Comparison Tool, User‟s Manual, 22345., Hobson Ave,
Charleston, SC
29424.
[9] National Oceanic Atmospheric Administration (NOAA ), Coastal Service Center, 2004 , Non-Point Source Pollution And Erosion Comparison Tool, Technical Guide, Version 1 Hobson
Ave, Charleston,
SC 29424.
[10] Singh, V. P. (1988), Hydrologic Systems: Rainfall-runoff modeling, Vol. 1, Prentice Hall, Englewood Cliffs, New Jersey, p45.
[11] Schueler, Thomas R. “Why Stormwater Matters.” The Practice of Watershed Protection. Eds. Thomas R.Schueler and Heather K. Holland. Ellicott City, MD: Center for Watershed Protection, 2000. pp 365–370.
[12] USDA-NRCS. 1986. Urban Hydrology for Small Watersheds. Technical Release 55 (TR-55). Second Edition. Washington,
D.C. Available at
ftp://ftp.wcc.nrcs.usda.gov/downloads/hydrology_hydraulics/tr5 5/tr55.pdf
[13] Web site for SRTM DEM: http://srtm.csi.cgiar.org/, Last Accessed 22 December, 2015.
[14] Web site for Resourcesat1 LISS III Image : http://bhuvan.nrsc.gov.in/data/download/index.php Last Accessed 22 December, 2015.
[15] Web-site for NRSC-BHUVAN for Land cover classes: http://bhuvan.nrsc.gov.in/gis/thematic/index.php Last Accessed 23 December, 2015.