Volume 15 Number 3 pp. 315–323 CThe Authors 2012 doi:10.1017/thg.2012.10
Genetic Contributions to the Midsagittal Area
of the Corpus Callosum
Kimberley A. Phillips,1,2,3Jeffrey Rogers,4Elizabeth A. Barrett,1David C. Glahn,5and Peter Kochunov2,6,7
1Department of Psychology, Trinity University, San Antonio, Texas, USA
2Research Imaging Institute, University of Texas Health Science Center, San Antonio, Texas, USA 3Texas Biomedical Research Institute, San Antonio, Texas, USA
4Baylor College of Medicine and Southwest National Primate Research Center, Human Genome Sequencing Center,
Houston, Texas, USA
5Yale University, New Haven, Connecticut, USA
6Maryland Psychiatric Research Center, Department of Psychiatry, University of Maryland School of Medicine, Baltimore,
Maryland, USA
7Department of Physics, University of Maryland, Baltimore, Maryland, USA
The degree to which genes and environment determine variations in brain structure and function is fun-damentally important to understanding normal and disease-related patterns of neural organization and activity. We studied genetic contributions to the midsagittal area of the corpus callosum (CC) in pedigreed baboons (68 males, 112 females) to replicate findings of high genetic contribution to that area of the CC reported in humans, and to determine if the heritability of the CC midsagittal area in adults was modulated by fetal development rate. Measurements of callosal area were obtained from high-resolution MRI scans. Heritability was estimated from pedigree-based maximum likelihood estimation of genetic and non-genetic variance components as implemented in Sequential Oligogenic Linkage Analysis Routines (SOLAR). Our analyses revealed significant heritability for the total area of the CC and all of its subdivisions, withh2=.46 for the total CC, andh2=.54, .37, .62, .56, and .29 for genu, anterior midbody, medial midbody, posterior midbody and splenium, respectively. Genetic correlation analysis demonstrated that the individual subdivi-sions shared between 41% and 98% of genetic variability. Combined with previous research reporting high heritability of other brain structures in baboons, these results reveal a consistent pattern of high heritability for brain morphometric measures in baboons.
Keywords:corpus callosum, heritability, baboons, genetics, imaging
Genetic differences account for a significant proportion of neuroanatomic variability in humans (Hulshoff Pol et al., 2006; Pennington et al., 2000; Pfefferbaum et al., 2000). While several studies have considered heritable influences on total brain volume (Cheverud et al., 1990; Posthuma et al., 2002; Rogers et al., 2007; Rogers et al., 2010; Thomp-son et al., 2001; Toga & ThompThomp-son, 2005), little is known about genetic influences on regional structures such as the corpus callosum (CC). The CC is the largest commissural white-matter (WM) tract in the brain, and is essential for inter-hemispheric integration of sensory, motor, and higher-order cognitive information. Numerous genetic dis-orders affect the morphology of the CC, producing specific regional abnormalities (Di Rocco et al., 2004; Kochunov et al., 2005). Disruptions in the structural integrity of the CC during aging, or as a result of specific disorders, are as-sociated with impairments in problem-solving and work-ing memory (Zahr et al., 2009), bimanual movement, or
inter-hemispheric transfer (Bonzano et al., 2008). Neu-ropsychiatric conditions, including schizophrenia (Wang et al., 2011) and major depression (Korgaonkar et al., 2011), are associated with changes in the CC. Given the importance of the CC to various cognitive functions, understanding the genetic mechanisms that influence variation in the size and shape of this structure will likely have important clinical implications.
Using MRI, human twin studies have suggested a high heritability of the midsagittal CC area (Scamvougeras et al., 2003). Analyses in a small number of mono- (N=10) and dizygotic (N=7) twin pairs estimated heritability at 94.4%
RECEIVED27 May 2011;ACCEPTED4 November 2011.
for the size of the CC. Pfefferbaum et al. (2000) reported similarly high heritability (85%) for the CC size in another small (N= 85) twin sample. More recent investigations into the regional heritability of the CC partitions using dif-fusion tensor imaging (DTI) have reported that the degree of contributions by genetic factors was variable among mid-sagittal CC sections, and the sources of this variability re-mained unknown (Brouwer et al., 2010; Chiang et al., 2011; Kochunov et al., 2010c). Some developmental biologists have suggested that the rate of development may modulate the degree of genetic contribution, and earlier developing structures will be more tightly controlled by genetic fac-tors during development, thus leading to higher heritabil-ity. However, this assertion is not consistent with results that demonstrate that the earliest developing structures are clearly evolvable through the course of the evolutionary history, and may be susceptible to environmental perturba-tions (Raff, 1996). This was further demonstrated by recent studies that showed that the heritability of WM increases with age (Peper et al., 2007), and the brain regions asso-ciated with more complex reasoning become increasingly more heritable with development (Lenroot & Giedd, 2008). Comparative studies of animal models can provide unique insights into the biological processes that under-lie human neurobiology and neurodevelopment. Previous studies of baboons have documented significant genetic ef-fects on brain structure (Kochunov et al., 2010b; Rogers et al., 2007), and shown that there are unanticipated paral-lels in the architecture of genetic effects on cortical folding and brain volume in humans and baboons (Rogers et al., 2010). In this latter paper, we showed that an inverse rela-tionship between genetic effects on brain size and cortical folding is conserved in humans and baboons. Thus, the baboon results provide both a confirmation of an unex-pected finding in human neurogenetics and demonstrate that there are long-term evolutionary genetic relationships that are shared across primate clades. Significant results con-cerning brain structure and the genetics of brain evolution have also come from studies of macaques, vervet monkeys, and chimpanzees (e.g., Fears et al., 2009; Lyn et al., 2011; Semendeferi et al., 2002; Sherwood et al., 2010). In addi-tion to comparative analyses of nonhuman primate and human brain structure, researchers have also successfully used nonhuman primates to study genetic influences on brain function and metabolism (Oler et al., 2010). Between-species differences in gene expression within the brain have also informed our understanding of human brain function (Konopka et al., 2009).
We aimed to evaluate genetic influences on inter-subject variability in midsagittal CC size, and the degree to which the genetic heritability of regional CC variability was modu-lated by rate of development during fetal and early postnatal growth. The evaluation was performed in a nonhuman pri-mate: baboons,Papio hamadryas.Papiobaboons were cho-sen because they share several neurological characteristics
with humans, including high heritability of brain volume, cortical surface area, and cortical gyrification (Kochunov et al., 2010b). Additionally, age-related changes in the de-velopment of the CC are consistent with the dede-velopmental course observed in humans (Phillips & Kochunov, 2011). Therefore, the baboon holds great potential as a model for human brain development.
Methods
SubjectsOne hundred-eighty adult baboons (Papio hamadryas) (68 males, 112 females) were selected from the large multi-generation pedigreed colony of more than 2000 baboons maintained by the Southwest National Primate Research Center (SNPRC) at the Texas Biomedical Research Institute in San Antonio, Texas. The average age of the study animals was 16 years (SD =4.2, age range: 7–28 years). This age range was chosen to minimize the effects of development or senescence based on studies of cerebral ontogeny (Leigh, 2004; Leigh et al., 2003). The genealogical relationships among study animals included 414 parent–offspring pairs, 51 full sib pairs, 645 half-sib pairs, and a large number of more distant kinship relationships. Captive male baboons are sexually mature at 5 years and fully adult at 6 years. Fe-male baboons start to cycle at between 3–4 years and are fully grown around 5 years.
We measured the CC in utero and during the early post-natal period to estimate developmental rate. In-utero imag-ing of 13 normally developimag-ing fetuses was performed cov-ering the period of gestational week 17 through birth (ges-tational week 28); postnatal imaging was performed on 16 baboons between postnatal weeks 1 and 32. The details for the in-utero and early postnatal imaging and animal han-dling protocols are described elsewhere (Kochunov et al., 2010a; Kochunov & Duff Davis, 2009; Phillips & Kochunov, 2011).
Animal Handling and MR Imaging
FIGURE 1
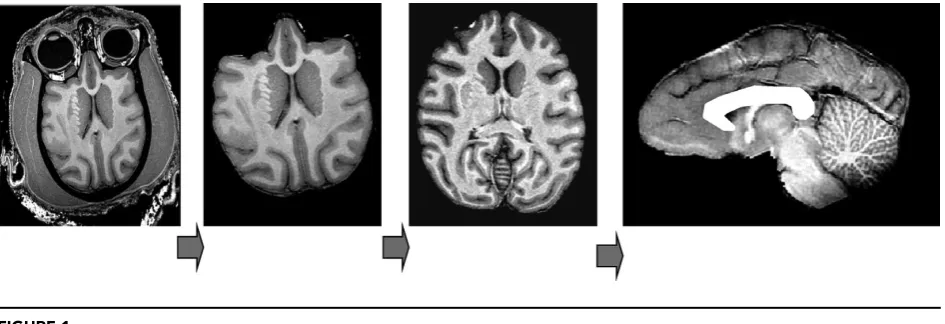
Structural image processing pipeline, which allows for a simple automation of sequential processing steps. Our pipeline consists of the following steps: removal of non-brain tissue, correction for RF-inhomogeneity artifacts, global spatial normalization (A), hemispheric segmentation (B), tissue classification (C), extraction of the inner/outer cortical surfaces (D, E), extraction of cortical sulci (F), automated labeling of cortical sulci (G), and gyral segmentation (H).
The imaging protocols used to acquire images from all subjects are detailed elsewhere (Kochunov & Duff Davis, 2009; Rogers et al., 2007). In short, high-resolution (isotropic 500μm), T1-weighted images were acquired us-ing a 3D IR-TurboFlash sequence optimized for anatomical imaging of baboon brain. An adiabatic inversion recov-ery (IR) contrast pulse with linear phase encoding schema was employed, primarily because it led to a uniform tissue contrast across the imaging volume (being less affected by B1-inhomogeneity/radio-frequency [RF] penetration arti-facts). The sequence control parameters for the adult and postnatal subjects (FOV=128 mm, TI=795 ms, TE=3.04, TR1=5 ms, TR2=2000 ms, and flip angle=10◦) were modeled to produce gray matter–white matter (GM–WM) contrast of 25% based on the analytical solutions to Bloch equations (Deichmann et al., 2000), and average measured values of T1, T2, and PD. The model-determined imag-ing sequence parameters were verified in a group of five animals, where group-average GM–WM contrast was cal-culated to be 25.2±2% (range 22–26%). Image acquisition was performed using a retrospective motion-corrected pro-tocol (Kochunov et al., 2006). Under this propro-tocol, six full-resolution segments, each 9 minutes long, were acquired for a total sequence running time of∼54 minutes. The sequence control parameters, TR/TE/flip angle/FOV/Spatial Resolu-tion/Scan Time=5 ms/2.5 ms/75 degrees/180 mm/500 mi-crons isotropic/30 min, allow for rapid collection of 3D data phase partition of 360 lines within a single respiration cy-cle, as detailed in Phillips & Kochunov, 2011. This protocol allowed for a high-SNR, 3D, and isotropic coverage of the fetal brain, with good regional GM–WM tissue contrast.
Image Processing and Measurement of CC
The image processing pipeline consisted of the follow-ing steps: removal of non-brain tissue, correction for spa-tial variations in intensity due to scanner radio-frequency
inhomogeneity, and global spatial normalization to a population-based template to reduce global variability in brain size and orientation (Figure 1). The details of this processing are described elsewhere (Rogers et al., 2007). In short, the removal of non-brain tissue used both auto-matic (Smith, 2002) and manual detailing methods. The correction for RF-inhomogeneity was performed using the functional magnetic resonance imaging of the brain (FM-RIB) automated segmentation tool (Smith et al., 2004). A nine-parameter global spatial normalization procedure was used to reduce inter-subject variability in global brain size, shape, and orientation, and was performed using the FMRIB linear image registration tool (Smith et al., 2004). A population-based, pseudo-Talairach, median-geometry atlas served as the target brain for global spatial normal-ization. This atlas was created using methods previously described for humans (Kochunov et al., 2002) and primates (Kochunov & Duff Davis, 2009).
FIGURE 2
Anatomical subdivision of the baboon corpus callosum from MRI sagittal view. The total midsagittal area was divided into five equally spaced subdivisions. 1=genu; 2=anterior midbody; 3=medial midbody; 4=caudal midbody; 5=splenium.
integrates visuospatial regions of the cortex. Analyze 10.0 (Mayo Foundation for Medical Education and Research) was used to divide and measure the midsagittal area of the CC in mm2. To subdivide the CC, the entire length of the
CC was first manually traced, then divided into five equally spaced sections (see Figure 2). Two individuals (KAP and EAB) performed measurements of the CC; there was a high degree of concordance in measures,r=.88. Details on the measurements of total CC area and CC subdivision area were provided in Phillips and Kochunov (2011). Regional development rates were estimated by fitting a linear regres-sion to the dataset consisting of both in-utero and postnatal data points. In this way we estimated mm2/week of
devel-opment in callosal subdivisions.
Quantitative Genetic Analysis
Variance components methods, as implemented in the SO-LAR software package (http://solar.sfbrgenetics.org) (Al-masy & Blangero, 1998), were used to estimate the
heritabil-ity of measured traits. The algorithms in SOLAR employ maximum likelihood variance decomposition methods and are an extension of the strategy developed by Amos (1994). The covariance matrix for a pedigree of individuals is given by Equation 1:
=2Fs2g+ Is2e (1)
where s2
g is the genetic variance due to the additive genetic
factors, F is the kinship matrix representing the pair-wise kinship coefficients among all animals, s2
e is the variance
TABLE 1
Mean Area, Rates of Development, Heritability, and Proportion of the Total Variance Explained by Covariates for the Corpus Callosum and Regional Subdivisions in Adult Baboons
CC region Mean area (mm2) SD
Rates of developmenta
(mm2/week) h2 SD p
Significant covariates
Percentage variance explained by covariance
Total CC 143.07 22.11 .46 .16 .00005 None .5 Genu 34.43 5.57 .37 .54 .18 8.6·10−6 None .2 Anterior midbody 22.74 4.38 .33 .37 .17 .0006 None .3 Medial midbody 24.31 4.71 .31 .62 .17 2.1·10−6 None .2 Caudal midbody 26.68 5.84 .34 .56 .19 .0001 None 1.3 Splenium 34.94 5.98 .51 .29 .14 .0007 None .1
Note: CC=corpus callosum,SD=standard deviation. aData from Phillips and Kochunov (2011).
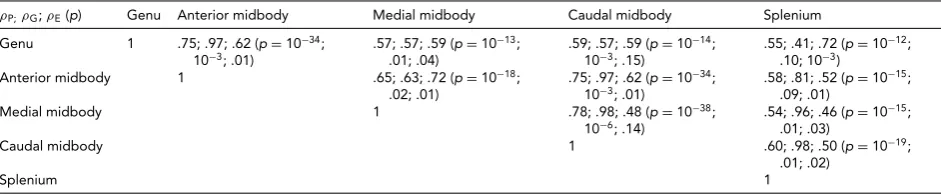
TABLE 2
Genetic Correlations Between the Subdivisions of the Corpus Callosum
ρP;ρG;ρE(p) Genu Anterior midbody Medial midbody Caudal midbody Splenium
Genu 1 .75; .97; .62 (p=10−34; 10−3; .01)
.57; .57; .59 (p=10−13; .01; .04)
.59; .57; .59 (p=10−14; 10−3; .15)
.55; .41; .72 (p=10−12; .10; 10−3)
Anterior midbody 1 .65; .63; .72 (p=10−18; .02; .01)
.75; .97; .62 (p=10−34; 10−3; .01)
.58; .81; .52 (p=10−15; .09; .01)
Medial midbody 1 .78; .98; .48 (p=10−38; 10−6; .14)
.54; .96; .46 (p=10−15; .01; .03)
Caudal midbody 1 .60; .98; .50 (p=10−19;
.01; .02)
Splenium 1
Note: The overall phenotypic correlation (ρP) between two traits is expressed using the correlation due to shared additive genetic effects (ρG) and the residual correlation (ρE) due to shared environmental effects.
context, see Almasy & Blangero (1998) and Blangero et al. (2001).
Heritability (h2), the portion of phenotypic variance
(sp2) that is accounted for by additive genetic variance
(Eq. 1), is assessed by contrasting the observed phenotypic covariance matrix with the covariance matrix predicted by kinship. Significance of heritability is tested by comparing the likelihood of the model in which s2g is constrained to zero with that of a model in which s2
g is estimated. Twice the
difference between the two log likelihoods of these models yields a test statistic which is asymptotically distributed as a1/
2:1/2mixture of aχ12variable and a point mass at zero.
During testing for the significance of heritability, the phe-notype values for each individual are adjusted for a series of covariates. In our analysis we used a polygenic model that estimated the influence of specific variables (additive genetic variation and covariates including sex, age, age2, age x sex interaction, age2 x sex interaction, and random unidentified environmental effects), calculating heritability and its significance (pvalue) for each trait’s variance within this population. The level of significance for the heritability analysis for callosal subdivisions was set atp≤.01 (Bonfer-roni correction) to reduce the probability of Type 1 errors associated with multiple (N=5) measurements.
Genetic Correlation Analyses
Bivariate genetic correlation analyses were performed to study the proportion of shared genetic variance between the subdivisions of the CC using methods implemented
in the SOLAR software package. Bivariate genetic analysis calculates the magnitude and significance of genetic corre-lation coefficient (ρG), which is the proportion of variability
due to shared genetic effects. The overall phenotypic cor-relation (ρP) between two traits A and B (Equation 2) can
be expressed using the correlation due to shared additive genetic effects (ρG), and the residual correlation (ρE) due
to shared environmental effects.
ρP =
h2
A
h2
B ·ρG+
1−h2 A
1−h2
B ·ρE (2)
where h2
Aand h2Bdenote the additive genetic heritabilities
for each of the traits, that is, the proportion of the total phenotypic variance that is explained by additive genetic factors. If the genetic correlation coefficient (ρG) is
signif-icantly different from zero, then the traits are considered to be partially influenced by shared genetic factors (Almasy et al., 1997).
Results
The mean area for callosal subdivisions in adult baboons is shown in Table 1. Quantitative genetic analyses revealed that the total area of the CC and all subdivisions is heri-table, withh2 at .46 (SD=.16) for the total CC, ranging
phenotypes, which was likely a result of using global spatial normalization to correct for differences in head size.
To test if the rate of cerebral development was predic-tive of the level of heritability in adulthood, we plotted the degree of genetic contribution to regional variability (i.e., heritability in size) in the CC subdivisions versus the re-gional development rates during the fetal and early postna-tal period. These rates were determined from brain images of 29 normally developing fetuses, covering the period of gestational week 17 through birth (gestational week 28). Imaging was also performed on 16 baboons up to postnatal week 32. The regional estimates of heritability were nega-tively correlated with the rates of change in midsagittal CC area during this developmental period (r=.74,p= .08) (Table 1).
Discussion
Our study demonstrated significant heritability for the size of the CC and its subdivisions in adult baboons. To our knowledge, this is the first investigation of heritability of the CC subdivisions performed in a pedigree of nonhuman pri-mates. Heritability of individual callosal subdivisions varied from .29 (SD=.14) for the splenium to .62 (SD=.17) for the medial midbody, suggesting callosal subdivisions may differ in the degree of genetic contribution to the individual variation, but the large standard errors we obtained sug-gest that in this dataset the heritabilities are not statistically different. Overall, the estimates of heritability in baboons were about half of those reported in humans (Pfefferbaum et al., 2000; Scamvougeras et al., 2003). This discrepancy can potentially be explained by the methodological differ-ences, since the human studies did not correct for inter-subject differences in brain volume. The total brain volume is highly heritable in both humans and baboons (Rogers et al., 2007; Rogers et al., 2010), and this study aimed to measure genetic contribution of the morphology of CC in-dependent of brain size. The global differences in brain size and shape can be corrected by spatial normalization, which transforms brains into a standard reference frame using a nine-parameter (three translations, rotations, and scaling) spatial transformation where they are adjusted to the same external dimensions (Rogers et al., 2007). This normaliza-tion step was also shown to remove the effects of body weight and sex (Kochunov et al., 2009; Rogers et al., 2007). After spatial normalization, variability in brain structure chiefly reflects individual variability in the structure’s shape, such as curvature, length, and width. Additionally, the investi-gations of CC heritability in humans were performed on a small number of twin pairs and used a simplified estimate of heritability that did not model the shared environmental ef-fects, which are known for overestimation of the heritability values (Keller et al., 2010).
As brain regions associated with more complex reason-ing were reported to become increasreason-ingly heritable with
maturation (Lenroot & Giedd, 2008), we expected higher heritability in subdivisions of the CC connecting higher-association areas. The subdivisions of the CC are associated with functional connectivity to cortical regions (Alexander et al., 2007; Hofer & Frahm, 2006). The anterior regions of the genu and anterior midbody connect primarily higher-order cognitive regions; the medial and caudal midbody connect primarily sensorimotor regions; the posterior re-gion of the splenium integrates visuospatial rere-gions of the cortex. Thus, as the genu and splenium are involved in higher-association cognitive tasks, we expected these sub-divisions to have the greatest heritability in adult baboons. When considering heritability of the CC in adults, the genu and splenium did not display the highest heritability rates. The value for the genu, which connects prefrontal regions, is higher than the average across regions, and higher than the value for the total CC, but the value of heritability for the splenium is lower than all other values. As the splenium is involved in visuospatial integration, perhaps experiences in coordination of visual and motor activities are important factors in influencing the variability in size of the sple-nium. When looking at heritability rates across fetal and early postnatal development, a similar pattern is seen. The splenium showed the largest degree of variation due to en-vironmental effects. The results of the genetic correlation analyses revealed that the degree of shared genetic contri-bution among CC subdivisions is complex, and suggested that subdivisions may differ in the degree of genetic contri-bution. Heritability among subdivisions did not vary along the anterior–posterior direction, but spatially adjacent sub-divisions shared more genetic variability than more distal regions.
heritability values for primary cortical structures appearing earlier in development was also reported in humans (Brun et al., 2008; Chiang et al., 2008; Le Goualher et al., 2000; Lohmann et al., 2008; Lohmann et al., 1999). Our result is supportive of this hypothesis; however, the negative rela-tionship between heritability and the rate of development is driven primarily by the splenium, which had the high-est rate of development and the lowhigh-est heritability high-estimate among the CC regions. The value of the correlation coeffi-cient is greatly diminished if splenium is removed from the analysis (r= −.11 vs.−.74, respectively).
Understanding how genes and environmental variation determine brain structure and function is fundamentally important to understanding normal and disease-related patterns of neural structure and function. Significant ge-netic effects have been reported for other brain structures in baboons, including total brain volume and shape, and regions of motor cortex and the superior temporal gyrus (Rogers et al., 2007). Thus, a consistent pattern of high heritability for brain morphometric measures is seen in baboons. The results of the present study further indicate thatPapiobaboons are a valuable model for translational neurologic genetic research.
Acknowledgments
This work was supported, in part, by the National Institute of Neurological Disorders and Stroke (R15 #NS070717) to KAP, and the National Institute of Biomedical Imaging and Bioengineering (K01 #EB006395) to PK. This investigation used resources that were supported by the Southwest Na-tional Primate Research Center grant P51 RR013986 from the National Center for Research Resources, National In-stitutes of Health and that are currently supported by the Office of Research Infrastructure Programs through P51 OD013986.
References
Aboitiz, F., Scheibel, A. B., Fisher, R. S., & Zaidel, E. (1992). Fiber composition of the human corpus callosum.Brain Research, 598, 143–153.
Alexander, A. L., Lee, J. E., Lazar, M., Boudos, R., Dubray, M. B., Oakes, T. R., Miller, J. N., Lu, J., Jeong, E. K., McMahon, W. M., Bigler, E. D., & Lainhart, J. E. (2007). Diffusion ten-sor imaging of the corpus callosum in autism.NeuroImage, 34, 61–73.
Almasy, L., & Blangero, J. (1998). Multipoint quantitative-trait linkage analysis in general pedigrees.American Journal of Human Genetics, 62, 1198–1211.
Almasy, L., Dyer, T. D., & Blangero, J. (1997). Bivari-ate quantitative-trait linkage analysis: Pleiotropy ver-sus co-incident linkages. Genetic Epidemiology, 14, 953– 958.
Amos, C. I. (1994). Robust variance-components approach for assessing genetic linkage in pedigrees.American Journal of Human Genetics, 54, 535–543.
Biegon, A., Eberling, J. L., Richardson, B. C., Roos, M. S., Wong, S. T. S., Reed, B. R., & Jagust, W. J. (1994). Human corpus callosum in aging and Alzheimer’s disease: A mag-netic resonance imaging study.Neurobiology of Aging, 15, 393–397.
Blangero, J., Williams, J. T., & Almasy, L. (2001). Variance com-ponent methods for detecting complex trait loci.Advances in Genetics, 42, 151–181.
Bonzano, L., Tacchino, A., Roccatagliata, L., Abbruzzese, G., Mancardi, G. L., & Bove, M. (2008). Callosal contributions to simultaneous bimanual finger movements.The Journal of Neuroscience, 28, 3227–3233.
Brouwer, R. M., Mandl, R. C. W., Peper, J. S., van Baal, G. C. M., Kahn, R. S., Boomsma, D. I., & Hulshoff Pol, H. E. (2010). Heritability of DTI and MTR in nine-year-old children.NeuroImage, 53, 1085–1092.
Brun, C., Lepore, N., Pennec, X., Chou, Y. Y., Lee, A. D., Bary-sheva, M., de Zubicaray, G., Meredith, M., McMahon, K., Wright, M. J., Toga, A. W., & Thompson, P. M. (2008). A tensor-based morphometry study of genetic influences on brain structure using a new fluid registration method. Medical Image Computing and Computer Assisted Interven-tion InternaInterven-tional Conference on Medical Image Computing and Computer Assisted Intervention, 11, 914–921.
Cheverud, J. M., Falk, D., Vannier, M., Konigsberg, L., Helmkamp, R. C., & Hildebolt, C. (1990). Heritability of brain size and surface features in rhesus macaques (Macaca mulatta).Journal of Heredity, 81, 51–57.
Chiang, M. C., Barysheva, M., Lee, A. D., Madsen, S., Klunder, A. D., Toga, A. W., McMahon, K. L., de Zubicaray, G. I., Meredith, M., Wright, M. J., Srivastava, A., Balov, N., & Thompson, P. M. (2008). Brain fiber architecture, genet-ics, and intelligence: A high angular resolution diffusion imaging (HARDI) study.Medical Image Computing and Computer Assisted Intervention International Conference on Medical Image Computing and Computer Assisted Interven-tion, 11, 1060–1067.
Chiang, M. C., McMahon, K. L., de Zubicaray, G. I., Martin, N. G., Hickie, I., Toga, A. W., Wright, M. J., & Thompson, P. M. (2011). Genetics of white matter development: A DTI study of 705 twins and their siblings aged 12 to 29.Neuroimage, 54,2308–2317.
Deichmann, R., Good, C., Josephs, O., Ashburner, J., & Turner, R. (2000). Optimization of 3-D MP-RAGE sequences for structural brain imaging.Neuroimage, 12, 112–127. Di Rocco, M., Biancheri, R., Rossi, A., Filocamo, M., &
Torotori-Donati, P. (2004). Genetic disorders affecting white matter in the pediatric age.American Journal of Med-ical Genetics Part B: Neuropsychiatric Genetics, 129B, 85–93. Fears, S., Melega, W. P., Service, S. K., Lee, C., Chen, K., Tu, Z., Jorgensen, M. J., Fairbanks, L. A., Cantor, R. M., Freimer, N. B., & Woods, R. P. (2009). Identifying heritable brain phenotypes in an extended pedigree of vervet monkeys. Journal of Neuroscience, 29, 2867–2875.
Hulshoff Pol, H. E., Schnack, H. G., Posthuma, D., Mandl, R. C., Baare, W. F., van Oel, C., van Haren, N. E., Collins, D. L., Evans, A. C., Amunts, K., B¨urgel, U., Zilles, K., de Geus, E., Boomsma, D. I., & Kahn, R. S. (2006). Genetic contributions to human brain morphology and intelligence.Journal of Neuroscience, 26, 10235–10242.
Keller, M. C., Medland, S. E., & Duncan, L. E. (2010). Are extended twin family designs worth the trouble? A com-parison of the bias, precision, and accuracy of parameters estimated in four twin family models.Behavior Genetics, 40, 377–393.
Kochunov, P., Castro, C., Davis, D., Dudley, D., Brewer, J., Zhang, Y., Kroenke, C. D., Purdy, D., Fox, P. T., Simerly, C., & Schatten, G. (2010a). Mapping primary gyrogenesis during fetal development in primate brains: High-resolution in utero structural MRI of fetal brain development in pregnant baboons.Frontal Neuroscience, 4, 20.
Kochunov, P., & Duff Davis, M. (2009). Development of struc-tural MR brain imaging protocols to study genetics and maturation.Methods, 50, 136–146.
Kochunov, P., Glahn, D., Fox, P. T., Lancaster, J. L., Saleem, K., Shelledy, W., Zilles, K., Thompson, P. M., Coulon, O., Mangin, J. F., Blangero, J., & Rogers, J. (2010b). Genetics of primary cerebral gyrification: Heritability of length, depth and area of primary sulci in an ex-tended pedigree ofPapiobaboons.Neuroimage, 53, 1126– 1134.
Kochunov, P., Glahn, D., Lancaster, J., Wincker, P., Smith, S., Thompson, P., Almasy, L., Duggirala, R., Fox, P. T., Blangero, J. (2010c). Genetics of microstructure of cerebral white matter using diffusion tensor imaging.Neuroimage, 15, 1109–1116.
Kochunov, P., Lancaster, J., Glahn, D. C., Purdy, D., Laird, A. R., Gao, F., & Fox, P. (2006). A retrospective motion correction protocol for high-resolution anatomical MRI. Human Brain Mapping, 27, 957–962.
Kochunov, P., Lancaster, J., Hardies, J., Thompson, P. M., Woods, R. P., Cody, J. D., Hale, D. E., Laird, A., & Fox, P. T. (2005). Mapping structural differences of the corpus callosum in individuals with 18q deletions using targetless regional spatial normalization.Human Brain Mapping, 24, 325–331.
Kochunov, P., Lancaster, J., Thompson, P., Toga, A. W., Brewer, P., Hardies, J., & Fox, P. (2002). An optimized individual target brain in the Talairach coordinate system.Neuroimage, 17, 922–927.
Konopka, G., Bomar, J. M., Winden, K., Coppola, G., Jonsson, Z. O., Gao, F., Peng, S., Preuss, T. M., Wohlschlegel, J. A., & Geschwind, D. H. (2009). Human-specific transcriptional regulation of CNS development genes by FOXP2.Nature, 462, 213–217.
Korgaonkar, A. K., Grieve, S. M., Koslow, S. H., Gabrieli, J. D., Gordon, E., & Williams, L. W. (2011). Loss of white matter integrity in major depressive disorder: Evidence using tract-based spatial statistical analysis of diffusion tensor imaging. Human Brain Mapping, 32, 2161–2171.
Le Goualher, G., Argenti, A. M., Duyme, M., Baare, W. F., Hulshoff Pol, H. E., Boomsma, D. I., Zouaoui, A.,
Bar-illot, C., & Evans, A. C. (2000). Statistical sulcal shape comparisons: Application to the detection of genetic en-coding of the central sulcus shape.Neuroimage, 11, 564– 574.
Leigh, S. R. (2004). Brain growth, life history, and cognition in primate and human evolution.American Journal of Pri-matology, 62, 139–164.
Leigh, S. R., Shah, N. F., & Buchanan, L. S. (2003). Ontogeny and phylogeny in papionin primates. Journal of Human Evolution, 45, 285–316.
Lenroot, R. K., & Giedd, J. N. (2008). The changing impact of genes and environment on brain development during child-hood and adolescence: Initial findings from a neuroimaging study of pediatric twins.Developmenal Psychopathology, 20, 1161–1175.
Lohmann, G., von Cramon, D. Y., & Colchester, A. C. (2008). Deep sulcal landmarks provide an organizing framework for human cortical folding.Cerebral Cortex, 18, 1415–1420. Lohmann, G., von Cramon, D. Y., & Steinmetz, H. (1999).
Sulcal variability of twins.Cerebral Cortex, 9, 754–763. Lyn, H., Pierre, P., Bennett, A. J., Fears, S., Woods, R., &
Hop-kins, W. D. (2011). Planum temporale gray matter asym-metries in chimpanzees (Pan troglodytes), vervet (Chloroce-bus aethiops sabaeus), rhesus (Macaca mulatta), and bon-net (Macaca radiata) monkeys.Neuropsychologia, 49, 2004– 2012.
Oler, J. A., Fox, A. S., Shelton, S. E., Rogers, J., Dyer, T. D., Davidson, R. J., Shelledy, W., Oakes, T. R., Blangero, J., & Kalin, N. H. (2010). Amygdalar and hippocampal substrates of anxious temperament differ in their heritability.Nature, 466, 864–868.
Pennington, B. F., Filipek, P. A., Lefly, D., Chhabildas, N., Kennedy, D. N., Simon, J. H., Filley, C. M., Galaburda, A., & DeFries, J. C. (2000). A twin MRI study of size variations in the human brain.Journal of Cognitive Neuroscience, 12, 223–232.
Peper, J. S., Brouwer, R. M., Boomsma, D. I., Kahn, R. S., & Hulshoff Pol, H. E. (2007). Genetic influences on human brain structure: A review of brain imaging studies in twins. Human Brain Mapping, 28, 464–473.
Pfefferbaum, A., Sullivan, E. V., Swan, G. E., & Carmella, D. (2000). Brain structure in men remains highly heritable in the seventh and eighth decades of life.Neurobiology of Aging, 21, 63–74.
Phillips, K., & Kochunov, P. (2011). Tracking development of the corpus callosum in fetal and early postnatal baboons using magnetic resonance imaging.The Open Neuroimaging Journal, 5, 179–185.
Phillips, K. A., Sherwood, C. C., & Lilak, A. L. (2007). Corpus callosum morphology in capuchin monkeys is influenced by sex and handedness.PLoS ONE, 2, 1–7.
Pierre, P. J., Hopkins, W. D., Taglialatela, J. P., Lees, C. J., & Ben-nett, A. J. (2008). Age-related neuroanatomical differences from the juvenile period to adulthood in mother-reared macaques (Macaca radiata).Brain Research, 126, 56–60. Posthuma, D., de Geus, E. J., Baare, W. F., Hulshoff Pol, H.
between brain volume and intelligence is of genetic origin. Nature Neuroscience, 5, 83–84.
Raff, M. (1996). Neural development: Mysterious no more? Science, 274, 1063.
Rogers, J., Kochunov, P., Lancaster, J., Shelledy, W., Glahn, D., Blangero, J., & Fox, P. (2007). Heritability of brain vol-ume, surface area, and shape: An MRI study in an extended pedigree of baboons.Human Brain Mapping, 28, 576–583. Rogers, J., Kochunov, P., Zilles, K., Shelledy, W., Lancaster, J., Thompson, P., Duggirala, R., Blangero, J., Fox, P. T., & Glahn, D. C. (2010). On the genetic architecture of corti-cal folding and brain volume in primates.Neuroimage, 53, 1103–1108.
Sanchez, M. M., Hearn, E. F., Do, D., Rilling, J. K., & Herndon, J. G. (1998). Differential rearing affects corpus callosum size and cognitive function of rhesus monkeys.Brain Research, 812, 38–49.
Scamvougeras, A., Kigar, D. L., Jones, D., Weinberger, D. R., & Witelson, S. F. (2003). Size of the human corpus callo-sum is genetically determined: An MRI study in mono and dizygotic twins.Neuroscience Letters, 338, 91–94.
Semendeferi, K., Lu, A., Schenker, N., & Damasio, H. (2002). Humans and great apes share a large frontal cortex.Nature Neuroscience, 5, 272–276.
Sherwood, C. C., Raghanti, M. A., Stimpson, C. D., Spocter, M. A., Uddin, M., Boddy, A. M., Wildman, D. E., Bonar, C. J., Lewandowski, A. H., Phillips, K. A., Erwin, J. M., & Hof, P. R. (2010). Inhibitory interneurons of the human prefrontal cortex display conserved evolution of the phenotype and
related genes.Proceedings of the Royal Society B, 277, 1011– 1020.
Smith, S., Jenkinson, M., Woolrich, M., Beckmann, C., Behrens, T., Johansen-Berg, H., Bannister, P. R., De Luca, M., Drobnjak, I., Flitney, D. E., Niazy, R. K., Saunders, J., Vickers, J., Zhang, Y., De Stefano, N., Brady, J. M., & Matthews, P. M. (2004). Advances in functional and struc-tural MR image analysis and implementation as FSL. Neu-roimage, 23, 208–219.
Smith, S M. (2002). Fast robust automated brain extraction. Human Brain Mapping, 17, 143–155.
Thompson, P., Cannon, T. D., Narr, K. L., van Erp, T., Poutanen, V.-P., Huttunen, M., L¨onnqvist, J., Standert-skj¨old-Nordenstam, C. G., Kaprio, J., Khaledy, M., Dail, R., Zoumalan, C. I., & Toga, A. W. (2001). Genetic in-fluences on brain structure.Nature Neuroscience, 4, 1253– 1258.
Toga, A. W., & Thompson, P. (2005). Genetics of brain struc-ture and intelligence.Annual Review of Neuroscience, 28, 1–23.
Wang, Q., Deng, W., Huang, C., Li, M., Ma, X., Wang, Y. et al.(2011). Abnormalities in connectivity of white-matter tracts in patients with familial and non-familial schizophre-nia.Psychological Medicine, 41, 1691–1700.