RESEARCH ARTICLE
DIAGNOSTIC STUDY OF THE CLIMATIC PARAMETERS TO INFLUENCE THE DRYNESS OF WATER
OF LAKE CHAD ON THE CHADIAN AREA
*1
Njipouakouyou Samuel and
2Ibrahim Abdoul
1
Faculty of Sciences, University of Dschang
2
Engineer of Meteorology, looking for Employment
ARTICLE INFO
ABSTRACT
This study is on the climatic parameters which could stimulate the rate of dryness of water from Lake Chad. It indicates that with regard to the considered parameters: duration of sunlight, temperature and relative humidity of the air, and precipitations, none has stimulated
such a daily rate of dryness of 1.25 km2 of the liquid surface of Lake Chad as reported for the
last fifty years. Even though that process of dryness exists, it has not such an intensity and the causes should be searched elsewhere, priory in the uncontrolled use of water by human beings for their daily activities, due also to the rapid growth of the populations. The governments should manage new spaces and appropriate structures to prevent the ongoing degradations.
Copyright © 2019, Njipouakouyou Samuel and Ibrahim Abdoul. This is an open access article distributed under the Creative Commons Attribution License,
which permits unrestricted use, distribution, and reproduction in any medium, provided the original work is properly cited.
INTRODUCTION
For already more ten years, it is frequently reported that the liquid surface of Lake Chad has been drastically decreased
during the last fifty years, from 25000 km2 to less than 2500
km2. This means that an average liquid surface of 450 km2
disappears every year, or 37.5 km2 every month, or 1.25 km2
every day. It is obvious that for such a degradation to occur there should be a deep, severe and long climatic change over the considered area. The importance of Lake Chad in the sub region of central Africa and even in the whole continent is evident. Between others, it provides inhabitants jobs, a lot of fishermen in that area, and water for various agricultural activities. It is clear that if this lake disappears, it will be a real tragedy for the populations of the four countries which bordered it, namely Chad, Niger, Nigeria and Cameroon. The impacts will be ecologic and socio-economic. The concerned governments have put in place a structure to survey the development of the lake and propose to them concrete solutions to any problem detected.
*Corresponding author: Njipouakouyou Samuel,
Faculty of Sciences, University of Dschang
This structure named "Commission du Bassin du Lac Tchad", in shorts CBLT, holds its boarding meeting every year. Of course, at each meeting, they deplore the devastating effects of the climate change on the lake more qualitatively than quantitatively, without fundamental causes. So, its work seems to be more administrative than academic. This paper investigates climatic factors which should be so powerful to stimulate such a rate of dryness of the liquid surface of Lake Chad during the considered laps of time. The duration of sunlight, the temperature and relative humidity of the air, and the pluviometry registered in the following localities: Bokoro, Bousso, Doba, Lai, Mao, Mongo, Moundou, Ndjaména, Pala and Sarh are the investigated parameters. These localities and parameters were chosen because they have some influences on the lake. In fact all of them are crossed by the two rivers, Logone and Chari, which provide water to Lake Chad. Moreover, the duration of sunlight determines the temperature regime in a locality; it is known that it plays an important role on the evapotranspiration which provides the atmosphere with humidity. This last one is determinant for the precipitations. Thus, any disturbance on these parameters will affect the level of water in Lake Chad. Some climatic studies have been done for some localities of Chad, between others the hydrous deficit
ISSN: 0976-3376
Asian Journal of Science and Technology Vol. 10, Issue, 06, pp.9725-9730, June,2019ASIAN JOURNAL OF
SCIENCE AND TECHNOLOGY
Article History:
Received 17th March, 2019
Received in revised form
29th April, 2019
Accepted 10th May, 2019
Published online 28th June, 2019
Key words:
Dryness, rate of dryness, Lake Chad, frequencies, distribution of the frequencies, duration of the sunlight, temperature of the air, relative humidity of the air, Precipitations, Pluviometry.
Citation:Njipouakouyou Samuel and Ibrahim Abdoul. 2019. “Diagnostic study of the climatic parameters to influence the dryness of water of lake chad on
in the southern part of Chad, (Njipouakouyou et al., June 2017); soil water reserve, precipitations and evapotranspiration
in Ndjaména and surroundings, (Njipouakouyou et al. July
2017; Njipouakouyou et al., September 2017). They revealed
the fragility of the climate of the concerned zones with regard to the considered parameters and its consequences in some
activities like agriculture were highlighted. Similar
investigations were done for other sahelian countries, for example the time distributions of rainfall, (Njipouakouyou, March 2019a) and air temperature, (Njipouakouyou, March 2019b), Bissau - Guinea Bissau. All of them revealed some climatic change in the concerned areas.
In this paper, attention is paid to the time variations of some climatic parameters and their influences on the rate of dryness of the water in Lake Chad. It is clear that with time, a parameter can increase, decrease or remains almost unchanged. For our study, the first case for the duration of sunlight and the second for the precipitations are important. It is obvious that when the duration of sunlight increases, the air temperature also increases and stimulates more evapotranspiration from the earth surface, including the liquid surface of the lake. As result, the liquid surface decreases. At the same time if the precipitations decrease the the liquid surface of the lake decreases faster. We divide the period of investigation in sub periods and classify the parameters in intervals. Then we determine the distribution of the frequencies of each parameter by sub periods and intervals. After we build tables of distribution and proceed to their analysis. If new intervals with higher values of the considered parameter appear when passing from a sub period up to another, it indicates that the parameter increases with time. Inversely if former intervals disappear, the parameter decreases with time. But if the same intervals remain, it means that there is no significant change on that parameter. Our study is based on this principle. This paper is structured into five sections. The first and present one introduces the problem. The second presents the data and the methodology. The results and their analysis are in section three. The fourth section is reserved to the conclusion and recommendations. At last the references in the fifth section end the work.
DATA AND METHODOLOGY
Data: We have data on the duration of sunlight, the
temperature and relative humidity of the air and the precipitations registered in some localities of Chad which are also among the main ones of the country. Thus, they are well equipped with instruments and acceptable qualified personnel. So their accuracy and representatively have no doubt. Their time irregularity is the only main problem. The instruments used are: heliograph Campbell Stokes for the duration of sunlight, normal thermometer for the temperature of the air, hair hygrometer for the relative humidity of the air and the pluviometer for the precipitations. The data is not primary but already treated one and presented in tabular form as monthly means of each parameter. In our turn we also proceeded to a second treatment eliminating doubted information. It comes that the results of this study are acceptable and meaningful.
Methodology: The periods of investigation were divided into
sub periods of 5 years each starting from 1961. So the first sub periods were 1961-1965, 1966-1970, and so on. Because of missed data, if a sub period contained less than 30 data, it was not taken into account. A full sub period should have 60 data,
i.e. 12 months multiplied by 5.The values of each parameter were grouped into intervals of equal length. Then we determined how many values of a parameter in each interval. This number corresponds to the frequency of the interval in the sub period. For all the sub periods and intervals, we built a table of distribution of the frequencies for the full period. This table is analyzed to highlight the factors responsible for such a rate of dryness of the liquid surface of Lake Chad. When passing from a sub period up to another new intervals with higher values appeared, then the considered parameter was increasing with the time and we appreciate its impact on the dryness of the lake. Similar analysis is done for the precipitations when former intervals with higher values of pluviometry disappeared when passing from a sub period up to another. In this case, the precipitations decreased reinforcing the dryness of the water from the lake. Our analysis will be based on this methodology.
RESULTS AND ANALYSIS
The data treatment has enabled us to build tables of distribution of the frequencies of each parameter. The results are as follows.
Duration of sunlight: The results of treatment of this
parameter are presented in Table 3.1 It shows no significant differences in the frequencies of distribution of the duration of sunlight at the earth surface for different sub periods and intervals. The modal frequencies mostly vary from 17 to 29 for an average monthly duration of sunlight of 9 hours per day. For Bokoro the modal frequencies varied from 15 to 23; for Bousso, from 14 to 29; for Doba, Lai and Mongo, there were respectively 12 and 15; for Mao, from 17 to 19; for Moundou, from 16 to 17; for Ndjaména, from 15 to 24; for Pala, from 15 to 21, and for Sarh from 10 to 19. Very few cases with average monthly duration of sunlight of 11 hours per day were registered in some localities. We had 7 cases in Bokoro, 8 in Mao, 4 in Mongo, 5 in Ndjaména and only one in Pala. It is clear that this duration of sunlight was enough to stimulate
such a daily rate of dryness of 1.25 km2 of the liquid surface of
Lake Chad.
The temperature of the air: The results of treatment of this
parameter are presented in Table 3.2 It shows no significant differences in the frequencies of distribution of the monthly means of the air temperature for different sub periods and intervals. It also indicates that during the considered period this parameter did not exceed 36.0°C except in the localities of Bokoro, Ndjaména and Sarh where at most 2 cases of monthly mean of at least 38.0°C was registered. For Bokoro, the modal frequencies varied from 8 to 11 corresponding respectively to average values of 35.0° and 29.0°C; for Doba these values were 13 and 24 for 29.0 and 27.0°C respectively, for Lai they were 13 and 19 for 27.0°C; for Mao 7 and 8 for 33.0 and 31.0°C respectively; for Mongo, 12 for 27.0° and 31.0°C; for Moundou, they were 9 and 24 for 27.0° and 25.0°C respectively; for Ndjaména 12 and 19 for 27.0°C ; for Pala, 14 and 25 for 27.0° and 25.0°C respectively; for Sarh 16 and 26 for 27.0°C. It is clear that during the whole period of investigation the air temperature did not increase enough to
stimulate such a daily rate of dryness of 1.25 km2 of the liquid
surface of Lake Chad.
The relative humidity of the air: The results of treatment of
Table 1. Distribution of the frequencies of the duration of sunlight by sub periods and intervals in some localities of Chad
Bokoro [5.50,6.50[ [6.50,7.50[ [7.50,8.50[ [8.50,9.50[ [9.50,10.50[ [10.50,11.50[
1986-1990 12 3 9 12 17 -
1991-1995 4 4 4 15 13 2
1996-2000 4 5 2 13 23 5
Bousso
1961-1965 10 9 10 14 12 -
1971-1975 5 6 5 29 6 -
Doba
1991-1995 9 12 12 8 5 --
Lai
1991-1995 8 13 15 9 9 --
Mao
1986-1990 3 2 10 15 19 5
1991-1995 - 4 11 13 17 3
Mongo
1991-1995 8 6 8 9 15 4
Moundou
1986-1990 7 4 17 12 10 -
1991-1995 13 16 11 8 4 -
1996-2000 11 20 8 16 8 -
Ndjaména
1986-1990 3 7 5 20 24 -
1991-1995 4 12 4 20 20 -
1996-2000 4 7 7 18 23 -
2001-2005 2 11 10 16 19 3
2006-2010 6 6 13 8 24 -
2011-2015 5 3 13 12 15 2
Pala
1961-1965 10 4 13 11 17 1
1971-1975 8 8 9 21 12 -
1991-1995 12 12 15 11 7 -
Sarh
1981-1985 9 4 13 13 3 -
1986-1990 13 11 19 19 12 -
1991-1995 12 9 11 1& 8 -
1996-2000 18 10 14 14 15 -
2001-2005 16 13 16 16 12 -
2006-2010 18 14 11 11 5 -
2011-2015 10 10 4 4 2 -
Table 2. Distribution of the frequencies of the monthly means of the temperature of the air in some localities of Chad
Bokoro [20,22[ [22,24[ [24,26[ [26,28[ [28,30[ [30,32[ [32,34[ [34,36[ [36,38[ [38,40[ [40,42[
1986-1990 1 3 6 7 10 3 6 4 - - -
1991-1995 3 3 5 6 11 5 7 2 - - -
1996-2000 - - - 3 7 5 4 8 2 1 -
Doba
1986-1990 1 - 13 24 10 7 4 - - - -
1991-1995 - - 2 10 13 4 6 1 - - -
Lai
1991-1995 - 4 11 19 7 8 3 - - - -
1996-2000 - - - 13 10 6 4 3 1 - -
Mao
1991-1995 3 6 2 2 7 8 7 9 1 - -
1996-2000 - 2 3 1 4 5 7 2 6 - -
Mongo
1986-1990 - - - 8 6 12 6 3 - - -
1991-1995 - - 2 12 9 10 6 2 - - -
Moundou
1986-1990 - 5 20 17 7 10 1 - - - -
1991-1995 - 3 24 18 5 10 - - - - -
1996-2000 - 3 6 18 15 7 5 3 - - -
2001-2005 - 1 19 8 3 6 2 - - - -
2006-2010 - 1 15 10 6 6 1 - - - -
2011-2015 - - 7 9 4 4 1 - - - -
Ndjaména
1981-1985 1 3 2 13 8 10 6 3 - - -
1986-1990 - 4 6 19 8 9 7 1 4 1 1
1991-1995 - 8 9 13 9 11 9 - - - -
1996-2000 - 5 8 15 10 7 8 3 - - -
2001-2005 2 5 7 13 15 7 6 5 - - -
2006-2010 1 3 7 15 15 8 8 3 - - -
2011-2015 1 5 4 12 11 5 10 2 - - -
Pala
1986-1990 1 1 17 14 4 2 4 - - - -
1991-1995 - 4 25 16 3 11 - - - - -
1996-2000 - - 15 15 4 8 5 5 - - -
Sarh
1981-1985 - - 7 16 5 4 1 - - - -
1986-1990 - 1 13 26 9 6 5 - - - -
1991-1995 - - 13 19 6 8 6 3 2 2 -
Table 3.3 shows that for almost all the localities, the modal frequencies were usually around 17 for the relative humidity of the air between 15 and 35%. In Bokoro, the modal frequencies varied from 12 to 21 for the monthly means of the relative humidity of 25%; in Bousso they varied from 10 to 18 for the same value of the relative humidity and 75% for the sub period 1961-1965; in Doba and Lai they were 18 and 19 for 85% and 25% respectively. Note that for these four localities, the monthly means of the relative humidity did not exceed 90%. In Mao, the monthly means of the relative humidity did not exceed 80%. Their modal frequencies were between 13 and 23 for the monthly means of the relative humidity of 25%. In the remaining localities, the monthly means of the relative humidity were less than 90% except in Ndjamena where 95% was registered. Modal frequencies in Moundou varied from 6 to 17 for 25 and 85% respectively; in Ndjaména, from 9 to 20 for 25%; in Pala from 10 to 18 for the same relative humidity and in Sarh from 6 to 20 for 25 and 85% respectively. It is clear that the air in the considered localities is usually dry or wet-dry. Consequently, the process of evapotranspiration should be intensive in these areas. Consequently, the process of evaporation from Lake Chad should be intense, the lost of water, too.
But no climatic change to stimulate a daily rate of dryness of
1.25 km2 was detected.
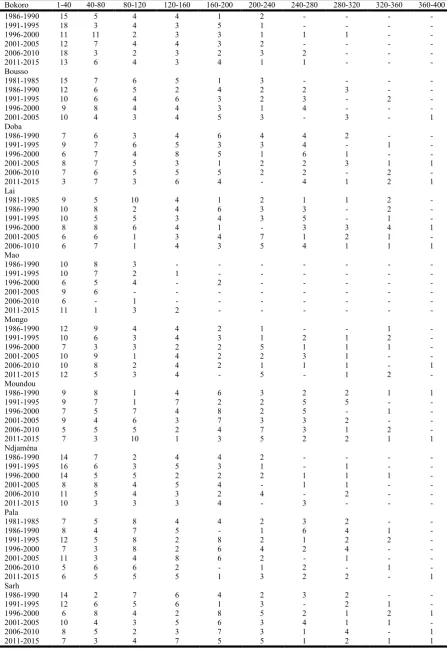
Precipitations: The distribution of the frequencies of the
pluviometry by sub periods and intervals in some localities of Chad is presented in Table 3.4. It confirms the fact that there are not enough precipitations in this region. The monthly pluviometry is usually at least 160 mm of rainfall. This is due to the presence of the desert, Sahara. For all the localities and the whole period of investigation, the modal frequencies were observed mostly for the monthly mean pluviometry of 20 mm. The situation was even worse for the locality of Mao at the surroundings of Lake Chad. Its pluviometry rarely exceeded a monthly mean of 100 mm. In Bokoro, the modal frequencies varied from 11 to 18, in Bousso from 9 to 15, in Doba from 7 to 9, in Lai from 7 to 10, in Mao and Mongo from 6 to 10, in Moundou from 7 to 9, in Ndjaména from 8 to 16, in Pala from 6 to 12 and in Sarh from 7 to 14, all for a monthly mean of 20 mm. Pluviometry of more than 100 mm per month was rarely registered. Some with around 600mm/month was registered in Doba in July 2001 and August 2011 and in Pala in August 1993.
Table 3.3. Distribution of the frequencies of the monthly means of the relative humidity of the air in some localities of Chad
Bokoro [1,10[ [10,20[ [20,30[ [30,40[ [40,50[ [50,60[ [60,70[ [70,80[ [80,90[ [90,100[
1961-1965 - 4 21 8 5 6 5 9 2 -
1966-1970 - 4 20 6 9 5 4 8 4 -
1071-1975 - 2 21 9 9 6 5 6 3 -
1976-1980 - - 12 8 4 4 2 7 1 -
1991-1995 - 3 16 6 5 5 4 6 2 -
Bousso
1961-1965 - 1 13 5 7 7 3 17 7 -
1966-1970 - - 17 3 5 10 5 8 12 -
1071-1975 - 1 18 5 6 5 8 6 11 -
1976-1980 - 3 10 2 5 1 4 3 10 -
Doba
1991-1995 - - 5 13 1 5 7 9 18 -
Lai
1996-2000 - 2 19 4 3 9 3 7 12 -
Mao
1961-1965 1 14 19 5 5 8 5 3 - -
1966-1970 - 7 23 11 4 8 5 2 - -
1071-1975 - 12 21 9 5 8 2 - - -
1976-1980 - 4 13 7 4 7 1 - - -
1991-1995 5 15 13 6 2 1 1 1 - -
Moundou
1981-1985 - 5 6 4 5 6 3 3 2 -
1986-1990 - - 15 6 3 5 6 10 15 -
1991-1995 - - 15 3 2 7 4 10 17 -
2001-2005 1 5 12 5 3 9 9 1 5 -
2006-2010 1 5 13 3 2 6 6 2 2 -
2011-2015 - - 8 4 3 4 1 3 5 -
Ndjaména
1981-1985 - 7 9 6 3 4 3 3 - -
1986-1990 - 12 18 4 4 6 3 8 3 -
1991-1995 - 6 20 6 4 7 4 8 5 -
1996-2000 - 6 15 5 3 5 4 5 5 -
2001-2005 - 1 20 10 1 6 5 7 7 -
2006-2010 - 7 14 9 6 5 3 8 5 -
2011-2015 - 2 15 2 4 4 3 3 1 1
Pala
1971-1975 - - 18 4 8 3 7 7 12 -
1991-1995 3 13 11 2 6 7 9 6 3 -
1996-2000 2 12 10 3 6 5 8 4 9 -
Sarh
1986-1990 - - 11 9 5 2 7 9 17 -
1991-1995 - - 9 10 3 6 3 13 16 -
1996-2000 - - 8 8 8 4 8 4 20 -
2001-2005 - - 12 9 4 7 7 6 12 -
Both localities are in the southern part of the country where the climate is less severe. It is evident that Lake Chad receives from the precipitations a certain quantity of water which is not probably sufficient to compensate different losses. These received quantities of rain water should brake down the daily
rate of dryness of 1.25 km2 of liquid surface of the lake.
Conclusion and recommendations: This study enable us to
confirm that among the parameters selected, there is not any one which could stimulate such a daily rate of dryness of 1.25
km2 of the liquid surface of Lake Chad. If this dryness was
effective, the causes should be searched elsewhere. One of Table 3.4. Distribution of the frequencies of the monthly pluviometry in some localities of Chad
Bokoro 1-40 40-80 80-120 120-160 160-200 200-240 240-280 280-320 320-360 360-400
1986-1990 15 5 4 4 1 2 - - - -
1991-1995 18 3 4 3 5 1 - - - -
1996-2000 11 11 2 3 3 1 1 1 - -
2001-2005 12 7 4 4 3 2 - - - -
2006-2010 18 3 2 3 2 3 2 - - -
2011-2015 13 6 4 3 4 1 1 - - -
Bousso
1981-1985 15 7 6 5 1 3 - - - -
1986-1990 12 6 5 2 4 2 2 3 - -
1991-1995 10 6 4 6 3 2 3 - 2 -
1996-2000 9 8 4 4 3 1 4 - - -
2001-2005 10 4 3 4 5 3 - 3 - 1
Doba
1986-1990 7 6 3 4 6 4 4 2 - -
1991-1995 9 7 6 5 3 3 4 - 1 -
1996-2000 6 7 4 8 5 1 6 1 - -
2001-2005 8 7 5 3 1 2 2 3 1 1
2006-2010 7 6 5 5 5 2 2 - 2 -
2011-2015 3 7 3 6 4 - 4 1 2 1
Lai
1981-1985 9 5 10 4 1 2 1 1 2 -
1986-1990 10 8 2 4 6 3 3 - 2 -
1991-1995 10 5 5 3 4 3 5 - 1 -
1996-2000 8 8 6 4 1 - 3 3 4 1
2001-2005 6 6 1 3 4 7 1 2 1 -
2006-1010 6 7 1 4 3 5 4 1 1 1
Mao
1986-1990 10 8 3 - - - -
1991-1995 10 7 2 1 - - - -
1996-2000 6 5 4 - 2 - - - - -
2001-2005 9 6 - - - -
2006-2010 6 - 1 - - - -
2011-2015 11 1 3 2 - - - -
Mongo
1986-1990 12 9 4 4 2 1 - - 1 -
1991-1995 10 6 3 4 3 1 2 1 2 -
1996-2000 7 3 3 2 2 5 1 1 1 -
2001-2005 10 9 1 4 2 2 3 1 - -
2006-2010 10 8 2 4 2 1 1 1 - 1
2011-2015 12 5 3 4 - 5 - 1 2 -
Moundou
1986-1990 9 8 1 4 6 3 2 2 1 1
1991-1995 9 7 1 7 2 2 5 5 - -
1996-2000 7 5 7 4 8 2 5 - 1 -
2001-2005 9 4 6 3 7 3 3 2 - -
2006-2010 5 5 5 2 4 7 3 1 2 -
2011-2015 7 3 10 1 3 5 2 2 1 1
Ndjaména
1986-1990 14 7 2 4 4 2 - - - -
1991-1995 16 6 3 5 3 1 - 1 - -
1996-2000 14 5 5 2 2 2 1 1 1 -
2001-2005 8 8 4 5 4 - 1 1 - -
2006-2010 11 5 4 3 2 4 - 2 - -
2011-2015 10 3 3 3 4 - 3 - - -
Pala
1981-1985 7 5 8 4 4 2 3 2 - -
1986-1990 8 4 7 5 - 1 6 4 1 -
1991-1995 12 5 8 2 8 2 1 2 2 -
1996-2000 7 3 8 2 6 4 2 4 - -
2001-2005 11 3 4 8 6 2 - 1 - -
2006-2010 5 6 6 2 - 1 2 - 1 -
2011-2015 6 5 5 5 1 3 2 2 - 1
Sarh
1986-1990 14 2 7 6 4 2 3 2 - -
1991-1995 12 6 5 6 1 3 - 2 1 -
1996-2000 6 8 4 2 8 5 2 1 2 1
2001-2005 10 4 3 5 6 3 4 1 1 -
2006-2010 8 5 2 3 7 3 1 4 - 1
them should be the following. The intensive and permanent food pressure caused by the rapid growth of the populations has forced inhabitants to develop new agricultural and cultivation techniques. Today food is produced as well in the rainy season as in the dry one when irrigation is unavoidable. For this purpose farmers abusively use water from rivers, lakes and other reserves. It is obvious that this practice should considerably reduce the quantities of water in the nature in general, and Lake Chad in particular. Besides, we should not forget that the considered region has a very rude climate with long dry season during which almost all the rivers in the region are completely dried. It is thus probable that from year to year, the liquid surface of Lake Chad decreases, but surely not at the above mentioned rate. Maybe, this rate was increased to force governments and international communities to provide the committee in charge of the lake with materials and financial assistance which should enable it to carry their duties. Between other recommendations, the next ones should take our attention. While keeping in mind the problem of the protection of the environment, authorities should find and manage new appropriate zones to settle the populations. Water reserves and damps should be built in the new settlements to facilitate farmers and agricultural activities. It should be better to introduce in scholar programs of education new courses on the environment and its protection. The authors cease this opportunity to extend their sincere thanks to Mr Mahamat Ahmat general manager of the “Hotel de la Paix Nouridine”
and all his personnel for the warm wellcome and very friendly relationship they have provided to them during their one month stay in Kousseri.
REFERENCES
Njipouakouyou Samuel, (a). Time distribution of rainfall in
Bissau from 1971 to 2015. IJCR, vol 11, issue 03, March 2019, pp. 1821-1823.
Njipouakouyou Samuel, (b). Time distribution of the air
temperature in Bissau from 1971 to 2015. IJCR, vol. 11, issue 03, March 2019, pp. 1830-1832.
Njipouakouyou Samuel, Aoudou Doua Sylvain and Galmai
Orozi. Investigating the minima quantity of soil water and
its time tendency in Ndjaména and surroundings-Chad. IJCR, vol. 9, issue 07, July 2017, pp. 54482-54485. Njipouakouyou Samuel, Galmai Orozi and Yacoub Idriss
Halawlaw. Minimal value of the hydrous deficit index
estimates on the earth-atmosphere system in southern part of Chad. IJCR, vol. 9, issue 06, June 2017, pp. 51782-51789.
Njipouakouyou Samuel, Galmai Orozi, Aoudou Doua Sylvain, Yacoub Idriss Malawlaw, Dokoubou Joseph Rodolphe.
Determining the best seeding and duration of the cultivation period in Ndjaména and surroundings-Chad.
IJCR, vol. 9, issue 09, September 2017, pp. 56894-56897.