* To whom all correspondence should be addressed. E-mail: [email protected]
RAPD Analysis of Leaf Litter Associated
Bacterial Population From Canal, Kollemcode
*P.A. Mary Helen, Deepi, S. Jaya Sree, A.M. Nizzy and S.M. Madoen Abisha
Department of Biotechnology, Malankara Catholic College, Mariagiri, Kaliakkavilai - 629 153 (India).
(Received: 01 September 2011; accepted: 09 October 2011)
Random amplified polymorphic DNA (RAPD) analysis was performed on 7 bacterial isolates isolated from leaf litter from canal Kollemcode. The isolates produced reproducible amplification products which were sufficiently polymorphic to allow differentiation of the strains. Five primers such as OPA-06, OPA-07, OPA-17, OPAD-02, OPAD-07 were used for the RAPD analysis. DNA banding patterns generated by RAPD were scored for the presence (1) or for absence (0) of each amplified band. For genetic distance analysis, using NTSYS software Cluster analysis was based on similarity matrices using the unweighted pair group method analysis (UPGMA) program in the software package. The Jaccard coefficient was used for dendrogram construction. A dendrogram based on these results showed a high level of genetic similarity between different bacterial isolates, and genetic differences were expressed in clusters. The genetic difference between the overall population was low and showed similarity with each population.
Key words: RAPD analysis, Dendrogram, Cluster analysis, Genetic distance, Similarity matrix.
Random amplified polymorphic DNA (RAPD) is a convenient and sensitive method of species identification that is finding increasing application in such fields as epidemiology, molecular genetics, microbial ecology, and molecular evolution and taxonomy (Berg et al.,
1994). Following purification of genomic DNA, PCR amplification is performed using a short primer of arbitrary sequence. Amplification of a particular genomic sequence depends on the fortuitous nearby occurrence, on opposite DNA strands, of a pair of sequences complementary to the primer.
These fragments are resolved by gel electrophoresis, and comparison of the resulting patterns of bands provides information about the relatedness of the organisms in question. The chief drawback of the RAPD method is its sensitivity to experimental conditions and the consequent variability from run to run, and from lab to lab.
Molecular diversity by PCR based RAPD analysis allows identification and placement of the strains in genetically distinct and related groups (Lee and Henry, 2001). Randomly amplified polymorphic DNA (RAPD) involves the use of random primers in PCR reactions (Williams et al.,
technique gives the opportunity to get information about the biodiversity in a group of isolates (Hansen et al., 1998).
In this context, a study was conducted on the isolation of DNA from the bacterial population in the canal near kollemcode. Also diversity analysis was determined by PCR based RAPD analysis to understand the genetic variation among organisms.
MATERIAL AND METHODS
Bacterial Isolates
A total of 7 bacterial isolates were isolated from leaf litter collected from canal near Kollemcode by serial dilution agar plating method.
DNA Preparation
The genomic DNA isolation from bacteria was described by the method Murray and Thompson (1980) and Sillhavy et al., (1984). CTAB method was the most commonly used protocol for the preparation of bacterial genomic DNA. 1.5ml of microbial culture was taken in a micro centrifuge tube and centrifuged for 2minutes and the supernatant was discarded. The pellet was resuspended in 567µl of TE by repeated pipetting. Then 30 µl of 10% SDS and 3 µl of 20 mg/ml proteinase-k was added, mixed thoroughly and incubated at 37o C for 1 hour. 100 µl of 5M NaCl was added and thoroughly mixed. And then 80 µl CTAB/NaCl solution was added mixed thoroughly and incubated for 10 minutes at 65o C. Equal volume of chloroform was added, mixed thoroughly and spinned for 4 to 5 minutes in a microcentrifuge. This extraction removes CTAB protein/ polysaccharide complexes. A white interface should be visible after centrifugation. The aqueous phase with phenol/chloroform was extracted and spinned in a microcentrifuge for 5 minutes. The supernatant was transferred to a fresh tube. 0.6 volume of isopropanol was added for the nucleic acid precipitation. The precipitate was transferred to a fresh tube containing 70% ethanol. The precipitate was centrifuged at 10,000 rpm for 5 minutes at room temperature. The pellet was redissolved in 100 µl TE buffer.
RAPD Analyses
Five primers designated 06, OPA-07, OPA-17, OPAD-02 and OPAD-07 (Operon Biotechnology) were used (Table- I). RAPD
analysis was carried out essentially as described by Brons and Von (2008). A 25µl PCR reaction mixture contained10X PCR buffer- 1x , 25mM Mgcl-2.5mM, 10mM dNTP mix- 800µM, 25Pico moles Primer- 5 Pico moles, Taq DNA polymerase- 0.75U, Template DNA- 40ng, Milli Q water- Variable. After the solutions were mixed, the tubes containing the mixtures were placed in a PTC-100 programmable thermal controller (MJ Research, Inc.). The thermal cycler was programmed for 1 cycle of initial denaturation for 3 minutes at 94°C. This was followed by 40 cycles programmed for denaturation at 94°C for 50seconds, annealing at 37°C for 1 minute, and extension at 72°C for 1.30 minutes. An additional cycle of at 7 minutes at 72°C was use for final extension followed by 40 cycles of 94°C for 1 min, 30°C for 2 min, and 72°C for 2 min and a final extension period of 72°C for 7 min. Randomly amplified products were analyzed by electrophoresis on a 1.2% agarose gel in Tris-borate-EDTA buffer (0.5MTris, 0.5Mboric acid, 10 mM EDTA [pH 8.0]) and visualized by ethidium bromide staining. The molecular size standards used were ranges from 100bp to 1kb.
Analysis of Data from RAPD
DNA banding patterns generated by RAPD were scored for the presence (1) or for absence (0) of each amplified band. All RAPD assays were repeated twice and only the reproducible bands were scored. For considering a marker as polymorphic, the absence of an amplified product in at least one species was used as a criterion. For genetic distance analysis, using NTSYS software Cluster analysis was based on similarity matrices using the unweighted pair group method analysis (UPGMA) program in the software package. The Jaccard coefficient was used for dendrogram construction.
RESULTS
Bacterial Isolates
The bacterial isolates were isolated from leaf litter by serial dilution agar plating method. After the incubation, serially diluted agar plated samples showed seven different types of bacterial isolates and indicated as B1, B2, B3, B4, B5, B6, B7. RAPD Analyses
Table 1. Oligonucleotides used for the rapd reactions operon technologies 10-mer oligonucleotide rapd primers for bacterial dna amplification
S. No Primer Sequences (5 ’ – 3’) GC content (%)
1 OPA-06 GGTCCCTGAC 70.00%
2 OPA-07 GAAACGGGTG 60.00%
3 OPA-17 GACCGCTTGT 60.00%
4 OPAD-02 CTGAACCGCT 60.00%
5 OPAD-07 CCCTACTGGT 60.00%
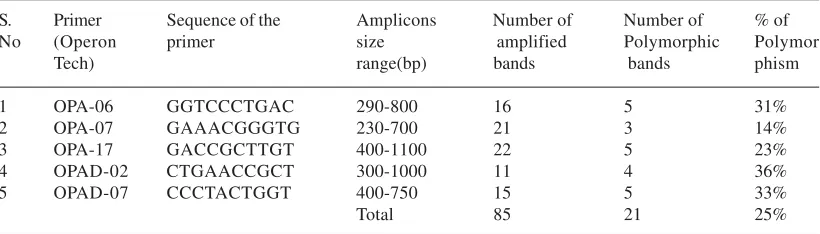
Table 2. Genetic diversity analysis using rapd markers in bacteria
S. Primer Sequence of the Amplicons Number of Number of % of No (Operon primer size amplified Polymorphic Polymor
Tech) range(bp) bands bands phism
1 OPA-06 GGTCCCTGAC 290-800 16 5 31%
2 OPA-07 GAAACGGGTG 230-700 21 3 14%
3 OPA-17 GACCGCTTGT 400-1100 22 5 23%
4 OPAD-02 CTGAACCGCT 300-1000 11 4 36%
5 OPAD-07 CCCTACTGGT 400-750 15 5 33%
Total 85 21 25%
DNA. A total of 85 reproducible amplification products were sufficiently polymorphic to allow the differentiation of the strains under study. High level of genetic similarity was observed between organisms. Five random primers, each with 10 bases generated a total of 21 polymorphic bands out of 85 total bands and the morphological variations a significant level (25%) of polymorphism was observed (Table- II and Plate- I).
Analysis of Data from RAPD
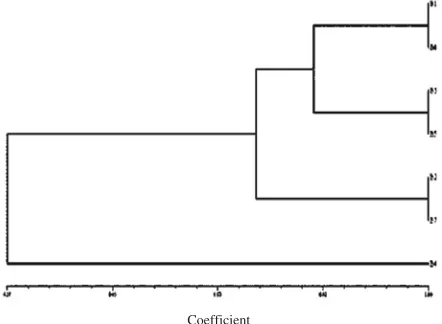
Cluster analysis was carried out based on UPGMA Jaccard coefficient. In this study, dendrogram divided into II clusters. Cluster I subdivided into two clusters: Subcluster I and Subcluster II. Subcluster I contain bacterial isolates B1 and B6 showed closely relationship. Subcluster II showed close relationships with B3 and B5. Cluster II contain bacterial isolates B2 and B7. The last cluster contain B4 that show polymorphism. The genetic difference between the overall population was low and showed similarity with each population. The dendrogram was represented in Fig. 1.
DISCUSSION
RAPD analysis was carried out to find distribution of genetic variation between
REFERENCES
1. Anderson M. J., Gull K. and Denning D. W., J. Clin. Microbiol., 34, 87-93 (1996).
2. Bassam B. J., Caetano-anolles G. and Gresshoff P. M., Applied Microbiology and Biotechnology., 38, 70-76 (1992).
3. Berg D. E., Akopyants N.S. and Kersulyte D., Methods in Molecular and Cellular Biology.,5, 13–24 (1994).
4. Brons J. K. and Von E. J. D. Applied Environ Microbiol.,74, 2717-2727 (2008).
5. Hadrys H., Balick M. and Schierwater, B., Molecular Ecology.,1, 55-63(1992).
6. Hansen B. M., Damgaard P. H., Eilenberg J. and
Pedersen J. C. Journal of Invertebrate Pathology., 71, 106-114 (1998).
7. Lee L. S. and Henry J. J., The DNA finger printing of plants,CABL Publishing, Oxford, UK, 28, 67-77 (2001).
8. Murray M. G. and Thompson W. F., Nucleic Acids Res.,8, 4321-4325 (1980).
9. Pfaller M. A., Clin. Infect. Dis., 14, 4-10 (1992). 10. Rath P. M., Mycoses., 44, 65-72 (2001). 11. Sillhavy T., Berman M. L. and Enquist L. W.,
Experiments with gene fusions. Cold spring Harbor, (1984).
12. Williams J. G., Kubelik A. R., Livak K. J., Rafalski J. A. and Tingey S.V., Nucleic Acids Res., 18, 6531–6535 (1990).
Fig. 1. Phylogenetic Tree for Bacterial Isolates