R E S E A R C H
Open Access
Stability-based validation of dietary
patterns obtained by cluster analysis
Nicolas Sauvageot
1*, Anna Schritz
1, Sonia Leite
2, Ala
’
a Alkerwi
1, Saverio Stranges
1, Faiez Zannad
3, Sylvie Streel
4,
Axelle Hoge
4, Anne-Françoise Donneau
4, Adelin Albert
4and Michèle Guillaume
4Abstract
Background:Cluster analysis is a data-driven method used to create clusters of individuals sharing similar dietary habits. However, this method requires specific choices from the user which have an influence on the results. Therefore, there is a need of an objective methodology helping researchers in their decisions during cluster analysis. The objective of this study was to use such a methodology based on stability of clustering solutions to select the most appropriate clustering method and number of clusters for describing dietary patterns in the NESCAV study (Nutrition, Environment and Cardiovascular Health), a large population-based cross-sectional study in the Greater Region (N= 2298).
Methods:Clustering solutions were obtained with K-means, K-medians and Ward’s method and a number of
clusters varying from 2 to 6. Their stability was assessed with three indices: adjusted Rand index, Cramer’s V and misclassification rate.
Results:The most stable solution was obtained with K-means method and a number of clusters equal to 3. The
“Convenient”cluster characterized by the consumption of convenient foods was the most prevalent with 46% of the population having this dietary behaviour. In addition, a“Prudent”and a“Non-Prudent”patterns associated respectively with healthy and non-healthy dietary habits were adopted by 25% and 29% of the population. The “Convenient”and“Non-Prudent”clusters were associated with higher cardiovascular risk whereas the“Prudent” pattern was associated with a decreased cardiovascular risk. Associations with others factors showed that the choice of a specific dietary pattern is part of a wider lifestyle profile.
Conclusion:This study is of interest for both researchers and public health professionals. From a methodological standpoint, we showed that using stability of clustering solutions could help researchers in their choices. From a public health perspective, this study showed the need of targeted health promotion campaigns describing the benefits of healthy dietary patterns.
Keywords:Dietary patterns, Cluster analysis, Stability
Background
In recent years, the dietary patterns (DP) approach has been used extensively to describe overall eating patterns in populations. In the literature, the most famous methods for computing dietary patterns are cluster ana-lysis (CA) and principal component anaana-lysis (PCA). However, both methods describe diet in quite different ways. In PCA, continuous factors are defined based on
correlations between dietary intakes and each individual has a score for all derived factors [1]. However, an individ-ual’s DP is difficult to interpret as it is described by a score on several factors [2]. On the other hand, cluster analysis separates individuals into mutually exclusive groups (clus-ters) based on similarities between their diets. Compared to factors, individual DP are easier to interpret since indi-viduals are assigned to one cluster only.
One major challenge in using cluster analysis is that the obtained solution strongly depends upon the choices made by the investigator. Among them, the choice of the clustering method and the optimal number of clusters are * Correspondence:[email protected]
1Luxembourg Institute of Health (LIH), CCMS (Competence center in
methodology and statistics), 1A rue Thomas Edison, L-1445 Strassen, Luxembourg
Full list of author information is available at the end of the article
particularly important [3]. Indeed, since different clus-tering methods make different assumptions about the structure of the data, the choice of the method should be done according to the group structure expected. However, researchers do not have any prior knowledge about the structure of the clusters and their number. As a result, it appears that researchers run different clus-tering methods with different number of clusters and tend to present the best interpretable solution [1, 2, 4]. Obvi-ously, this solution may not be the best representative of dietary patterns in a population. As an alternative, some studies used indices measuring distances between clusters [3, 5–7]. However, since those indices assume a group structure, their use should be avoided when group struc-ture is unknown [8].
Consequently, researchers need a method allowing objective selection of the most appropriate clustering method and number of clusters for describing their data. Lange et al. introduced an objective criterion to compare different clustering solutions and to choose the most appropriate [8]. This criterion measures the goodness of clustering solutions by assessing their stability. A stable clustering solution should be similar to solutions com-puted on other data sets drawn from the same source. The idea is that clustering solutions exhibiting higher stability are likely to be more appropriate for describing the data.
Therefore, the primary objective of this study was to test such objective procedure to select the optimal clustering method and the number of clusters describing dietary patterns, based on data from the interregional, cross-sectional population-based NESCaV study (Nutrition, Environment and Cardiovascular Health). For simpli-city, we decided to limit its application to traditional clustering methods used in the field of dietary pattern analysis, namely K-means, K-medians and Ward’s mini-mum variance. Secondly, description of the selected clustering solution and relationships with nutrients intakes, socio-demographic, lifestyle and cardiovascular risk factors (CVRF) were presented. Finally, a compari-son was also made with PCA factors.
Methods
Details concerning the NESCAV study have been pre-sented previously [9–11]. Briefly, it is the first cross-border cardiovascular health population-based study, based on a stratified random sample of 3133 subjects, aged 18–69 years, recruited from three neighboring regions, namely Grand-Duchy of Luxembourg, Wallo-nia in Belgium, and Lorraine in France, constituting an important segment of the Greater Region population. Periods of recruitment were 2007 to 2008 for Grand-Duchy of Luxembourg and 2010 to 2011 for Wallonia and Lorraine. Pregnant women, people living in institutions,
subjects outside the age range 18–69 years and those deceased before recruitment were excluded [10]. Sample sizes were computed in order to be able to estimate preva-lence of cardiovascular risk factor with a level of confi-dence of 95% and a precision of 1%.
A 134-food frequency questionnaire (FFQ) was used to assess dietary intakes. Description and validation of this questionnaire have been detailed elsewhere [12, 13]. To facilitate the analysis, the 134 food items were merged into 45 broader food groups according to their similarities (unpublished observations). Daily food intakes were com-puted as the product of daily frequency of consumption and the amount consumed. Considered cardiovascular risk factors (CVRF) were body mass index (BMI, kg/m2), waist to hip ratio (WHR), systolic blood pressure (SBP, mmHg), diastolic blood pressure (DBP, mmHg), fasting plasma glucose (FPG, mg/dl), glycated haemoglobin (HbA1c, %), low-density lipoprotein cholesterol (LDL, mg/dl), high-density lipoprotein cholesterol (HDL, mg/dl) and triglycerides (TG, mg/dl). Information on treatment for hypertension, diabetes and dyslipidaemia was also gathered. Collected lifestyle behaviours were smoking sta-tus and level of physical activity expressed as weekly en-ergy expenditure in metabolic equivalent task minutes per week (METs min/week), based on self-reported data from the International Physical Activity Questionnaire (IPAQ) [14, 15]. Specific inclusion criteria for this particular study were also defined. Flowchart of participants who met inclusion criteria were described (see Additional file 1: Figure S1). First, 138 participants with non-reliable report-ing in the FFQ and outlyreport-ing values on nutrient intakes were excluded. Then, since relationships between dietary habits and CVRF may be biased by participants who had a serious cardiovascular event (n= 327) and/or who are under diet (n= 312), those individuals were excluded. In addition, participants who were not fasting at time of blood collection (n= 58) were also discarded. Thus, the final sample entailed 2298 individuals.
The protocol of the study was approved by the following institutional review boards: Comité National d’Ethique de Recherche (Grand-Duchy of Luxembourg), Comité de Protection des Personnes Est-III (Lorraine), Comité d’Ethique Hospitalo-Facultaire Universitaire de Liège (Wallonia) and Ethik-Kommission Ärztekammer des Saarlandes (Saarland). All participants provided writ-ten informed consent.
Statistical analysis
Transformation of the data
[17]. Of the 103,410 available intakes, only 294 (0.28%) were truncated. Thirdly, since food intakes with large scales tend to have a larger effect on clustering solutions, food intakes were standardized by subtracting the mini-mum intake and then dividing by the range [3, 18].
Formalization of cluster analysis
Let X = (X1, …, Xn) be the dataset of n= 2298 individuals to be clustered where Xi is a 45-dimensional vector con-taining the 45 standardized food group intakes of the i-th individual. A clustering algorithm A with a predefined number of cluster k constructs a solution Y of the data set X into k clusters (Y := Ak(X)). This solution Y is repre-sented by an n-dimensional vector of labels Y = (Y1,…, Yn) where Yi= v if the i-th individual is assigned to cluster v (v∈{1,…, k}).
The measure of stability
Cluster stability exploits the fact that when multiple datasets are sampled from the same distribution, the clustering algorithm is expected to behave in the same way and produce similar results. Based on this idea, Lange et al. introduced a stability measure computed on the comparison of solutions obtained on different datasets drawn from the same source [8]. This stability measure was then compared across clustering methods and numbers of clusters to select the model associated with the most stable solution. Since this concept and its use in practice were previously described in detail [8], the method is only summarized below.
Briefly, considering a solution Y := Ak(X), the method consists in assessing its stability by randomly splitting the data X into two independent half sets Xtr (training dataset) and Xte (test dataset), and comparing the solu-tions obtained for these halves (Ytr:= Ak(Xtr) and Yte := Ak(Xte)). However, since dataset Xtrand Xte are disjoint, clustering solutions are not directly comparable. To make these solutions comparable, a solution transfer mechanism allows extension of the clustering solution Ytrof the dataset Xtrto the dataset Xte. Technically, the training dataset (Xtr,Ytr) is used to construct a classifier
ɸwhich is then used to predict label of individuals from the test sample Xte. Consequently, the two clustering solutions Ak(Xtr) and Ak(Xte) are made comparable by comparing ɸ (Xte) and Ak(Xte). The stability measure between the two solutions is then computed as the em-pirical misclassification rate [8]. Lower misclassification rates indicate higher stability.
In order to reduce the effect of random splitting, the algorithm was repeated 20 times and the estimates of stability for a given solution were computed as the aver-age of the 20 corresponding estimates. The highest esti-mate of stability indicates the optimal clustering method and number of clusters. Clustering methods considered
were the Ward’s minimum variance, means and K-medians and number of clusters k varying from 2 to 6. Since K-means and K-medians may return a local optimum, algorithms were always run 1000 times with different random starting seeds, and the solution that had the minimum total within-cluster sum of squares distances was selected. Concerning the choice of the classifier ɸ , since we want to measure the stability of clustering solutions, the influence of the classifier should be minimized. For this purpose, Lange suggested choos-ing a classifier uschoos-ing the same clusterchoos-ing method’s grouping principle [8]. Therefore, K-nearest-means classifier was used when K-means and Ward’s methods were assessed whereas the K-nearest-medians classifier was used for the K-medians algorithm. Moreover, as a sensitivity analysis for assessing the impact of the stabil-ity indices used, others measures, namely Cramer’s V and Adjusted Rand index (ARI) were also computed. Contrary to the misclassification rate, higher values on Cramer’s V and ARI indicate higher stability.
Description of dietary patterns
procedure PROC FASTCLUS.P-values < 0.05 were con-sidered as significant.
Comparison with PCA-DP
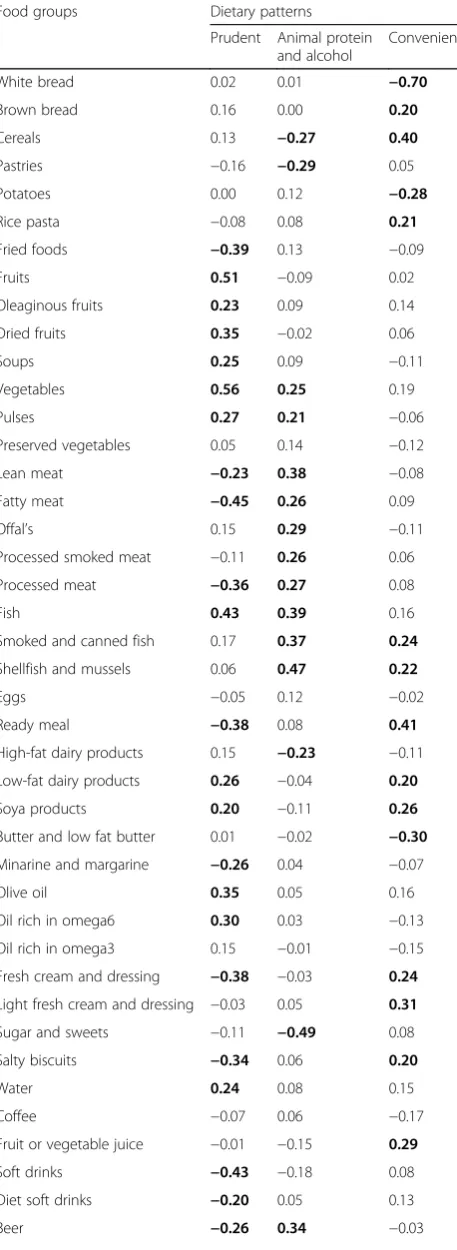
Continuous dietary patterns were also computed with PCA method. PCA-DP scores were calculated as a sum of the food intake variables weighted by the loadings generated by the method. Food groups with absolute loadings values superior to 0.2 were considered as contributing highly to the pattern [2]. According to the elbow method, three dietary patterns were selected. Both methods PCA and cluster analysis were compared by comparing means of PCA-DP across clusters with the Kruskal-Wallis test.
Results
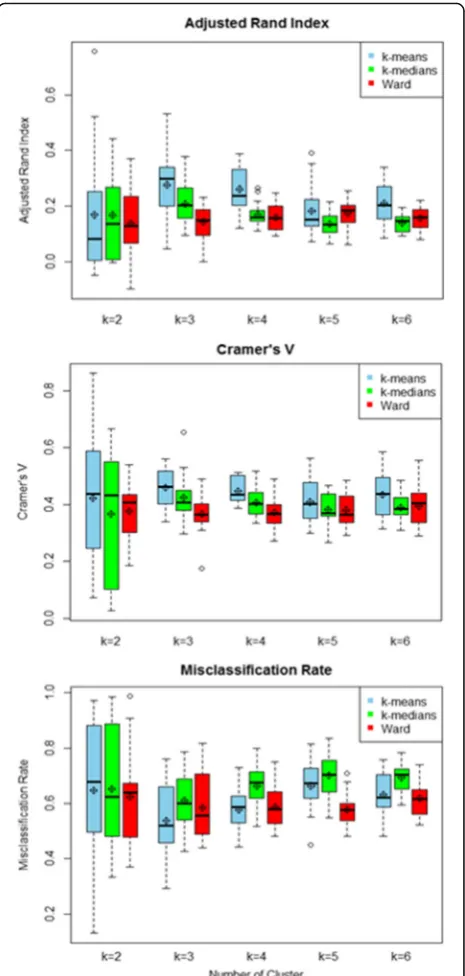
Choice of clustering method and number of clusters Figure 1 presents the distribution of the three stability in-dices across clustering methods and number of clusters. Distributions were described with box-plots and average values computed on 20 repetitions of the algorithm. Re-gardless of stability indices and number of clusters, more stable solutions were obtained with K-means. In addition, the most stable solution was obtained with 3 clusters. Therefore, dietary patterns were computed with K-means algorithm and a predefined number of clusters equal to three.
Dietary patterns
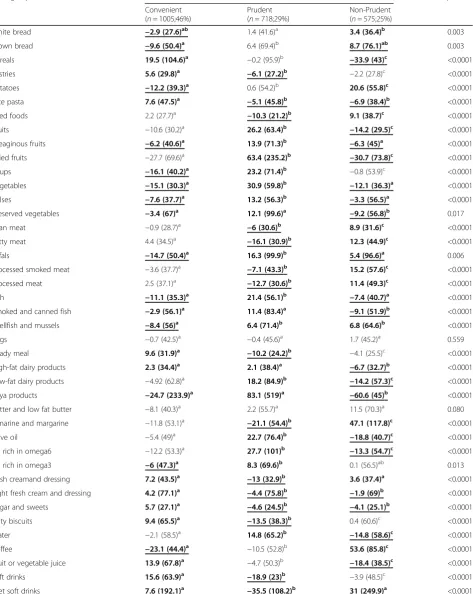
The description of each cluster is given in Table 1. Clusters were described with mean of daily food intakes relative to corresponding overall mean intake. The clus-ter labelled “Prudent” was characterized by high in-takes of brown bread, fruits, oleaginous fruits, dried fruits, soups, vegetables, pulses, preserved vegetables, offal, fish, smoked and canned fish, shellfish and mussels, dairy products, soya products, olive oil, oil-rich in omega 3 or 6, water and tea. In contrast, individuals in this clus-ter had low intakes of white bread, pastries, rice and pasta, fried foods, lean and fatty meat, processed smoked meat, processed meat, ready meals, minarine and margarine, fresh cream and dressing, sugar and sweets, salty biscuits, soft drinks, diet soft drinks, beer and aperitifs and spirits. Concerning the“Non-Prudent”cluster, individuals in this cluster consumed less cereals, rice/pasta, fruits, oleaginous fruits, dried fruits, vegetables, pulses, preserved vegeta-bles, fish, smoked and canned fish, dairy products, soya products, olive oil and oil-rich in omega 3 or 6, light fresh cream and dressings, sugar and sweets, water, fruit or vegetable juice and tea. In contrast, the “ Non-Prudent” cluster had high intakes of white bread, pota-toes, fried foods, lean and fatty meat, offal, processed meat, shellfish and mussels, minarine and margarine, fresh cream and dressings, coffee, diet soft drinks, beer
and wine. Finally, the“Convenient”cluster was charac-terized by consumption of convenient fast foods that require little preparation like cereals, pastries, rice and pasta, preserved vegetables, smoked and canned fish, ready meals, high-fat dairy products, soya products, fresh cream and dressings, sugar and sweets, salty bis-cuits, fruit or vegetable juice, soft drinks and aperitifs and spirits. In contrast, individuals in this cluster had low consumption of brown bread, potatoes, oleaginous
Table 1Description of clusters according to daily food intakes relative to corresponding overall mean intake (Mean (SD))
Food groups Clusters p-value
Convenient (n= 1005;46%)
Prudent (n= 718;29%)
Non-Prudent (n= 575;25%)
White bread −2.9 (27.6)ab 1.4 (41.6)a 3.4 (36.4)b 0.003
Brown bread −9.6 (50.4)a 6.4 (69.4)b 8.7 (76.1)ab 0.003
Cereals 19.5 (104.6)a −0.2 (95.9)b −33.9 (43)c <0.0001
Pastries 5.6 (29.8)a −6.1 (27.2)b −2.2 (27.8)c <0.0001
Potatoes −12.2 (39.3)a 0.6 (54.2)b 20.6 (55.8)c <0.0001
Rice pasta 7.6 (47.5)a −5.1 (45.8)b −6.9 (38.4)b <0.0001
Fried foods 2.2 (27.7)a −10.3 (21.2)b 9.1 (38.7)c <0.0001
Fruits −10.6 (30.2)a 26.2 (63.4)b −14.2 (29.5)c <0.0001
Oleaginous fruits −6.2 (40.6)a 13.9 (71.3)b −6.3 (45)a <0.0001
Dried fruits −27.7 (69.6)a 63.4 (235.2)b −30.7 (73.8)c <0.0001
Soups −16.1 (40.2)a 23.2 (71.4)b −0.8 (53.9)c <0.0001
Vegetables −15.1 (30.3)a 30.9 (59.8)b −12.1 (36.3)a <0.0001
Pulses −7.6 (37.7)a 13.2 (56.3)b −3.3 (56.5)a <0.0001
Preserved vegetables −3.4 (67)a 12.1 (99.6)a −9.2 (56.8)b 0.017
Lean meat −0.9 (28.7)a −6 (30.6)b 8.9 (31.6)c <0.0001
Fatty meat 4.4 (34.5)a −16.1 (30.9)b 12.3 (44.9)c <0.0001
Offals −14.7 (50.4)a 16.3 (99.9)b 5.4 (96.6)a 0.006
Processed smoked meat −3.6 (37.7)a −7.1 (43.3)b 15.2 (57.6)c <0.0001
Processed meat 2.5 (37.1)a −12.7 (30.6)b 11.4 (49.3)c <0.0001
Fish −11.1 (35.3)a 21.4 (56.1)b −7.4 (40.7)a <0.0001
Smoked and canned fish −2.9 (56.1)a 11.4 (83.4)a −9.1 (51.9)b <0.0001
Shellfish and mussels −8.4 (56)a 6.4 (71.4)b 6.8 (64.6)b <0.0001
Eggs −0.7 (42.5)a −0.4 (45.6)a 1.7 (45.2)a 0.559
Ready meal 9.6 (31.9)a −10.2 (24.2)b −4.1 (25.5)c <0.0001
High-fat dairy products 2.3 (34.4)a 2.1 (38.4)a −6.7 (32.7)b <0.0001
Low-fat dairy products −4.92 (62.8)a 18.2 (84.9)b −14.2 (57.3)c <0.0001
Soya products −24.7 (233.9)a 83.1 (519)a −60.6 (45)b <0.0001
Butter and low fat butter −8.1 (40.3)a 2.2 (55.7)a 11.5 (70.3)a 0.080
Minarine and margarine −11.8 (53.1)a −21.1 (54.4)b 47.1 (117.8)c <0.0001
Olive oil −5.4 (49)a 22.7 (76.4)b −18.8 (40.7)c <0.0001
Oil rich in omega6 −12.2 (53.3)a 27.7 (101)b −13.3 (54.7)c <0.0001
Oil rich in omega3 −6 (47.3)a 8.3 (69.6)b 0.1 (56.5)ab 0.013
fresh creamand dressing 7.2 (43.5)a −13 (32.9)b 3.6 (37.4)a <0.0001
Light fresh cream and dressing 4.2 (77.1)a −4.4 (75.8)b −1.9 (69)b <0.0001
Sugar and sweets 5.7 (27.1)a −4.6 (24.5)b −4.1 (25.1)b <0.0001
Salty biscuits 9.4 (65.5)a −13.5 (38.3)b 0.4 (60.6)c <0.0001
Water −2.1 (58.5)a 14.8 (65.2)b −14.8 (58.6)c <0.0001
Coffee −23.1 (44.4)a −10.5 (52.8)b 53.6 (85.8)c <0.0001
Fruit or vegetable juice 13.9 (67.8)a −4.7 (50.3)b −18.4 (38.5)c <0.0001
Soft drinks 15.6 (63.9)a −18.9 (23)b −3.9 (48.5)c <0.0001
fruits, soups, vegetables, pulses, offal, fish, shellfish and mussels, oil-rich in omega 3, coffee and wine.
The distribution of dietary patterns is also described in Table 1. The “Convenient” pattern was the most preva-lent with 46% of the population assigned to this cluster. The remaining two clusters were smaller with 25% and 29% of the population belonging respectively to the “Non-Prudent”and“Prudent”cluster.
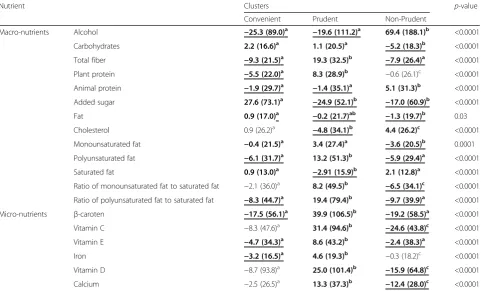
The description of dietary patterns according to nutri-ent intake is presnutri-ented in Table 2.“Prudent”cluster was characterized by high intakes of all micronutrients, carbohydrates, total fiber and plant protein. In contrast, this cluster was associated with low intakes of alcohol, animal protein, added sugar and dietary cholesterol. Concerning fat profile, individuals in this cluster have higher MUFA: SFA (Ratio of monounsaturated fat to
saturated fat) and PUFA: SFA (Ratio of polyunsaturated fat to saturated fat). On the opposite, “Non-Prudent” cluster had the highest intakes of alcohol, animal pro-tein, and dietary cholesterol. It was also characterized by low intakes of carbohydrates, total fibre, added sugar, fat and all micronutrients and low MUFA: SFA and PUFA: SFA ratios. The “Convenient” pattern was associated with high intakes of carbohydrates, added sugar and fat and low intakes of alcohol, total fiber, plant and animal protein,β-carotene, vitamin E and iron.
Association of DP with sociodemographic and lifestyle characteristics
The associations of DP with sociodemographic and lifestyle characteristics are shown in Table 3. “Non-Prudent” and “Convenient” clusters were compared to the “Prudent”
Table 1Description of clusters according to daily food intakes relative to corresponding overall mean intake (Mean (SD))
(Continued)
Beer −4.6 (35.8)a −12.6 (28.5)b 23.8 (82.7)c <0.0001
Wine −19.7 (54.6)a −2.9 (80.6)b 38.1 (134.9)c <0.0001
Aperitifs and spirits −2.6 (41.5)a −3.5 (52.5)b 8.9 (63.2)a <0.0001
Tea −53.6 (93.3)a 135.2 (259.2)b −75.2 (68)c <0.0001
Legend:abc
Means with same letters are not significantly different from each other; means that are inboldface are highest; means that areunderlined and bold are lowest
Table 2Description of clusters according to nutrient intakes relative to corresponding overall mean intake (Mean (SD))
Nutrient Clusters p-value
Convenient Prudent Non-Prudent
Macro-nutrients Alcohol −25.3 (89.0)a −19.6 (111.2)a 69.4 (188.1)b <0.0001
Carbohydrates 2.2 (16.6)a 1.1 (20.5)a −5.2 (18.3)b <0.0001
Total fiber −9.3 (21.5)a 19.3 (32.5)b −7.9 (26.4)a <0.0001
Plant protein −5.5 (22.0)a 8.3 (28.9)b −0.6 (26.1)c <0.0001
Animal protein −1.9 (29.7)a −1.4 (35.1)a 5.1 (31.3)b <0.0001
Added sugar 27.6 (73.1)a −24.9 (52.1)b −17.0 (60.9)b <0.0001
Fat 0.9 (17.0)a −0.2 (21.7)ab −1.3 (19.7)b 0.03
Cholesterol 0.9 (26.2)a −4.8 (34.1)b 4.4 (26.2)c <0.0001
Monounsaturated fat −0.4 (21.5)a 3.4 (27.4)a −3.6 (20.5)b 0.0001
Polyunsaturated fat −6.1 (31.7)a 13.2 (51.3)b −5.9 (29.4)a <0.0001
Saturated fat 0.9 (13.0)a −2.91 (15.9)b 2.1 (12.8)a <0.0001
Ratio of monounsaturated fat to saturated fat −2.1 (36.0)a 8.2 (49.5)b −6.5 (34.1)c <0.0001
Ratio of polyunsaturated fat to saturated fat −8.3 (44.7)a 19.4 (79.4)b −9.7 (39.9)a <0.0001
Micro-nutrients β-caroten −17.5 (56.1)a 39.9 (106.5)b −19.2 (58.5)a <0.0001
Vitamin C −8.3 (47.6)a 31.4 (94.6)b −24.6 (43.8)c <0.0001
Vitamin E −4.7 (34.3)a 8.6 (43.2)b −2.4 (38.3)a <0.0001
Iron −3.2 (16.5)a 4.6 (19.3)b −0.3 (18.2)c <0.0001
Vitamin D −8.7 (93.8)a 25.0 (101.4)b −15.9 (64.8)c <0.0001
Calcium −2.5 (26.5)a 13.3 (37.3)b −12.4 (28.0)c <0.0001
abc
Means with same letters are not significantly different from each other; means that are inboldface arehighest; means that areunderlined and bold
cluster which was considered as the reference. Older sub-jects were less likely to adopt a“Convenient”pattern (OR = 0.92 [0.91; 0.93]). Indeed, individuals in the“Convenient” cluster were much younger (36.9 years) than those in the “Prudent” (49.3 years) and “Non-Prudent” (48.9 years) cluster. Men were also more likely to adopt a“Convenient” (OR = 2.2 [1.6; 3.1]) or“Non-Prudent”(OR = 4.2 [2.9; 5.9]) patterns rather than a“Prudent”one. Likewise, individuals with less education were also more likely to adopt a“ Non-Prudent” pattern. Concerning the region, compared to Lorraine, individuals living in Luxembourg were more likely to adopt a “Convenient” (OR = 1.7 [1.2; 2.4]) or a “Non-Prudent”(OR = 2.1 [1.3; 3.4]) pattern. The difference was even larger when comparing with individuals living Wallonia with a net preference for the “Non-Prudent” (OR = 7.1 [4.5; 11.4]) and“Convenient”(OR = 2.7 [1.8; 3.9]) pattern. In details, 41% of individuals living in Lorraine adopted a “Prudent” pattern whereas they were only 28.7% in Luxembourg and 19.1% in Wallonia. On the opposite, only 14% of individuals in Lorraine adopted a “Non-Prudent” pattern whereas they were 19.9% in Luxembourg and 36.7% in Wallonia. Concerning life-style factors, smokers were more likely to adopt a “Non-Prudent” (OR = 3 [1.9; 4.7]) pattern. Regarding physical activity, individual in the“Convenient” cluster
were engaged in significantly less physical activity (OR = 0.993 [0.988; 0.998]).
Association of DP with CVRF
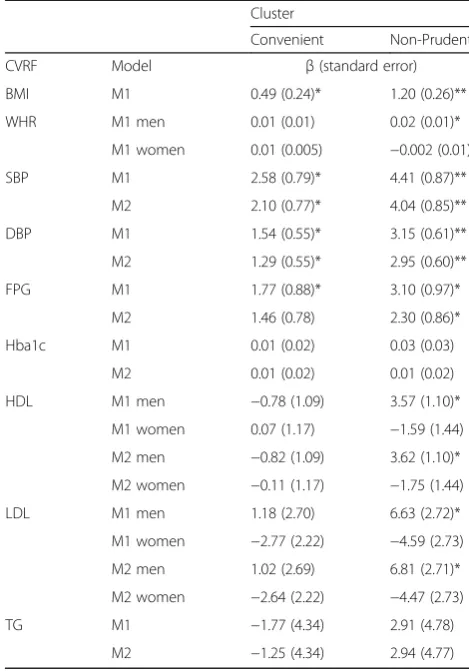
Multivariate-adjusted β-coefficients for CVRF according to DP are displayed in Table 4. Compared to the“Prudent” pattern, higher BMI was noticed in individuals who adopted the“Convenient”and the“Non-Prudent” pattern whereas higher WHR was only observed in men having adopted the “Non-Prudent” pattern. “Non-Prudent” and “Convenient” patterns also showed higher SBP and DBP values. Concerning diabetes, “Convenient” and especially “Non-Prudent”patterns were significantly associated with higher FPG but not HbA1c. Regarding cholesterol levels, “Non-Prudent” cluster was associated with higher LDL and HDL in men only. Further adjustment of treatment did not change the results.
Comparison of dietary patterns obtained with PCA and K-means
Continuous dietary patterns were computed using the PCA method. According to the scree-plot, three dietary patterns were selected. The percentage of variance ex-plained and loadings of food groups on DP are presented in Table 5. The three PCA-patterns accounted for 7.1%
Table 3Associations of clusters with sociodemographic and lifestyle characteristics (Mean(SD); Percentage) and odds-ratios)
Sociodemographic and lifestyle characteristics
Cluster p-value Odds ratio
Convenient Prudent Non-Prudent Convenient vs
Prudent
Non-Prudent vs Prudent
Age (years) (n= 2298) 36.9 (0.3)a 49.3 (0.5)b 48.9 (0.6)c <0.0001 0.92 [0.91;0.93] 1.00 [0.98;1.01] Energy expenditure
per week (MET/100)
(n= 2298) 29.2 (1.21)ac 33.6 (1.8)b 32.4(1.6)c 0.0075 0.993 [0.988;0.998] 0.996 [0.99;1.002]
Gender (%) Men
(n= 1158)
52.2% 35.9% 66.0% <0.0001 2.2 [1.6;3.1] 4.2 [2.9;5.9]
Women (n= 1140)
47.9% 64.1% 34.0% Reference
Educational level (%) Primary (n= 331)
7.2% 10.1% 10.5% <0.0001 1.3 [0.9;2.1] 2.9 [1.4;3.8]
Secondary (n= 1127)
46.4% 42.8% 57.6% 1.9 [1.4;2.7] 2.5 [1.7;3.7]
Tertiary (n= 818)
46.4% 41.1% 32.0% Reference
Smokers (%) Smokers
(n= 484)
21.6% 15.3% 36.9% <0.0001 1 [0.6;1.6] 3 [1.9;4.7]
Non smokers (n = 1814)
78.4% 84.7% 63.1% Reference
Region (%) Luxembourg
(n= 1071)
26.3% 23.0% 19.1% <0.0001 1.7 [1.2;2.4] 2.1 [1.3;3.4]
Wallonia (n= 750)
38.3% 26.0% 60.0% 2.7 [1.8;3.9] 7.1 [4.5;11.4]
Lorraine (n= 477)
35.5% 50.9% 20.9% Reference
Legend:abc
Means with same letters are not significantly different from each other; figures that are inboldface arehighest; figures that areunderlined and
(3.1%, 2.1% and 1.9% respectively) of the total variance in food intakes. The first pattern was labelled “Prudent” as it was characterized by high intakes of fruits, oleagin-ous and dried fruits, soups, vegetables, pulses, fish, low-fat dairy products, soya products, olive oil, oil-rich in omega 6, water and tea and low intakes of fried foods, lean and fatty meat, processed meat, ready meals, minar-ine and margarminar-ine, fresh cream and dressing, salty bis-cuits, soft drinks, diet soft drinks and beer. The second PCA-pattern was named “Animal protein and alcohol” since it was positively associated with vegetables, pulses, all kinds of meat and fish and alcohol beverages and negatively associated with sugar and sweets, high-fat dairy products, pastries and cereals. The third pattern was labelled“Convenient”since this pattern was positively correlated with convenient foods that require little prepar-ation like brown bread, cereals, rice, pasta, smoked and canned fish, shellfish and mussels, ready meals, low-fat dairy products, soya products, fresh cream and dressings,
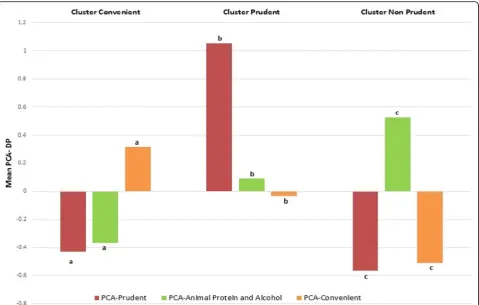
salty biscuits, fruit or vegetable juice. Moreover, it was also negatively correlated with white bread, potatoes and but-ter. Comparison of dietary patterns obtained through PCA and K-means are shown in Fig. 2. The three clusters were similar to the three continuous dietary patterns obtained through PCA. Indeed, the PCA-Prudent DP was highest in the “Prudent” cluster, the PCA-animal protein and alcohol DP was highest in the “Non-Prudent” cluster and the PCA-convenient DP was highest in the“Convenient”cluster.
Discussion
The main objective of this study was to test a method allowing the objective selection of the most appropriate model among different clustering methods and numbers of clusters in the field of “dietary pattern analysis.” The idea was to assess stability of different clustering solutions and choose the most stable solution as the most appropri-ate for describing the data. According to this method, three dietary patterns obtained with K-means algorithm were obtained. The “Non-Prudent” and “Convenient” patterns associated respectively with non-healthy food choices and convenient foods were both associated with a higher cardiovascular risk compared to the “Prudent” cluster characterized by healthier dietary habits and lower cardiovascular risk.
Among the clustering method considered in this art-icle, K-means clearly showed more stable solutions re-gardless of the number of clusters. However, it is highly likely that other more sophisticated methods would have been more appropriate [3]. Indeed, clustering methods considered in this study were really simple and others methods with higher flexibility regarding cluster’s char-acteristics are more likely to identify real complex struc-ture. In addition, although K-means was found as the most appropriate method for describing dietary patterns in adults living in the Greater region, it may not be the case with other datasets. Indeed, group structures from other populations are likely to be different. Therefore, this should be explored in additional datasets across dif-ferent populations.
In the field of dietary pattern analysis, we are aware of only two studies comparing different clustering methods. Like us, Lo Siou et al. assessed stability of solutions obtained with different clustering methods and number of clusters and also showed that K-means was the most appropriate method [3]. Contrary to our results, stability decreased with the number of clusters and therefore they were not able to identify an optimal number of clusters with this method. In addition, as proposed by Lange [8], the authors also used a classifier to transfer the solution obtained on one sample to another. However, the classifier should use the same clustering method’s grouping principle. In accordance with Lange,
Table 4Association of clusters with cardiovascular risk factors (β-coefficients (Standard error) of cluster on CVRF)
Cluster
Convenient Non-Prudent
CVRF Model β(standard error)
BMI M1 0.49 (0.24)* 1.20 (0.26)**
WHR M1 men 0.01 (0.01) 0.02 (0.01)*
M1 women 0.01 (0.005) −0.002 (0.01)
SBP M1 2.58 (0.79)* 4.41 (0.87)**
M2 2.10 (0.77)* 4.04 (0.85)**
DBP M1 1.54 (0.55)* 3.15 (0.61)**
M2 1.29 (0.55)* 2.95 (0.60)**
FPG M1 1.77 (0.88)* 3.10 (0.97)*
M2 1.46 (0.78) 2.30 (0.86)*
Hba1c M1 0.01 (0.02) 0.03 (0.03)
M2 0.01 (0.02) 0.01 (0.02)
HDL M1 men −0.78 (1.09) 3.57 (1.10)*
M1 women 0.07 (1.17) −1.59 (1.44)
M2 men −0.82 (1.09) 3.62 (1.10)*
M2 women −0.11 (1.17) −1.75 (1.44)
LDL M1 men 1.18 (2.70) 6.63 (2.72)*
M1 women −2.77 (2.22) −4.59 (2.73)
M2 men 1.02 (2.69) 6.81 (2.71)*
M2 women −2.64 (2.22) −4.47 (2.73)
TG M1 −1.77 (4.34) 2.91 (4.78)
M2 −1.25 (4.34) 2.94 (4.77)
Prudent cluster is the reference category
M1 : adjusted on gender, age, educational level, smoking status, physical activity
M2 : M1 + treatment for the studied CVRF *p< 0.05
we used the nearest-means classifier for K-means and Ward’s method and the nearest-medians classifier for K-medians. However, Lo Siou et al. used the nearest-neighbour classifier for K-means and Ward’s method. In order to assess the effect of using a not optimal classifier, we compared stability indices computed on our data with optimal classifiers and the not optimal nearest-neighbour classifier. All stability indices were lower when the not optimal nearest-neighbour classifier was used (see Additional file 2: Figure S2). Therefore, stability values computed in the paper of Lo Siou et al. may have been underestimated.
In another study, Greve et al. use an inappropriate manner for choosing the optimal number of clusters [19]. Indeed, they selected as the optimal number of cluster the number maximizing the agreement between different clustering methods. However, agreement be-tween methods is conditioned by the capability of methods to identify cluster’s structure. Indeed, if a method is not able to distinguish clusters, it will never agree with another method even for the correct number of clusters. Therefore, although it is reassuring to have good agreement between solutions obtained with differ-ent algorithms, agreemdiffer-ent should not be used for choosing the optimal number of clusters.
Comparison with others studies
In accordance with the literature [2, 20], we also derived a “Prudent” dietary pattern characterized by plenty of plant foods and fish and a preference for vegetable oils and low-fat dairy products. In contrast, similar to Western DP de-scribed in others studies [2, 20], we also derived a “ Non-Prudent” pattern characterized by intakes of red and processed meats, high fat content foods, refined grains, soft drinks and alcoholic beverages [21, 22]. However, contrary to most Western-DP described in the literature [2, 20], our “Non-Prudent” pattern was not associated with intakes of sweets and sugar.
Similar to some studies [4, 23, 24], we also found a cluster characterized by consumption of convenient fast foods. It showed high intakes of convenient unhealthy foods like pastries, ready meals, high-fat dairy products, fresh cream and dressings, sugar and sweets, salty bis-cuits, soft drinks and aperitifs and spirits. However, it was also characterized by high intakes of convenient
Table 5Factor loadings and explained variation of dietary patterns obtained with PCA
Food groups Dietary patterns
Prudent Animal protein and alcohol
Convenient
White bread 0.02 0.01 −0.70
Brown bread 0.16 0.00 0.20
Cereals 0.13 −0.27 0.40
Pastries −0.16 −0.29 0.05
Potatoes 0.00 0.12 −0.28
Rice pasta −0.08 0.08 0.21
Fried foods −0.39 0.13 −0.09
Fruits 0.51 −0.09 0.02
Oleaginous fruits 0.23 0.09 0.14
Dried fruits 0.35 −0.02 0.06
Soups 0.25 0.09 −0.11
Vegetables 0.56 0.25 0.19
Pulses 0.27 0.21 −0.06
Preserved vegetables 0.05 0.14 −0.12
Lean meat −0.23 0.38 −0.08
Fatty meat −0.45 0.26 0.09
Offal’s 0.15 0.29 −0.11
Processed smoked meat −0.11 0.26 0.06
Processed meat −0.36 0.27 0.08
Fish 0.43 0.39 0.16
Smoked and canned fish 0.17 0.37 0.24
Shellfish and mussels 0.06 0.47 0.22
Eggs −0.05 0.12 −0.02
Ready meal −0.38 0.08 0.41
High-fat dairy products 0.15 −0.23 −0.11
Low-fat dairy products 0.26 −0.04 0.20
Soya products 0.20 −0.11 0.26
Butter and low fat butter 0.01 −0.02 −0.30 Minarine and margarine −0.26 0.04 −0.07
Olive oil 0.35 0.05 0.16
Oil rich in omega6 0.30 0.03 −0.13
Oil rich in omega3 0.15 −0.01 −0.15
Fresh cream and dressing −0.38 −0.03 0.24 Light fresh cream and dressing −0.03 0.05 0.31
Sugar and sweets −0.11 −0.49 0.08
Salty biscuits −0.34 0.06 0.20
Water 0.24 0.08 0.15
Coffee −0.07 0.06 −0.17
Fruit or vegetable juice −0.01 −0.15 0.29
Soft drinks −0.43 −0.18 0.08
Diet soft drinks −0.20 0.05 0.13
Beer −0.26 0.34 −0.03
Table 5Factor loadings and explained variation of dietary patterns obtained with PCA(Continued)
Wine 0.03 0.38 −0.07
Aperitifs and spirits −0.15 0.34 −0.09
Tea 0.36 −0.10 −0.02
Explained variation in food groups, %
3.1% 2.1% 1.9%
healthy foods like cereals, preserved vegetables, smoked and canned fish, soya products, fruit or vegetable juice. Regarding nutrients, this pattern was associated with high intakes of carbohydrates, added sugar and fat.
The size of DP showed that the “Convenient” pattern was the most prevalent with 46% of the population assigned to this cluster. The“Prudent”and“Non-Prudent” patterns were adopted by 29% and 25% of the population respectively. However, striking differences were noticed across regions. Although, the “Convenient” pattern was the most adopted in all regions, the“Prudent”pattern was more frequent in Lorraine (41%) than in Luxembourg (28.7%) and Wallonia (19.1%). In sum, only a small part of the population has healthy dietary habits and this part is even smaller in Luxembourg and Wallonia. The adoption of a “Convenient” pattern may be due to the fact that people have less and less time for preparing and cooking foods and thus choose to consume prepared foods.
In line with others studies, we also found significant as-sociations between dietary patterns and sociodemographic and lifestyle characteristics. We found that the“ Conveni-ent” pattern was more likely to be adopted by men and younger people [23]. Since the Luxembourg population is made up of more young active working people, this might explain the larger size of the “Convenient” cluster in
Luxembourg compared to Wallonia and Lorraine [25]. In addition, as also shown by other studies [4], women and individuals with higher education were more likely to adopt a “Prudent” pattern. Moreover, in accordance with others studies [2, 4], we also found that people who choose unhealthy dietary habits are less likely to be engaged in healthy behaviours like doing physical activities and not smoking. It shows that the choice of a dietary pattern is in fact part of a larger pattern of lifestyle.
cholesterol metabolism [2, 30, 31]. Moreover, the genetic variation in lipoprotein metabolism may also have an effect [32].
Comparison between PCA and cluster analysis
Despite clear differences in approaches and interpretation, PCA and cluster analysis gave similar results. A“Prudent” DP was identified with both methods. Indeed, a“Prudent” and“Non-Prudent”cluster with respectively high and low values on PCA-Prudent DP were found. Likewise, a con-venient cluster was made of individuals with high values on PCA-convenient DP. Concerning PCA-Animal protein and alcohol pattern, we did not observe a cluster of indi-viduals with only high intakes of meat, fish and alcohol. However, since this DP is characterized by high intakes of foods (meat and alcohol) usually consumed in a “ Non-Prudent” pattern, it was significantly higher in the“ Non-Prudent” cluster. Those results are in line with others studies, which also found differences in mean PCA-DP across clusters [33–35].
Although results between both methods were similar, they describe diet in different ways. Indeed, PCA aims to determine DP explaining variation in a set of food groups whereas cluster analysis aims to identify groups of people with different food intakes. Moreover, the format of DP is also different. An individual’s dietary pattern is described through his/her membership to a group in cluster analysis whereas in PCA-DP the sub-ject is described with his/her scores on all computed DP. Therefore, the choice of a method depends on both the desired format of the outcome but also hypothesis and aims of the study. Advantages of PCA are that it may be easier to perform as it requires less subjective researchers’ decisions. However, findings from cluster analysis are easier to interpret because an individual is assigned to one cluster only whereas PCA-DP do not refer to identifiable groups within the population, and hence do not give an indication of the prevalence of a particular type of diet [35]. On the other hand, continu-ous factors determined by PCA may be advantagecontinu-ous when relationships between DP and others variables are assessed since a gradient is formed between individuals with low, medium or high values on factors. Moreover, they do not require the use of a reference category [26]. As other authors have suggested, unless the choice of one method is justified, it is advisable to use both factor and cluster analysis in order have complementary in-sights [36].
Strength and limitations
The main strength of this study was the use of an ob-jective procedure to select the most appropriate cluster-ing method and number of clusters. Compared to other internal validity indices, the stability measure has the
advantage to be model free and not being optimized by any clustering method. Moreover, comparison of cluster solution and PCA-derived factors were also made. Further, this study used a recent and homogeneous design of data collection including three large randomly selected samples from three neighbour regions. Short-comings of this study were that considered clustering methods were all heuristic-based and make basic as-sumptions on group structure. The reason is that since the main objective of this study was to test the object-ive procedure, we decided to limit its application to traditional clustering methods used in the field of diet-ary pattern analysis [2]. Therefore, we will also consider more sophisticated methods in the future. In addition, although the method allows distinguishing between stable and spurious clustering solutions, stability is not the only aspect of a good solution. Indeed, a stable clustering solution may still be meaningless if it does not discriminate useful subset of the overall data [37]. However, unstable solutions should not be interpreted and thus stability is an indispensable requirement [37]. For this reason, the interpretation and criticism of the clustering solution by the researcher and comparison with results obtained with PCA are still important. In addition, many others subjective decisions have still been made that are likely to influence the final solution, namely the pooling of different food items into specific food groups, the quantification of the input variables, the adjustment for total energy intake and the method of standardization. However, the robustness of the chosen solution and the consistency of the results with PCA-DP gave confidence in our results. Other limita-tions are the cross-sectional design of the study and the probable measurement error linked with the FFQ. Finally, although we identified dietary pattern associ-ated with disease risk, we still do not know if this effect comes from certain component only or is the product of the addition or interaction of several food groups.
Conclusion
Additional files
Additional file 1: Figure S1.Flowchart of participants who met inclusion criteria (PNG 46 kb)
Additional file 2: Figure S2.Distribution of stability indexes across clustering methods and number of clusters by type of classifier (PNG 138 kb)
Abbreviations
ARI:Adjusted rand index; BMI: Body mass index; CA: Cluster analysis; CVRF: Cardiovascular risk factors; DBP: Diastolic blood pressure; DP: Dietary patterns; FFQ: Food frequency questionnaire; FPG: Fasting plasma glucose; HbA1c: Glycated hemoglobin; HDL: plasma high density cholesterol; LDL: Plasma low density cholesterol; MUFA: Monounsaturated fat; OR: Odds-ratio; PCA: Principal component analysis; PUFA: Polyunsaturated fat; RRR: Reduced rank regression; SBP: Systolic blood pressure; SD: Standard deviation; SFA: Saturated fat; TC: Plasma total cholesterol; TG: Triglycerides; WHR: Waist to hip ratio
Acknowledgements
The cross-border NESCAV project is supported by INTERREG IV A program “Greater Region”, 2007–2013, which aims to stimulate inter-regional cooperation. The four regions receive a co-funding from the European Regional Development Fund (ERDF), in addition to their own or public health authorities financial support.
Funding
European Regional Development Fund : The funder had no role in study design, data collection and analysis, decision to publish, or preparation of the manuscript. National Fund of Research of Luxembourg : The funder had no role in study design, data collection and analysis, decision to publish, or preparation of the manuscript.
Availability of data and materials
The data that support the findings of this study cannot be made publicly available for ethical and legal reasons. In fact, we are not authorized to share our NESCaV dataset with external researchers, as this condition had not been requested in the informed consent signed by the participants in 2007–2011. In addition, the NESCaV project is an interregional study that has been run in three different neighbor regions (Wallonia, Lorraine and Luxembourg). The current collaboration convention does not allow sharing the data with another party. However, any aggregated data in tables can be provided in case of request.
Authors’contributions
NS, SL, AS, SS, AH, MG, AFD, AAlbert defined the methodology of this study. NS, SL, AS performed the statistical analysis. NS wrote the original draft. NS, SL, AAlkerwi, AS, FZ, SS, AFD, AAlbert, MG reviewed the draft. All authors read and approved the final manuscript.
Competing interests
The authors declare no conflict of interest.
Consent for publication
Not applicable.
Ethics approval and consent to participate
The protocol of the study was approved by the following institutional review boards: Comité National d’Ethique de Recherche (Grand-Duchy of
Luxembourg), Comité de Protection des Personnes Est-III (Lorraine), Comité d’Ethique Hospitalo-Facultaire Universitaire de Liège (Wallonia) and Ethik-Kommission Ärztekammer des Saarlandes (Saarland) [9]. All participants pro-vided written informed consent.
Author details
1Luxembourg Institute of Health (LIH), CCMS (Competence center in
methodology and statistics), 1A rue Thomas Edison, L-1445 Strassen, Luxembourg.2Ministry of Health, Luxembourg, Service épidémiologie & statistique, Allée Marconi, Villa Louvigny, L-2120 Luxembourg city, Luxembourg.3Département des maladies cardiovasculaires, Hypertension
Unit, Centre Hospitalier Universitaire, 5, Rue du Morvan, 54500
Vandœuvre-lès-Nancy, France.4Ecole de Santé Publique, Université de Liège,
7, Place du 20 Août, 4000 Liège, Belgium.
Received: 11 August 2016 Accepted: 3 January 2017
References
1. Kim J, et al. Dietary patterns derived by cluster analysis are associated with cognitive function among Korean older adults. Nutrients. 2015;7(6):4154–69. 2. Newby PK, Tucker KL. Empirically derived eating patterns using factor or
cluster analysis: a review. Nutr Rev. 2004;62(5):177–203.
3. Lo Siou G, et al. Exploring statistical approaches to diminish subjectivity of cluster analysis to derive dietary patterns: the tomorrow project. Am J Epidemiol. 2011;173(8):956–67.
4. Berg CM, et al. Food patterns and cardiovascular disease risk factors: the Swedish INTERGENE research program. Am J Clin Nutr. 2008;88(2):289–97. 5. Anderson AL, et al. Relationships of dietary patterns with body composition
in older adults differ by gender and PPAR-gamma Pro12Ala genotype. Eur J Nutr. 2010;49(7):385–94.
6. Michels KB, Schulze MB. Can dietary patterns help us detect diet-disease associations? Nutr Res Rev. 2005;18(2):241–8.
7. Thorpe MG, et al. A comparison of the dietary patterns derived by principal component analysis and cluster analysis in older Australians. Int J Behav Nutr Phys Act. 2016;13(1):30.
8. Lange T, et al. Stability-based validation of clustering solutions. Neural Comput. 2004;16(6):1299–323.
9. Alkerwi A, et al. Nutrition, environment and cardiovascular health (NESCAV): protocol of an inter-regional cross-sectional study. BMC Public Health. 2010;10:698.
10. Alkerwi A, et al. Comparison of participants and non-participants to the ORISCAV-LUX population-based study on cardiovascular risk factors in Luxembourg. BMC Med Res Methodol. 2010;10:80.
11. Alkerwi A, et al. First nationwide survey on cardiovascular risk factors in Grand-Duchy of Luxembourg (ORISCAV-LUX). BMC Public Health. 2010;10:468. 12. Sauvageot N, et al. Use of food frequency questionnaire to assess
relationships between dietary habits and cardiovascular risk factors in NESCAV study: validation with biomarkers. Nutr J. 2013;12(1):143. 13. Sauvageot N, et al. Validation of the food frequency questionnaire used to
assess the association between dietary habits and cardiovascular risk factors in the NESCAV study. J Nutr Food Sci. 2013;3(208):2.
14. Sjöström M, B A, Bauman A, et al. Guidelines for data processing and analysis of the International Physical Activity Questionnaire (IPAQ). Stockholm: Karolinka Institute; 2005.
15. Alkerwi A, et al. Adherence to physical activity recommendations and its associated factors: an interregional population-based study. J Public Health Res. 2015;4(1):406.
16. Willett W, Stampfer MJ. Total energy intake: implications for epidemiologic analyses. Am J Epidemiol. 1986;124(1):17–27.
17. Fransen HP, et al. A posteriori dietary patterns: how many patterns to retain? J Nutr. 2014;144(8):1274–82.
18. Gnanadesikan R, Kettenring JR, Tsao SL. Journal of Classification. 1995;12(1): 113–36.
19. Greve B, et al. A comparison of heuristic and model-based clustering methods for dietary pattern analysis. Public Health Nutr. 2016;19(2):255–64. 20. Wirfält E, Drake I, Wallström P. What do review papers conclude about food
and dietary patterns? Food & Nutrition Research. 2013;57. doi:10.3402/fnr. v57i0.20523.
21. Slattery ML, et al. Eating patterns and risk of colon cancer. Am J Epidemiol. 1998;148(1):4–16.
22. Hu FB, et al. Prospective study of major dietary patterns and risk of coronary heart disease in men. Am J Clin Nutr. 2000;72(4):912–21.
23. Barker ME, et al. Dietary behaviours and sociocultural demographics in Northern Ireland. Br J Nutr. 1990;64(2):319–29.
24. Kerver JM, et al. Dietary patterns associated with risk factors for cardiovascular disease in healthy US adults. Am J Clin Nutr. 2003;78(6):1103–10.
25. Region, o.s.d.l.g.r.G., Statistiques en bref 2014. http://www.grande-region.lu/ portal/.
27. Millen BE, et al. Dietary patterns and the odds of carotid atherosclerosis in women: the Framingham Nutrition Studies. Prev Med. 2002;35(6):540–7. 28. Huijbregts PP, Feskens EJ, Kromhout D. Dietary patterns and cardiovascular
risk factors in elderly men: the Zutphen elderly study. Int J Epidemiol. 1995; 24(2):313–20.
29. Tucker KL, Dallal GE, Rush D. Dietary patterns of elderly Boston-area residents defined by cluster analysis. J Am Diet Assoc. 1992;92(12):1487–91. 30. van Dam RM, et al. Patterns of food consumption and risk factors for
cardiovascular disease in the general Dutch population. Am J Clin Nutr. 2003;77(5):1156–63.
31. Vega-Lopez S, et al. Sex and hormonal status influence the effects of psyllium on lipoprotein remodeling and composition. Metabolism. 2002; 51(4):500–7.
32. Masson LF, McNeill G, Avenell A. Genetic variation and the lipid response to dietary intervention: a systematic review. Am J Clin Nutr. 2003;77(5): 1098–111.
33. Newby PK, Muller D, Tucker KL. Associations of empirically derived eating patterns with plasma lipid biomarkers: a comparison of factor and cluster analysis methods. Am J Clin Nutr. 2004;80(3):759–67.
34. Smith AD, et al. A comparison of dietary patterns derived by cluster and principal components analysis in a UK cohort of children. Eur J Clin Nutr. 2011;65(10):1102–9.
35. Hearty AP, Gibney MJ. Dietary patterns in Irish adolescents: a comparison of cluster and principal component analyses. Public Health Nutr. 2013;16(5):848–57. 36. Hoffman K, et al. Dietary patterns: report of an international workshop.
Public Health Nutr. 2002;5(1):89–90.
37. Hennig C. Cluster-wise assessment of cluster stability. Computational Statistics & Data Analysis. 52(1):258–71
• We accept pre-submission inquiries
• Our selector tool helps you to find the most relevant journal
• We provide round the clock customer support
• Convenient online submission
• Thorough peer review
• Inclusion in PubMed and all major indexing services
• Maximum visibility for your research
Submit your manuscript at www.biomedcentral.com/submit