R E S E A R C H
Open Access
Research on power equipment recognition
method based on image processing
Haiyan Wang and Fanwei Meng
*Abstract
Electric energy is an indispensable energy in life, and the power network is the basis to ensure its normal circulation, in which the operation status of power equipment is one of the key factors to determine the safe and stable operation of the power network. In the information age, the traditional manual periodic inspection and the existing method of relying on manual monitoring equipment operation status can no longer meet the needs of safe operation of equipment; relying on computer technology and image recognition technology to achieve automatic identification of power equipment has become a research hot spot. In order to realize automatic identification of power equipment, this paper presents a method of recognition of power equipment based on image processing. Firstly, the power equipment image is preprocessed by various denoising and sharpening algorithms to remove the noise and distortion of the image and improve the image quality; secondly, the SIFT algorithm is used to extract image features, and PCA algorithm is used to reduce the dimension; finally, the support vector machine is used to classify and recognize the image. The simulation results show that the proposed denoising and sharpening algorithms can process images well and improve the quality of images. The support vector machine is used to classify the image features processed by SIFT algorithm and PCA algorithm, and the automatic recognition of power equipment is realized. And the method of power identification based on image processing proposed in this paper has good recognition accuracy.
Keywords:Power equipment, Image processing, SIFT algorithm, PCA algorithm, Support vector machine
1 Introduction
In today’s human society in the twenty-first century,
power plays an increasingly important role. Power supply security is one of the important issues of national strategic energy security. Substation is the junction point of power transmission and distribution. It is a power facility for transforming voltage, receiving and distributing energy, controlling the direction of power flow, and adjusting volt-age. Because the substation is exposed to the outdoor na-ture for a long time, besides the loss of normal mechanical load and electric load, it also needs to be subjected to ex-ternal forces such as dust, dirt, lightning strike, strong wind, rain, ice, snow, bird damage, and so on. Therefore, many factors will promote the aging, fatigue, oxidation, and corrosion of power equipment and components. If not detected and eliminated in time, it may develop into various faults or potential faults, which pose a threat to the safety and stability of power system.
In order to prevent sudden power equipment failures and safety accidents, regular and irregular inspection of important substations and lines is necessary in peace-time. In this way, potential safety hazards can be found in time, and safety accidents can be eliminated in the budding state. Thus, the reliability of power grid oper-ation will be improved.
In recent years, with the rapid growth of the national economy, the in-depth reform of the power system and the in-depth study of science and technology. The
devel-opment of science and technology in China’s electric
power industry has also obtained rare opportunities for high-speed development. All kinds of technologies are ex-tending to the direction of intelligence and automation. Especially, the patrol mode in China’s electric power in-dustry is also changing from manual patrol mode to auto-matic detection and robot patrol mode. For example, by installing data acquisition system [1] on insulation part or relay protection device of high voltage equipment, elec-trical signals of substation equipment can be monitored; remote monitoring of substation main equipment is
© The Author(s). 2019Open AccessThis article is distributed under the terms of the Creative Commons Attribution 4.0 International License (http://creativecommons.org/licenses/by/4.0/), which permits unrestricted use, distribution, and reproduction in any medium, provided you give appropriate credit to the original author(s) and the source, provide a link to the Creative Commons license, and indicate if changes were made.
realized, and the workload of substation operation and maintenance is greatly reduced. At present, although many substations have achieved few or no people on duty, there are still a series of problems caused by no one on-site timely monitoring and patrol, especially in outdoor substa-tions. Therefore, the use of robots in substation inspection has become the trend of substation inspection instead of manual inspection to a certain extent. This is the inevitable stage of transition to smart substation and development to smart grid.
All patrol work of substation equipment can be handed over to the patrol robot of substation equipment. Workers only need remote control or monitor the work of the pa-trol robot, which will greatly reduce the manual workload. Moreover, compared with the routine human inspection, the inspection robot can collect data at any time, any-where and accurately, and timely and accurately discover the abnormal phenomena of power equipment, such as thermal defects, foreign body suspension, etc. This frees people from these onerous inspection tasks in unattended or less manned substations. All kinds of sensors carried by the inspection robot, the operator sets the main task of the inspection in advance, and after the inspection robot accepts the task, it automatically carries out the inspection path planning in the substation. In the prescribed route, the electrical parameters of each device are obtained one by various sensors. For example, the image collection of substation equipment is completed by the camera, and the automatic identification of the equipment instrument is completed. Through infrared sensor, the infrared detec-tion of power equipment is measured, and the electrical information of the equipment is recorded at any time and anywhere, the abnormal parameters are found in time, and the abnormal alarm is provided to the operator. The operator only needs to receive the electrical data which can be grasped and monitored by the mobile robot at any time through the computer in the room. Through this way, the equipment inspection work of the substation can be completed, which has been proved by practice. This method can greatly improve the working efficiency and quality, provide the guarantee for the safe and economical production of the power system, and promote the un-attended process of the substation more quickly. The development of substation inspection robot is a techno-logical revolution in electric power industry, and its eco-nomic and social benefits will be far-reaching [2].
Digital image processing, also known as computer image processing, appeared in the 1950s and formed as a discipline in the early 1960s. The purpose of early image processing is to improve the image quality to im-prove the visual effect. It was first successfully applied in Jet Propulsion Laboratory (JPL) of California Institute of Technology, USA. Lunar photographs were processed to become clearer, which played a driving role in human
lunar exploration project and promoted the develop-ment of digital image processing technology [3, 4]. At present, digital image processing technology has been widely used in communication, transportation, medical, industrial detection, machine vision, military and scien-tific research fields, and has had a significant impact. In the industrial field, accurate and efficient machine vision system is widely used in product detection, assembly, welding, and other processes, which improves the flexi-bility of production and promotes the development of industrial automation level. In the medical field, image has become an important way of disease diagnosis. Mag-netic resonance imaging (MRI), computed tomography (CT), digital subtraction angiography (DSA), and gastro-intestinal endoscopy [5–7] play a key role in assisting doctors in disease diagnosis. Image denoising, segmenta-tion, feature extracsegmenta-tion, and image recognition are briefly described below.
1. Image denoising
Image denoising is an indispensable part of image pro-cessing. After decades of development, traditional image denoising methods have been widely used and play an im-portant role. The denoising technology mainly includes spatial domain denoising and transform domain denois-ing. The spatial domain denoising method directly calcu-lates the pixel value of the image. The transform domain denoising method first transforms the image, then per-forms the corresponding operation in the transform do-main, and then performs the inverse transformation [8,9].
2. Image segmentation
Image segmentation is a very important processing step between image preprocessing, feature extraction, and image recognition. Since the 1960s, it has been paid attention to and studied extensively. It has been widely used in engineering practice, and many new segmenta-tion methods have been proposed [10].
3. Image feature extraction
Because of the different types and application ways of images, in order to extract the essential features that best describe the objects in images, image feature extrac-tion involves the knowledge of computer science, phys-ics, medicine, mathematphys-ics, and other fields, so there is no definite definition and fixed mode of image feature extraction. Common image feature extraction methods mainly include color feature extraction, shape feature ex-traction, and texture feature extraction.
The research of digital image recognition began in the 1960s. With the rapid development of computer technol-ogy, image recognition technology has made rapid pro-gress. Digital image recognition mainly includes structural pattern recognition, statistical pattern recognition, and fuzzy pattern recognition. Because the traditional statis-tical pattern recognition method can optimize the classifi-cation effect only when the training sample area is infinite, it is often not applicable in practice. Vapnik et al. began to study the statistical learning theory of limited samples in the 1960s, and put forward the support vector machine (SVM) algorithm for the first time in the mid-1990s [11,
12]. SVM has many advantages in solving small sample,
high dimension, and nonlinear classification problems. Be-cause SVM algorithm is based on statistical learning the-ory, its mathematical model is simple, and it has good generalization ability, it has become a new research hot spot in machine learning field, and has attracted extensive attention of many scholars all over the world.
In order to realize automatic identification of power equipment, this paper presents a method of power equipment identification based on image processing using image processing technology. The specific contri-butions of this paper are as follows:
1. The power equipment image is preprocessed by various denoising and sharpening algorithms to remove the noise and distortion of the image and improve the image quality.
2. Scale-invariant feature transform (SIFT) algorithm is used to extract image features, and principal component analysis (PCA) algorithm is used to reduce dimension.
3. SVM is used to classify and recognize images, and automatic recognition of power equipment images is realized.
2 Proposed method
2.1 Image preprocessing of power equipment
2.1.1 Image denoising
In the process of image acquisition, there are many rea-sons for noise, such as the internal noise of sensitive ele-ments, thermal noise, interference noise of transmission channel, and quantization noise. The causes of noise de-termine the distribution characteristics of noise and the relationship between noise and image. Generally, noise can be divided into additive noise, multiplicative noise, quantization noise, and so on. These noises deteriorate the image quality, blur the image, even submerge the fea-tures, and bring difficulties to image analysis. The purpose of image smoothing is to reduce and eliminate the noise in the image, to improve the image quality, and to facili-tate the extraction of object features for analysis.
Noise threshold method is a simple and feasible method to eliminate noise. It has a good effect on single point noise with isolated and discrete distribution caused by sensors or channels. When noise threshold method is used for image denoising, the threshold value is set first, and then each pixel of the image is sequentially detected, and the pixel is compared with other pixels in its neigh-borhood to determine whether it is a noise point or not. If it is a noise point, the average gray level of all the pixels in its neighborhood is replaced. Otherwise, the original gray value is output [13,14].
Assuming that the gray level of pixel (i,j) is f(i,j), a window of N×N (N= 3, 5, 7, ⋯) is taken as the center of the pixel. The set of pixels in the window is marked asA, and the thresholdTof gray difference, error
calcu-lator Cnt and counter threshold Yare defined. For each
window, the initial value of error counter Cnt is 0. For the grayf(i',j') of (i',j') of each pixel in setA, if satisfied
εi0;j0¼f i0;j0−fði;jÞ≥T ð1Þ
Then the error counter Cnt plus 1. The smoothing output at the location is
g ið Þ ¼;j
f ið Þ;j;Cnt<Y 1
N2−1
X
i0;j0
ð Þ∈Anfð Þi;jg
f i0;j0;Cnt≥Y 8
> < >
: ð2Þ
When the window moves over the whole image se-quentially, the noise can be smoothed. It should be noted that the selection of thresholdTis very important in this method. IfT is too large, the noise smoothing is not ideal. IfT is too small, the smoothed image will be-come blurred. The selection of counter threshold is usu-ally near half of the number of pixels in the window.
2.1.2 Image sharpening
In the process of image acquisition, transmission, and pro-cessing, there are many factors that make the image blurred. Image blurring is a common problem of image degradation. A large number of studies have shown that the essence of image blurring is that the image is sub-jected to summation, averaging, or integration operations. Therefore, it is not necessary to study the physical process and mathematical model of image blur degradation. Ac-cording to the common point that image blur has additive or integral operation, the opposite operation is used to re-duce and eliminate blur. This kind of enhancement method to reduce image blur is called image sharpening.
When the image is sharpened by differential operator method, the noise and fringes in the image are also en-hanced, which will result in false edges and contours in image processing. Sobel operator overcomes this
operator is to take (i,j) as the center of any pixel of the image to be enhanced and intercept a 3*3 pixel window. The matrix of the pixel window is as follows.
f ið−1;j−1Þ f ið−1;jÞ f ið−1;jþ1Þ f ið;j−1Þ f ið Þ;j f ið;jþ1Þ f ið þ1;j−1Þ f ið þ1;jÞ f ið þ1;jþ1Þ 2
4
3
5 ð3Þ
Calculate the gradient of the central pixel of the win-dow in the direction ofxandyrespectively.
Sx¼½f ið−1;jþ1Þ þ2f ið;jþ1Þ þf ið þ1;jþ1Þ−
f ið−1;j−1Þ þ2f ið;j−1Þ þf ið þ1;j−1Þ
½
ð4Þ
Sy¼½f ið þ1;j−1Þ þ2f ið þ1;jÞ þf ið þ1;jþ1Þ−
f ið−1;j−1Þ þ2f ið−1;jÞ þf ið−1;jþ1Þ
½
ð5Þ
The gray value of the enhanced image at (i,j)
f0ð Þ ¼i;j ffiffiffiffiffiffiffiffiffiffiffiffiffiffiffiS2
xþS2y
q
ð6Þ
When calculating the gradient in X direction and Y
direction, Sobel operator does not use only the differ-ence of two pixels’gray level as usual gradient operator, but the difference of weighted sum of two columns or two rows of pixels’gray level, which makes Sobel oper-ator have the following advantages:
1. The weighted average is introduced to smooth the random noise in the image.
2. Because the Sobel operator uses the difference between two rows or columns, the pixels on both sides of the image edge are enhanced. The edges of sharpened images obtained by Sobel operator are thick and bright.
2.1.3 Edge detection
Edge is the most significant part of the local intensity of the image. Edge mainly exists between target and target, target and background, region and region (including dif-ferent colors), which is an important basis for image seg-mentation, texture features, and shape features. The first step in image analysis and understanding is often edge detection [16]. After denoising, the edge of the tag image can be extracted, and the location of power equipment can be well done by edge extraction. In this paper, canny operand is selected to realize image edge detection.
The method of edge detection by Canny operand is to find the local maximum of image gradient. The gradient is calculated by the derivative of the Gauss filter. UseI(i,j) to represent images. The convolution of image and Gaussian smoothing filter is obtained by using separable filtering method. The result is a self-smoothed array of data.
S i½ ¼;j G i½;j;σ I i½ ;j ð7Þ
Where σ is the dispersion parameter of Gauss
func-tion, which controls the smoothness.
After smoothing, the gradient of data array S[i,j] can be calculated by 2∗2 finite difference approximation for two arraysP[i,j] andQ[i,j] of partial derivativesxandy.
P i;½ j ≈ðS i;½ jþ1−S i;½ þj S i½ þ1;j−1−S i½ þ1;jÞ=2
ð8Þ
Q i;½ j ≈ðS i;½ j−S i½ þ1;j þS i;½ jþ1−S i½ þ1;jþ1Þ=2
ð9Þ
Find the mean of the finite difference in this 2*2 square to calculate the partial derivative gradients of x andy at the same point in the image. Its magnitude and direction angle can be calculated by the transformation formula from rectangular coordinates to level coordinates.
M i½ ¼;j qffiffiffiffiffiffiffiffiffiffiffiffiffiffiffiffiffiffiffiffiffiffiffiffiffiffiffiffiffiffiffiffiP i½ ;j2þQ i½ ;j2 ð
10Þ
θ½ ¼i;j arctanðQ i½ ;j=P i½ ;jÞ ð11Þ
Canny operands use two thresholds to detect strong edges and weak edges, and only when weak edges are con-nected with strong edges, weak edges will be included in the output. Therefore, this method is not susceptible to noise interference and can detect real weak edges.
2.1.4 Image segmentation
Image segmentation is to represent an image as a collec-tion of physically meaningful connected regions. The purpose of image segmentation is achieved by analyzing different features of image such as edge, texture, color, and brightness. Segmentation is usually for further ana-lysis, recognition, and understanding of images. The ac-curacy of segmentation directly affects the effectiveness of subsequent tasks, so it is of great significance [17,18]. Image segmentation is based on the gray level, color, or geometric properties of the image to separate the dif-ferent meanings of the region in the image. These re-gions are not intersected, and each region satisfies the consistency of the specific region. For example, for an image of the same object, it is generally necessary to separate the pixels (or object feature pixels) belonging to the object from the background, and separate the pixels belonging to different objects [19]. The segmented areas should satisfy the following requirements:
1. There should be some significant difference between adjacent areas.
3. The segmented region should have uniformity and connectivity. Uniformity means that all the pixels in the region satisfy some similarity based on gray, texture, and color. Connectivity means that there are paths connecting any two points in the region.
According to the principle of image segmentation, there are four methods of image segmentation: image segmenta-tion based on threshold selecsegmenta-tion, image segmentasegmenta-tion based on region, image segmentation based on edge de-tection, and fuzzy segmentation [20–22]. Among them, image segmentation based on threshold selection is mainly based on gray frequency distribution information (histogram). Because of the simple and stable threshold method, it has become the basic technology of image seg-mentation. This method mainly takes advantage of the dif-ference of gray characteristics between the object to be extracted from the image and its background, and regards the image as a combination of regions with different gray levels. By selecting appropriate thresholds, the target re-gion is separated from their background to achieve the purpose of image segmentation.
2.2 Extraction and processing of image features
2.2.1 SIFT algorithm for image feature extraction
The feature vectors extracted based on SIFT algorithm have the following advantages: the extracted features are local features, insensitive to image rotation, brightness changes, rich information, multivariate, expandable [23]. The flow of SIFT image feature extraction is described in detail below.
1. Detecting scale space extremes
Scale space theory is the basis of detecting invariant features. Witkin proposed scale space and applied it in one-dimensional signal smoothing. Koenderink extended the theory to two-dimensional image processing, and concluded that Gauss convolution is the only transform core to realize scale transformation [24].
Assuming that a two-dimensional image is I(x,y), its scale space can be expressed by image function and Gauss convolution as follows:
L xð ;y;σÞ ¼G xð ;y;σÞ I xð ;yÞ ð12Þ
The Gauss kernel is defined as follows:
G xð ;y;σÞ ¼ 1 2πσe
−ðxþyÞ=2σ2
ð13Þ
where (x,y) is the pixel of the image,I(x,y) is image data, and scaleσspatial factor is the variance of Gaussian normal distribution, which represents the degree of image smooth-ing. The smaller the value, the smoother the image is.
In order to detect stable matching feature points effi-ciently in scale space, DoG operator is usually selected as detection function. DoG operator has the advantages of simple calculation, high execution efficiency, and good stability of the detected feature points or regions.
The DoG operator is obtained by the difference of two Gaussian kernels of different scales, which is similar to
the normalized LoG operator in form. Letkbe the scale
factor of adjacent scale space:
D xð ;y;σÞ ¼L xð ;y;kσÞ−L xð ;y;σÞ ð14Þ
Specific steps: firstly, the image function is convoluted with the Gauss kernels obtained in different scales to gen-erate the Gauss pyramid. The pyramids of Gauss image are divided into several groups, and each group of pyra-mids is divided into several layers. The scale difference be-tween adjacent layers in the same group is a scale factork. Assuming that there areS scale intervals, in order to get
the DoG extremum, the S + 3-layer smooth image must
be generated in the pyramid. The DoG pyramid can be subtracted from the adjacent Gauss pyramid. When de-tecting the local extremum of DoG, the marked pixels need to be compared with eight neighborhood pixels of the same scale and 9*2 neighborhood pixels of the corre-sponding position of the adjacent scale, a total of 26 pixels. When the DoG value of the detection point is greater than or less than all 26 pixels, the required extreme value of the DoG value can be determined.
2. Feature point location extraction
After detecting the spatial extremes, we can get a set of spatial extreme points. But there will be some low contrast points in these extreme points, which are sensi-tive to noise, and the points on the edge are difficult to locate accurately. In order to ensure the stability of SIFT algorithm, it is necessary to remove such points.
1. Screening of low contrast points
The scale space functionD(x,y,σ) of a feature point x in an image is expanded by Taylor at the local extreme point (x0,y0,σ):
D Xð Þ ¼D xð 0;y0;σÞ þ
∂DT
∂X þ 1 2X
T∂2D
∂X2X ð15Þ
Then derive the Taylor expansion of x-point and take 0.
Accurate extreme position Xmaxcan be obtained through
multiple iterations, and then set the required gray thresh-old to screen out the points with lower contrast.
According to geometric knowledge, the principal curvature is larger in the direction of edge gradient and smaller in the direction of edge. Therefore, compared with other regions, the DoG extreme points on the edge have larger principal curvature and smaller directional curvature. One or two thresholds can be set to remove the points on the edge in time.
3. Direction determination of feature points
The direction of feature points is determined by the gradient distribution of domain pixels, which can make the operator rotation-invariant. The gradient modes
m(x,y) andθ(x,y) of the characteristic points can be cal-culated by the following formula:
m xð ;yÞ ¼ ðffiffiffiffiffiffiffiffiffiffiffiffiffiffiffiffiffiffiffiffiffiffiffiffiffiffiffiffiffiffiffiffiffiffiffiffiffiffiffiffiffiffiffiffiffiffiffiffiffiffiffiffiffiffiffiffiffiffiffiffiffiffiffiffiffiffiffiffiffiffiffiffiffiffiffiffiffiffiffiffiffiffiffiffiffiffiffiffiffiffiffiffiffiffiffiffiffiffiffiffiffiL xð þ1;yÞ−L xð −1;yÞÞ2þðL xð ;yþ1Þ−L xð ;yÞ−1Þ2
q
ð16Þ
θðx;yÞ ¼ arctan L xð ;yþ1Þ−L xð ;y−1Þ L xð þ1;yÞ−L xð −1;yÞ
ð17Þ
4. Generating local feature descriptors
Because the movement of the equipment will lead to translation, dislocation, rotation, and other problems of the collected image, this paper uses the improved SIFT algorithm to extract the features of the power equipment image. SIFT algorithm is an algorithm for extracting local features, which has strong matching ability for extracting feature points. It can find extreme points in scale space, extract location, scale and rotation-invariant, so as to deter-mine the location information of faults in two-dimensional plane, and select 8-dimensional gradient-related vectors from 32-dimensional high-dimensional vectors in fea-ture sub-description, so as to greatly optimize the calculation speed.
2.2.2 PCA algorithm for feature dimension reduction
PCA is a multivariate statistical method to study how to interpret the vast majority of information of original var-iables through a few linear combinations of original vari-ables. Generally speaking, the principal components obtained by PCA have the following relationship with the original variables:
1. Each principal component is a linear combination of original variables.
2. The number of principal components is much less than the number of original variables.
3. The principal component retains most of the information of the original variables.
4. The principal components are not correlated with each other.
Principal component analysis (PCA) is an effective method to analyze data in statistics. It regards every image as a high-dimensional vector, and every pixel is a component of the high-dimensional vector. Then it maps the high-dimensional information space to the lower-di-mensional feature subspace by K-L transformation. A set of orthogonal bases can be obtained by K-L transformation in high-dimensional image space. Some orthogonal bases are preserved to generate low-dimensional sub-spaces.
The preserved orthogonal bases are called “principal
components.”
1. Get a group of images of the same size, expressed byI1,I1 ,IM.
2. Using vectorΓito representIi, (1≤i≤M;Γi:N2× 1; Ii:N×N).
3. Computing average characteristicsΨ¼ 1
M
PK i¼1Γi.
4. Minus average characteristicsΦ=Γ−Ψ.
5. Computing covariance matrixC¼PMi¼1ΦnΦnT;A ¼ ½Φ1;Φ2;⋯;ΦM.
6. Calculate the eigenvalues and feature vectors ofC, and take the feature vectorsΩi¼ ½W1;W2;⋯;WKT;Wj ¼UT
jΦicorresponding to the firstKeigenvalues.
7. Each image sample can be represented as a linear combination of feature vectors, and the image can be represented by feature vectors:Θi¼PKj¼1WjUj.
2.3 SVM recognition classification
Traditional statistical algorithms, such as artificial neural networks, improve the recognition rate of classifiers by providing enough training samples, which is a gradual theory based on the large number of samples. However, in practice, the number of samples is not unlimited, and traditional statistical methods cannot guarantee good classification results. Support vector machine (SVM) is based on the VC dimension theory of statistical learning theory and the structural risk minimization principle, which has the advantage of solving the classification problem of high dimensional, small sample and nonlin-ear data. It has good generalization ability [25]. SVM ob-tains global optimal solution by optimization method, which can prevent over-learning and local minimum problems of traditional statistical methods. Therefore, this paper chooses to use SVM algorithm for power equipment image recognition.
The final decision function of SVM is determined only by a few support vectors. The complexity of calculation depends on the number of support vectors, not the
di-mension of sample space, which avoids the “dimension
final result. They can also help to grasp key samples and
“eliminate”a large number of redundant samples. More-over, it is doomed that the method is not only simple in al-gorithm but also has good robustness. This“robustness”is mainly reflected in the fact that adding or deleting unsup-ported vector samples has no effect on the model and the support vector sample set has a certain robustness.
In this paper, LibSVM [26] is used to carry out the
ex-periment of power equipment image recognition.
LibSVM is an open source SVM software package de-signed by Chih-Jen Lin, an associate professor of Taiwan University, which is easy to use, simple, and fast, and can be used to solve the problems of classification, re-gression, and distribution estimation. LibSVM has fewer parameters to adjust, it is flexible and easy to use, and it is a tool software of SVM that uses more.
3 Experiments
In this paper, 400 images of five types of power equipment taken in factory environment are preprocessed separately. The preprocessing mainly includes image gray processing, image filtering, image sharpening, edge detection, image segmentation, etc. If the original image is used for pattern matching and classification retrieval directly, the vector dimension is larger and the difficulty is greater. Therefore,
extracting the bottom features of the image becomes the key step of image classification, making full preparations for feature extraction.
Among the numerous existing software packages for SVM algorithm, LibSVM software, which is widely used at present, is particularly convenient to use, and provides fewer user parameters, and provides cross-validation functions. Radial basis function (RBF) is used as the kernel function of this experiment. RBF needs to determine the parameterγ. At this time, two parameters need to be determined, namely
γand error penalty factor C. Cross-validation can be used to determine the parameters. This method can prevent the occurrence of learning and under-learning. The experimen-tal data ofCandγare 8 and 0.044194, respectively.
In this paper, the recognition accuracy is used as a cri-terion to evaluate the classification effect. The formulas are as follows:
Accuracy rate ¼ Number of samples correctly identified
Total number of samples tested 100%
ð18Þ
In addition, the simple recognition accuracy rate can-not represent all the advantages and disadvantages of the algorithm. In order to verify the performance of the algorithm, this paper also uses the false rejection rate Fig. 1Grayscale processing.aOriginal image.bGrayscale image
(FRR) and false acceptance rate (FAR) as evaluation indi-cators. Among them, the FRR mistakes the original un-successful matching graph as the probability of matching success, while the FAR is just the opposite; it is to reject the original matching successful graph as the probability of not matching success. Either of the FRR or FAR is lar-ger, which indicates that the algorithm is not ideal. The FRR and FAR are as follows:
FRR ¼ NFR
NGRA100% ð19Þ
FAR ¼ NFA
NIRA100% ð20Þ
Where NGRA is the total number of in-class tests, NIRA is the total number of inter-class tests, NFR is the number of false rejections, and NFA is the number of false acceptances.
4 Results and discussion
In order to highlight the useful features in power equip-ment images, it is necessary to preprocess the images. The following simulation shows that this paper prepro-cesses the power equipment images, which is conducive to subsequent image feature extraction (Fig.1).
In order to highlight the useful features in power equipment images, it is necessary to preprocess the im-ages. The following simulation shows that this paper preprocesses the power equipment images, which is con-ducive to subsequent image feature extraction.
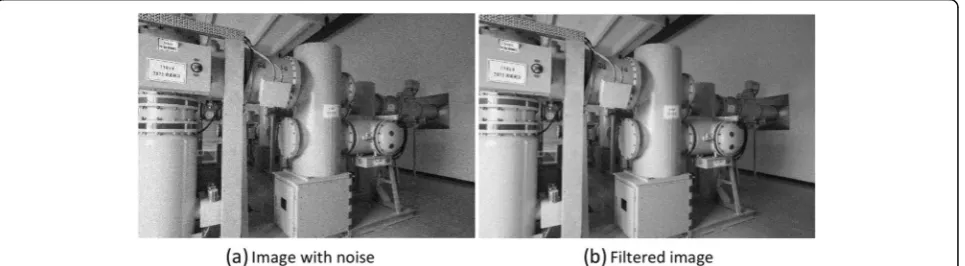
Figure2 shows the experimental results of filtering in this paper. Figure 2a is a noisy image and Fig. 2b is a
filtered image. From the figure, we can see that this paper uses simple noise threshold to filter the image, ef-fectively filters the noise in the image, and avoids the noise deteriorating the quality of the image. After filter-ing, the image quality is improved, which is conducive to extracting object features for analysis.
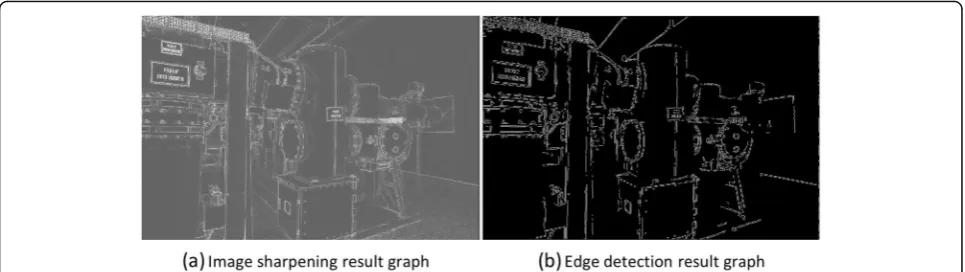
After filtering the power equipment, this paper uses Sobel operator to sharpen the filtered image. The
process-ing results are shown in Fig. 3a. Image sharpening is
mainly to eliminate image blurring in the process of image acquisition, transmission, and processing. Compared with Figs.2b and3a, after image sharpening, the filtered image strengthens the object boundary and image details in the power equipment image.
After image sharpening, the edge detection is processed. This paper chooses canny operand to realize image edge detection. The result of edge detection is shown in Fig.3b. Image edge is one of the basic features of image, which contains abundant intrinsic information of image. As can be seen from Fig. 3b, after edge detection, the edge of power equipment can be found smoothly, that is to say, the edge points of equipment image can be found.
After image preprocessing, the image quality of power equipment has been improved, and the image features are more obvious, which is conducive to SIFT algorithm for feature extraction. In this paper, SIFT algorithm is used to extract image features, and PCA algorithm is used to reduce dimension. SVM classification and recog-nition performance is mainly related to the selection of kernel function. In this paper, radial basis function (RBF) Fig. 3Image sharpening and edge detection.aImage sharpening result graph.bEdge detection result graph
Table 1SVM performance using different kernel functions
Kernel type Classification accuracy (%)
Linear kernel function 95.5
Multinomial kernel function 94.3
Sigmoid kernel 96.7
Radial basis function 97.2
Table 2Identification and analysis of five types of electric power equipment
Types of power equipment Accuracy rate (%) FRR (%) FAR (%)
Transformer 98.1 1.2 0.7
Circuit breaker 96.4 2.1 1.9
Electric energy meter 97.7 1.1 1.2
Knife brake 95.9 2.7 2.2
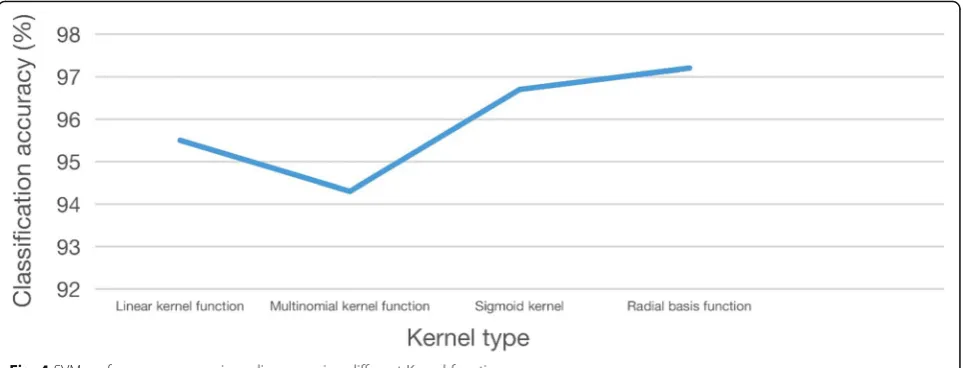
is selected as the kernel function of SVM, and parame-ters Candγ are set to 8 and 0.044194, respectively. To verify the effect of using RBF, this paper compares the classification accuracy of SVM with linear kernel func-tion, polynomial kernel funcfunc-tion, and Sigmoid kernel function under the same parameters. The results of comparison are shown in Table1. For intuitive presenta-tion, a poly line diagram is drawn as shown in Fig.4.
Combining Table1and Fig.4, it can be seen that after extracting image features by SIFT, SVM is used for clas-sification and recognition. SVM achieves good recogni-tion performance by using four kinds of kernels, and can realize the recognition of power equipment very well. The worst performance is the performance of SVM using multi-kernels, the accuracy rate is 94.3%; the best performance is that this paper uses the radial basis func-tion SVM, the accuracy is 97.2%.
In addition, the simple recognition accuracy rate can-not represent all the advantages and disadvantages of the algorithm. In order to more accurately illustrate the performance of the power equipment image recognition method in this paper, the FRR and FAR are added as evaluation indicators to identify and analyze the selected five types of power equipment. The results are shown in
Table 2. From Table 2, it can be seen that the method
presented in this paper has good recognition
performance for all five types of power equipment, with an average recognition accuracy of 97.2%.
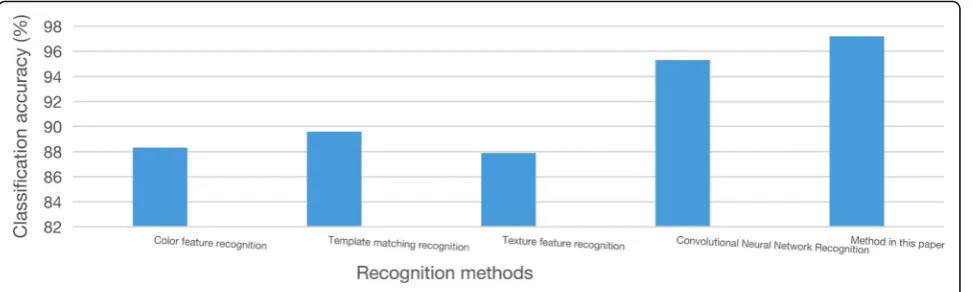
In order to better illustrate the performance of this method, this paper uses commonly used color feature recognition methods, template matching recognition methods, texture feature recognition methods, and con-volution neural network-based recognition methods to compare and explain. Among them, the accuracy is ana-lyzed as an index, and the data are the average of the recognition accuracy of five types of power equipment.
The comparison results are shown in Table 3, and the
histogram is drawn as shown in Fig.5.
Combining Table3and Fig.5, we can see that the rec-ognition accuracy of this method is 97.2%, which is much higher than the commonly used color feature recognition method, template matching recognition method, and texture feature recognition method. The accuracy is 8.9% higher than 88.3% of the color feature recognition method, 7.6% higher than 89.6% of the tem-plate matching method, 9.3% higher than 87.9% of the texture feature recognition method, and 1.9% higher than 95.3% of the recognition method based on convolu-tion neural network. From the analysis of the experi-ment, it can be seen that the proposed method based on image processing has superior performance.
5 Conclusions
Nowadays, automatic identification of power equipment has become more and more important, which is condu-cive to monitoring the situation of power equipment and achieving the goal of ensuring the safe and stable oper-ation of power network. In order to realize automatic identification of power equipment, this paper presents a method of recognition of power equipment based on image processing. After image preprocessing, the image Fig. 4SVM performance comparison diagram using different Kernel functions
Table 3Performance of different recognition methods
Recognition methods Classification accuracy (%)
Color feature recognition 88.3
Template matching recognition 89.6
Texture feature recognition 87.9
Convolutional neural network recognition 95.3
features are extracted based on the good performance of SIFT algorithm, and the dimension is reduced by PCA al-gorithm. Then SVM is used to classify and recognize the image, which realizes the automatic recognition function of power equipment image. Through simulation, it can be found that the image quality is improved by filtering, image sharpening, edge detection, image segmentation, and other pretreatment technologies, which makes the image features more prominent, and is conducive to sub-sequent feature extraction and image recognition. Then, after feature extraction and dimension reduction, SVM is used to recognize the image, which has good recognition performance. The feasibility of this method is well illus-trated, and compared with other methods, this method has the highest classification accuracy, 97.2%, which shows the superiority of this method.
Abbreviations
CT:Computed tomography; CV: Cross validation; DSA: Digital subtraction angiography; FAR: False accept rate; FRR: False reject rate; JPL: Jet propulsion laboratory; MRI: Magnetic resonance imaging; PCA: Principal component analysis; RBF: Radial basis function; SIFT: Scale-invariant feature transform; SVM: Support vector machine
Acknowledgements
The authors thank the editor and anonymous reviewers for their helpful comments and valuable suggestions.
About the authors
Haiyan Wang was born in Baishan, Jilin, P.R. China, in 1980. She received the Master degree from Changchun University of Technology, P.R. China. Now, she works in Changchun Sci-Tech University, Her research interests include Control engineering, the image processing, mechatronics.
Fanwei Meng was born in Meihekou, Jilin, P.R. China, in 1980. He received the Master degree from Jilin College of Sports, P.R. China. Now, she works in Changchun Sci-Tech University, His research interests include Control Sports training.
Funding
Not applicable.
Availability of data and materials
Please contact author for data requests.
Authors’contributions
All authors take part in the discussion of the work described in this paper. The author HW wrote the first version of the paper. The author FM did part experiments of the paper. Both authors read and approved the final manuscript.
Competing interests
The authors declare that they have no competing interests.
Publisher’s Note
Springer Nature remains neutral with regard to jurisdictional claims in published maps and institutional affiliations.
Received: 29 December 2018 Accepted: 29 March 2019
References
1. L. Yang, B. Lin, Carbon dioxide-emission in China′s power industry: evidence and policy implications [J]. Renew. Sust. Energ. Rev.60(C), 258–267 (2016) 2. M. Zuo, G.P. Zeng, T.U. Xu-Yan, Research on visual navigation of untended
substation patrol robot [J]. Acta Electron. Sin.39(10), 2464–2468 (2011) 3. J.G.A. Barbedo, A novel algorithm for semi-automatic segmentation of plant
leaf disease symptoms using digital image processing [J]. Trop. Plant Pathol. 41(4), 1–15 (2016)
4. S.J. Chen, W.C. Zhu, Q.L. Yu, et al., Characterization of anisotropy of joint surface roughness and aperture by variogram approach based on digital image processing technique [J]. Rock Mech. Rock. Eng.49(3), 855–876 (2016) 5. C. Tas, H. Mogulkoc, G. Eryilmaz, I. Gogcegoz-Gul, T.T. Erguzel, B. Metin, N.
Tarhan, Discriminating schizophrenia and schizo-obsessive disorder: a structural MRI study combining VBM and machine learning methods. Neural Comput. & Applic.29(2), 377–387 (2018)
6. A. Chandra, S. Mondal, Amalgamation of iterative double automated thresholding and morphological filtering: a new proposition in the early detection of cerebral aneurysm. Multimed. Tools Appl.76(22), 23957–23979 (2017)
7. J. Ye, Z. Xu, Y. Ding, Image search scheme over encrypted database. Futur. Gener. Comput. Syst.87, 251–258 (2018)
8. M. Ma, H. Tian, C. Hao, Image denoising using grey relational analysis in spatial domain [J]. Proc. SPIE Int. Soc. Opt. Eng.5960(1), 335–342 (2005) 9. C. Zhang, Y. Chen, C. Duanmu, et al., Image denoising by using PDE and GCV
in tetrolet transform domain [J]. Eng. Appl. Artif. Intell.48(C), 204–229 (2016) 10. K. Zhang, L. Zhang, K.M. Lam, et al., A level set approach to image
segmentation with intensity inhomogeneity [J]. IEEE Trans. Cybern.46(2), 546–557 (2017)
11. Y.H. Shao, N.Y. Deng, Z.M. Yang, Least squares recursive projection twin support vector machine for classification [J]. Int. J. Mach. Learn. Cybern.7(3), 411–426 (2016)
12. Y.D. Zhang, Z.J. Yang, H.M. Lu, et al., Facial emotion recognition based on biorthogonal wavelet entropy, fuzzy support vector machine, and stratified cross validation [J]. IEEE Access4(99), 8375–8385 (2017)
13. L. Ren, J. Huang, W. Jing, An improved noise threshold detection method [J]. Fire Control Radar Technol.42(01), 47–50 (2013)
14. D. Malah, System and method for noise threshold adaptation for voice activity detection in nonstationary noise environments [J]. J. Acoust. Soc. Am.108(3), 885–916 (2000)
15. Y. Liu, C. Zheng, Q. Zheng, et al., Removing Monte Carlo noise using a Sobel operator and a guided image filter [J]. Vis. Comput.34(6), 1–13 (2017) 16. W. Fu, M. Johnston, M. Zhang, Low-level feature extraction for edge
detection using genetic programming [J]. IEEE Trans. Cybern.44(8), 1459– 1472 (2017)
17. Y. Gao, Y. Shao, J. Lian, et al., Accurate segmentation of CT male pelvic organs via regression-based deformable models and multi-task random forests [J]. IEEE Trans. Med. Imaging35(6), 1532–1543 (2016)
18. J. Hou, W. Liu, E. Xu, et al., Towards parameter-independent data clustering and image segmentation [J]. Pattern Recogn.60(C), 25–36 (2016) 19. L.C. Chen, G. Papandreou, I. Kokkinos, et al., DeepLab: semantic image
segmentation with deep convolutional nets, Atrous convolution, and fully connected CRFs [J]. IEEE Trans. Pattern Anal. Mach. Intell.40(4), 834–848 (2016) 20. H. Wang, J. Oliensis, Generalizing edge detection to contour detection for
image segmentation [J]. Comput. Vis. Image Underst.114(7), 731–744 (2013) 21. T.F. Tao, C.Z. Han, X.F. Dai, et al., An infrared image segmentation method based
on edge detection and region growing [J]. Opt. Eng.31(10), 50–52 (2004) 22. Y. Vasuki, E.J. Holden, P. Kovesi, et al., An interactive image segmentation
method for lithological boundary detection: a rapid mapping tool for geologists [J]. Comput. Geosci.100(C), 27–40 (2017)
23. L. Yingda, X. Shen, H. Chen, Copy-paste detection based on a SIFT marked graph feature vector [J]. Chin. J. Electron.26(2), 345–350 (2017) 24. L. Holmström, L. Pasanen, R. Furrer, et al., Scale space multiresolution
analysis of random signals☆[J]. Comput. Stat. Data Anal.55(10), 2840–2855 (2017)
25. S.E. Pandarakone, Y. Mizuno, H. Nakamura, Distinct fault analysis of induction motor bearing using frequency spectrum determination and support vector machine [J]. IEEE Trans. Ind. Appl.53(3), 3049–3056 (2017)