How Can Customized IT System Support Qualitative Methods in Website
Validation: Application for Visual Content Analysis
Josipa Selthofer
Faculty of Humanities and Social Sciences, University of J.J. Strossmayer Osijek, L. Jagera 9, [email protected]
Tomislav Jakopec
Faculty of Humanities and Social Sciences, University of J.J. Strossmayer Osijek, L. Jagera 9, [email protected]
Abstract
Data gathering phase of qualitative research method in visual communication studies on website is extremely complex and time consuming. At the same time researcher should have a visual access to the web page that is being reviewed and a possibility to quantify data for given attributes. Multiple screens or split windows are possible practical solutions at hand. Although there are tools for managing data in quantitative research, none of them is suitable for visual content analysis of websites. The aim of this paper is to present a customized system providing IT support in the process of quantitative data gathering.
Main research question: How can customized IT support system enhance data integrity and reduce total research time, especially in data gathering phase? The form of the proposed IT support is a web application built using agile software development method on LAMP stack and is available online. For the specific research project the application offers three main sections: a list of websites to evaluate, a visual representation of loaded website and a list of attributes grouped by categories for quantifying the data. Proposed customized IT tool allows data export to widely accepted MS Excel format for further data analysis. Main conclusions of the research are that the use of customized IT support in visual content analysis reduces time necessary for data gathering and increases data credibility.
Keywords: customized web application, qualitative research, website validation, visual content analysis
Introduction
Content analysis is a highly flexible research method that has been widely used in library and information science (LIS) studies with various research goals and objectives. The research method is applied in qualitative, quantitative and
sometimes mixed modes of research frameworks and employs a wide range of analytical techniques to generate findings and put them into context. (White & Marsh 2006).
Visual content analysis is the most common qualitative method used in visual communication and mass media research. It is an empirical (observational) and objective procedure for quantifying recorded audio-visual (including verbal) representation using reliable, explicitly defined categories (values and independent variables). (Bell 2001; Bauer 2000).
As media of communication, websites and web pages are base for content analysis (Weare & Lin 2000), which was one of the first methodologies used in web analysis (Bates & Lu 1997), and it has been employed increasingly since, although not always in traditional way (McMillan 2000).
Data gathering phase of qualitative research method in visual communication studies on a website is extremely complex and time consuming. At the same time researcher should have a visual access to the web page that is being reviewed and a possibility to quantify data for given attributes. Multiple screens or split windows are possible practical solutions at hand. Although there are many IT tools designed for the analysis of large amounts of data by helping to organize documents according to topics of interest and placing them in their larger context, there are no IT tools designed to help in visual communication research of websites using visual content analysis.
In this specific visual research, the most important thing for the researcher was to have an application that is organized in a way that allows the researcher a full visual control of a web page he is observing and the ability to mark and save his observations directly on screen. The most important feature of an application was not only the ability of editing and changing gathered data, added IP addresses, attributes and categories, but also having an option of exporting data in MS Excel format that can be easily statistically processed.
Since specific visual communication research project consisted of analyzing and validating visual elements in large amount of web pages (1017) it was difficult to conduct
research manually. Web application for the specific research project was built using agile software development method on LAMP stack and is available online. It offers three main sections: list of websites to evaluate, visual representation of loaded website and list of attributes grouped by categories for quantifying data. Proposed customized IT tool allows data export to widely accepted MS Excel format for further data analysis.
The aim of this paper is to present a customized system providing IT support in the process of quantitative data gathering. Main research questions are: How can the customized IT support system enhance data integrity and reduce total research time, especially in data gathering phase? Why none of the existing IT tools available on the market is suitable for visual content analysis of web pages?
Available IT tools on the market
Visual representation of data on the web is becoming more and more important for representing complex data. As David McCandless (author of Information is Beautiful1) states: the real challenge in visual information presentation is “seeing the patterns and connections that matter, than designing that information so that it makes more sense or tells a story”. (Paton 2011)
A web application is characterized by three major design dimensions. Its structure describes the organization of the information managed by the application in terms of the pieces of content that constitute its information base and of their semantic relationships. Navigation concerns the facilities for accessing information and for moving across the application content. Presentation affects the way in which application content and navigation commands are presented to the user. (Fraternali 1999)
Browsing through the web and literature on this subject, it can be noticed that visual content analysis IT tools exist in two ways. First, as part of visual representation of gathered data, they are tools for easier data interpretation (Machlis 2011) and second, more relevant to this paper, as a set of tools for gathering data while performing visual content analysis in data gathering phase, for example: The Qualitative Data Analysis Program (QDAP) , ATLAS.ti, f4analyse software.
Main characteristics of IT tools above are:
if they are free or open source software, their performance is limited 1 http://www.informationisbeautiful.net/about/ 2 http://www.ubuntu.com/server 3 http://www.apache.org/ 4 http://www.mysql.com/ 5 http://www.php.net/ 6 http://www.w3.org/html/
if they are commercial software, they are expensive.
Customized IT system requirements
Since specific research project, web application was built for, was to analyze visual graphic elements of faculty and university web pages across the Europe, web application should have had these parts:
List of faculties’ IP addresses sorted by affiliation to their university in particular county
List of attributes for visual content analysis of web pages sorted by categories and allowing validation of visual graphic properties by clicking
Screen where the particular web page analyzed could be immediately seen visually
Ability to save, change and export all the data obtained in the research easily
Ability to change all the attributes in web application at any moment and therefore adjust the research, if necessary.
Customized Application
IT support was built using open source technologies: Linux Ubuntu2 distribution as the operating system; Apache3 as the web server; MySql4 as Relational database management system, PHP5 as the programing language, HTML6, CSS7 and javascript8 (jQuery9 framework) as the client side technology stack. To fulfill the requirements given by the researcher, Entity Relationship diagram was created.
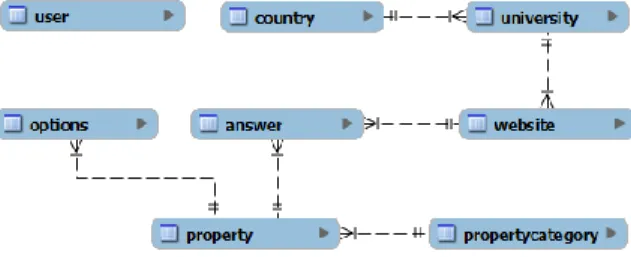
Figure 1. ER diagram for supported IT system.
Figure 1 represents an ER diagram10 for supported IT system: Information about users authorized to use the application is stored in the table user. Each website used in
7 http://www.w3.org/Style/CSS/
8 https://developer.mozilla.org/en-US/docs/Web/JavaScript 9 http://jqueryui.com/
10
the research is stored in the table website which has many to one relationship to university and the same relationship is from university to country. It means that one country can have one or more universities and one university can have one or more websites. Visual content analysis properties are stored in the table property and they are grouped as categories of properties in the table property/category. One category group can have one or more properties. Property can, but does not have to, have options which are stored in the table options. When researchers validate individual property, the answer is stored in table answer. Required data for answer are website and property. Option is required if there are defined options on a given property. If that is not the case, then for given combination website and property remarks are required.
Web application is deployed on the address http://oziz.ffos.hr/epub/JosipaDoktorat/. User interface is in Croatian language. After successful login, a user gets a menu of items that allow then to view, insert, change, or delete all entities mentioned in ER diagram. All these actions enable a researcher to administrate data he is validating. Figure 2 represents one of the pages in application - property page.
Figure 2. Property page in application.
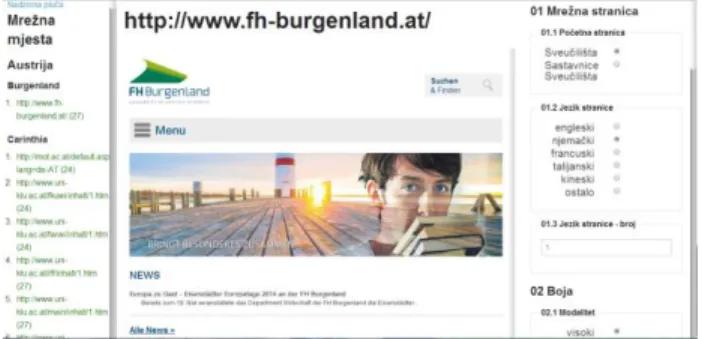
After defining data for validation, researcher in Validation page marks each specific property for specific page. Figure 3 presents Validation page. On the left side of the page is a list of countries with sub list of universities in that country and most important sub-list of websites in universities. Website is a link. When a researcher clicks on that link, a page is loaded in the central part of the screen (using AJAX11) and on the right side of the screen there is property list categorized by defined categories. Researcher now can
11
http://www.techopedia.com/definition/24402/asynchronous-javascript-and-xml-ajax
analyze the web page he is viewing in the central part of the screen and mark each attribute by clicking on the given option of the particular property or by writing remarks. Using AJAX, application stores answers immediately to the database so that a researcher does not have to click additional save button.
After validation, all data gathered in research are available for exporting. Export is obtained using comma separated value (CSV) file that can be easily edited by popular office tool MS Excel or imported in statistical software (like SPSS).
Figure 3. Validation page of the application.
LIS student`s competencies and their applicability in
building customized IT tools
Building a web application customized for visual content analysis research demands specific knowledge and competencies regarding design of a web page, Relation Database Management Systems and one of server side programming languages. In LIS schools curricula, there are subjects covering all of those different areas, so it is reasonable to conclude that LIS student`s competencies after graduation are enough for building such customized web application. Many authors have done research on this topic regarding curriculum and student`s IT technology competencies and knowledge. (Hanson-Baldauf & Hassell 2009; Ashcroft 2004; Dragija-Ivanovic et al.)
Findings
To evaluate the efficiency of the application, gathering data phase in the research was obtained first manually and then through the web application. Results were then compared. For the analysis and comparison, 104 web pages of the research sample (10%) were examined. Overall time necessary for data gathering in the analysis of one web page and of all web pages was measured, as well as the features of the analysis.
Data gathering phase of the specific research project consists of:
finding and clicking on a specific URL address
searching for visual attributes on the web page and marking them
data importing in MS Excel format for further analysis Table 1. Comparison of the time spent
in manual and automatic data gathering
Results of the comparison conducted in the data gathering phase of the visual research are presented in the Table below. As it is shown, total amount of the time spent on data gathering phase through the web application is almost three times less than time spent when data was gathered manually. In the automatic process of the analysis, data importing in MS Excel format is skipped because of the features of the application. The time that a researcher is spending conducting visual content analysis manually is wasted and is frustrating, and the possibility of making errors is greater than in computer managed application. Also, results indicate that clicking and uploading of the specific URL address is faster using a web application, since all IP addresses are imported in the application before the analysis.
Main advantages of the customized web application for visual content analysis of web pages are also:
the ability to edit and change added IP addresses, attributes, categories and gathered data
the ability to export gathered data in MS Excel format
the ability to visually present gathered data instantly on web.
Conclusion
Data gathering phase of qualitative research method in visual communication studies on website is extremely complex and time consuming. The aim of this paper is to present a customized system providing IT support in the process of quantitative data gathering. For the specific visual content analysis research of the web pages, a web application shows better results in all aspects of the data gathering phase, since none of existing IT tools for content analysis is suitable for visual content analysis of visual graphic elements of web pages.
Main conclusions of the research are that the use of customized IT support in visual content analysis reduces time necessary for data gathering and increases data credibility. Some of the main advantages of such application are the ability to edit and change added IP addresses, attributes, categories and gathered data, to export gathered data in MS Excel format and to visually present gathered data instantly on web. Clicking and uploading of the specific URL address is faster using web application and the possibility of errors is much smaller.
Another important notice is that such customized application can be built by LIS students. Part of most LIS School curricula are subjects that cover: design of a web page, Relation Database Management Systems and one of server side programming languages. In conclusion, the LIS students during their education gain knowledge and competencies necessary for building a custom web application for specific research demands.
REFERENCES
Ashcroft, L. (2004). Developing competencies, critical analysis and personal transferable skills in future information professionals. Library Review 53(2), pp. 82 – 88.
Bauer, M. (2000). Classical content analysis: A review. In M. W. Bauer & G. Gaskell (Eds.), Qualitative researching with text, image, and sound: A practical handbook (pp. 131-151). London: Sage.
Bates, M. J. & Lu, S. (1997). An exploratory profile of personal home pages: Content, design, metaphors. Online and CDROM Review, 21(6), pp. 331-340.
Bell, P. (2002). Content Analysis of Visual Images. In Van Leeuwen, T. & Jewit, C. (Eds.), Handbook of Content Analysis (pp. 15-34) SAGE Publication: London.
Dragija-Ivanovic, M.; Faletar, S.; Pehar F.; Aparac-Jelusic T. (2003). The needs of the archives, libraries and museums community: a preliminary research report. Coping with continual
Manually Web application 1 WP all WP 1 WP all WP Finding, clicking and uploading of the specific URL address 20 sec or 0,3 min 600 sec or 10 min 5 sec or 0,08 min 500 sec or 8,3 min or 0,13 h Searching and validating visual attributtes on the WP 1 min 100 min or 1,67 h 1 min 100 min Marking visual attributtes on the WP 3 min 300 min or 5h 3 min 300 min or 5 h Data importing in MS Excel format for further analysis 7 min 700 min or 11,67 h - - Overall time spent in data gathering research phase 11,2 min 1110 min 4,08 min 408,3 min 1121,2 min ili 18,7 h 412,38 min ili 6,873 h
change – change management in SLIS (Eds. Ashcroft L.).
Proceedings of the European Association for Library and Information Education and Research (EUCLID) and the Association for Library and Information Science Education
(ALISE) Joint Conference, Potsdam, Germany, pp. 46-58.
Fraternali, P. (1999). Tools and Approaches for Developing Data-Intensive Web. ACM Computing Surveys, 31(3), pp. 227-263. Hanson-Baldauf, D. & Hassell, H. S. (2009). The information and
communication technology competencies of students enrolled in school library media certification programs. Library & Information Science Research 31(1), pp. 3-11.
Machlis, S. (2011). 22 free tools for data visualization and analysis. Retrieved May 22, 2014 from http://www.computer-world.com/s/article/9215504/22_free_tools_for_data_visualizati on_and_analysis
McMillan, S. J. (2000). The microscope and the moving target: The challenge of applying content analysis to the World Wide Web. Journalism and Mass Communication Quarterly, 77(1), pp. 80-98.
Paton, B. (2011). Presenting Complex Data Visually: Using web-based tools to make your development data travel. Retrieved May 15, 2014 from http://www.researchtoaction.org/2011/09/
presenting-complex-data-visually-using-web-based-tools-to-make-your-development-data-travel/
Weare, C. & Lin, W. Y. (2000). Content analysis of the World Wide Web—Opportunities and challenges. Social Science Computer Review, 18(3), pp. 272-292.
White, M. D. & Marsh, E. E. (2006). Content Analysis: A Flexible Methodology. In Research Methods (Eds. Lynda M. Baker). Library Trends, 55(1), pp. 22-45.
Curriculum Vitae
Josipa Selthofer is a PhD candidate at the postgraduate doctoral study Knowledge Society and Information Transfer at the Department of Information Sciences in Zadar. She completed the study of Graphic Arts in Zagreb, and worked for years as production editor and designer in a number of publishing companies. From 2008 she is employed as a teaching assistant at the Department of Information Sciences at the University of Osijek. She takes part in different courses: Graphic design, Organization and management of publishing, Marketing in publishing and bookselling, and so on. Her research interests include visual communications, history of printing, history of graphic design and publishing. She also took part in the national project Digital Library of Croatian Printed Heritage by 1800: Structural Premises.
Tomislav Jakopec holds MS in information systems. He has five years of experience in design, programming, and implementation and maintenance of information systems in medium and large size companies. Currently he works as a teaching and research assistant at the Department of Information Sciences at the Faculty of Arts and Social Sciences in Osijek, where he participates in teaching of the following courses: Web design, Databases II,
Implementation of software solutions for content design and Electronic publishing and bookselling. The main areas of his interest are aggregators of electronic books and web development. As a researcher he participates in the project Digital Library of Croatian Printed Heritage by 1800: Structural Premises.