APPLICATION OF STATISTICAL PROCESS CONTROL TO SOFTWARE DEVELOPMENT PROCESSES VIA CONTROL CHARTS
A THESIS SUBMITTED TO
THE GRADUATE SCHOOL OF INFORMATICS OF
THE MIDDLE EAST TECHNICAL UNIVERSITY
BY
KAMİL UMUT SARGUT
IN PARTIAL FULFILLMENT OF THE REQUIREMENTS FOR THE DEGREE OF MASTER OF SCIENCE
IN
THE DEPARTMENT OF INFORMATION SYSTEMS
Approval of the Graduate School of Informatics.
__________________ Prof. Dr. Neşe YALABIK
Director
I certify that this thesis satisfies all the requirements as a thesis for the degree of Master of Science.
__________________ Prof. Dr. Semih BİLGEN Head of Department
This is to certify that we have read this thesis and that in our opinion it is fully adequate, in scope and quality, as a thesis for the degree of Master of Science.
__________________ Assoc. Prof. Dr. Onur DEMİRÖRS
Supervisor
Examining Committee Members
Prof. Dr. Semih BİLGEN _____________________ Assoc. Prof. Dr. Nazife BAYKAL _____________________ Assoc. Prof. Dr. Onur DEMİRÖRS _____________________ Assoc. Prof. Dr. Ali DOĞRU _____________________ Dr. Altan KOÇYİĞİT _____________________
iii
ABSTRACT
APPLICATION OF STATISTICAL PROCESS CONTROL TO SOFTWARE DEVELOPMENT PROCESSES VIA CONTROL CHARTS
Sargut, Kamil Umut
M.S., Department of Information Systems Supervisor: Assoc. Prof. Dr. Onur Demirörs
May 2003, 124 pages
The application of Statistical Process Control (SPC) to software processes has been a challenging issue for software engineers and researchers. Although SPC is suggested for providing process control and achieving higher process maturity levels, there are very few resources that describe success stories, implementation details, and implemented guidelines for applying SPC to specific metrics.
In this thesis the findings of a case study that is performed for investigating the applicability of SPC to software metrics in an emergent CMM Level 3 software organization are presented. As being one of the basic and most sophisticated tools of SPC, control charts are used for the analysis. The difficulties in application of Statistical Process Control to a CMM Level 3 organization are observed by using the existing data of defect density, rework percentage, productivity and review performance metrics and relevant suggestions are provided for dealing with them.
iv
Finally the analysis results are summarized and a guideline is prepared for software companies who want to utilize control charts by using their existing metric data.
Key Words: Statistical process control, control charts, software, CMM, case study, defect density, productivity, review performance, rework percentage.
v
ÖZET
İSTATİSTİKSEL SÜREÇ KONTROLÜNÜN KONTROL GRAFİKLERİ KULLANILARAK YAZILIM SÜREÇLERİNE UYGULANMASI
Sargut, Kamil Umut
Yüksek Lisans, Bilişim Sistemleri Bölümü Tez Yöneticisi: Doç. Dr. Onur Demirörs
Mayıs 2003, 124 sayfa
İstatistiksel Süreç Kontrolünün (İSK) yazılım süreçlerine uygulanması, yazılım mühendisleri ve araştırmacılar için önemli bir konu olmuştur. İstatistiksel Süreç Kontrolü, süreç kontrolünü sağlamak ve yüksek olgunluk seviyelerine ulaşmak için tavsiye ediliyor olsa da, belirli metrikler için başarı öykülerini, uygulama ayrıntılarını ve uygulanmış prosedürleri anlatan çok kısıtlı kaynak vardır.
Bu tezde, İSK’nın yazılım metrikleri için kullanılabilirliğini araştırmak amacıyla CMM seviye 3 olmuş bir yazılım firmasında yapılan durum çalışmasının sonuçları sunulmaktadır. Bu amaçla İSK’nın temel ve en gelişmiş araçlarından biri olan kontrol grafikleri üzerinde çalışıldı. Hata yoğunluğu, tekrarlanan iş yüzdesi, üretkenlik ve gözden geçirme performansı metriklerinin varolan verisiyle İSK uygularken karşılaşılan zorluklar gözlemlenip onlarla ilgili çözüm yolları önerildi. Son olarak analiz sonuçları özetlenerek kontrol grafiklerini kullanmak isteyen yazılım firmaları için bir yol haritası hazırlandı.
vi
Anahtar Kelimeler: İstatistiksel süreç kontrolü, control grafikleri, yazılım, CMM, durum çalışması, hata yoğunluğu, üretkenlik, gözden geçirme performansı, tekrarlanan iş yüzdesi.
vii
TO
viii
ACKNOWLEDGEMENTS
I send my kindest regards and thanks to Mr. Demirörs for bringing about my affection to academic research and supporting endlessly during my graduate study.
I am grateful to İ.B., S.D., T.T.T., S.Y., S.N. and all other company personnel for their help and cooperation. And very special thanks to A.T. for her tremendous assistance, cheering sympathy and friendship during the case study.
I would like to express my sincere thanks to my family for always trusting me and tolerating all my fancies in the stressful days.
Most of all, I had the deepest emotions motivating me through long nights and days. Zeynep… I would never last during the hardest days in my life without you. Nothing to say, but thank you …
ix
TABLE OF CONTENTS
ABSTRACT...iii ÖZET ...v TO ...vii ACKNOWLEDGEMENTS...viii TABLE OF CONTENTS...ix LIST OF TABLES...xiiLIST OF FIGURES ...xiii
LIST OF ABBREVIATIONS...xvi
CHAPTER 1. INTRODUCTION ...1
1.1. Difficulties and Benefits of SPC in Software Development ...2
1.2. Utilization of SPC in Software ...4
1.3. Roadmap ...5
2. STUDY BACKGROUND...7
2.1. Statistical Process Control ...7
2.1.1 Concept of Variability in Processes...13
2.1.2 Statistical Control ...14
2.1.3 Shewhart Control Charts...14
3. RELATED LITERATURE ...19
x
3.2. SPC in Software Development ...24
3.3. Contribution of Literature to Our Study ...27
3.4. Measurement Background ...28
3.4.1 Some Preliminary Issues about Defect ...29
3.4.2 Some Preliminary Issues about Size...32
3.4.3 Rework Effort ...36
3.4.4 Defect Density ...43
3.4.5 Productivity...46
3.4.6 Inspection Performance ...51
4. CASE STUDY...57
4.1. Fundamentals of the Case...57
4.2. Case Analysis...62
4.2.1 Rework Effort Analysis ...63
4.2.2 Defect Density Analysis ...75
4.2.3 Productivity Analysis...91
4.2.4 Peer Review Performance Analysis...92
4.3. Analysis Results...101
5. SUGGESTED SPC GUIDELINES ...103
5.1. General Comments and Suggestions ...103
5.2. Rework Effort ...105
5.3. Defect Density ...106
5.4. Productivity...108
5.5. Review Performance...109
6. CONCLUSION AND FUTURE WORK ...111
xi 6.2. Future Work...113 REFERENCES … ...115 APPENDICES … ...119 A. STATEMENT OF WORK ...120 B. MEETING SCHEDULE...124
xii
LIST OF TABLES
TABLE
3.1 Defect Count...44
4.1 Candidate Measures...61
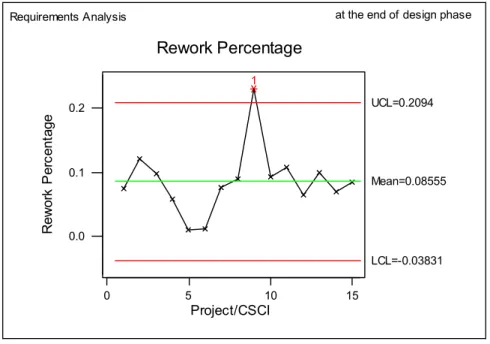
5.1 Sample Defect Density (Priority 1 - Requirements Documents- end of design phase) ...108
A.1 Milestones...121
A.2 Allocated Resources ...123
xiii
LIST OF FIGURES
FIGURE
2.1 Sample Metric Datasheet...8
2.2 Sample Cause-and-Effect Diagram ...9
2.3 Sample Scatter Diagram ...9
2.4 Sample Run chart...10
2.5 Sample Histogram ...11
2.6 Sample Bar Chart...12
2.7 Sample Pareto Chart ...12
2.8 Sample Control Chart ...17
3.1 CMM Maturity vs. Rework and Product Quality ...37
3.2 Sample Individuals Chart for Rework Percentage (Phase based) ...40
3.3 Sample Individuals Chart for Rework Percentage (Monthly) ...41
3.4 Sample Individuals Chart for Rework Percentage...43
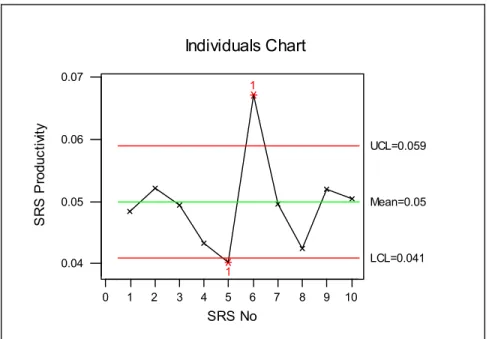
3.5 Sample Individuals Chart for SRS Productivity...50
3.6 Defect Cost Ratio...52
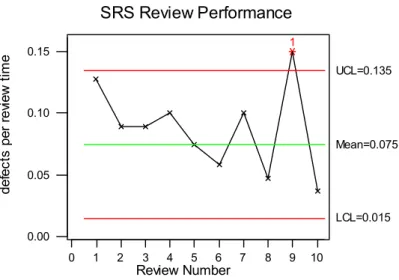
3.7 Sample Individuals Chart for Review Performance ...56
4.1 Organizational Documentation Rework ...65
4.2 Organizational Coding Rework ...66
4.3 Project 1 Coding Rework...66
xiv
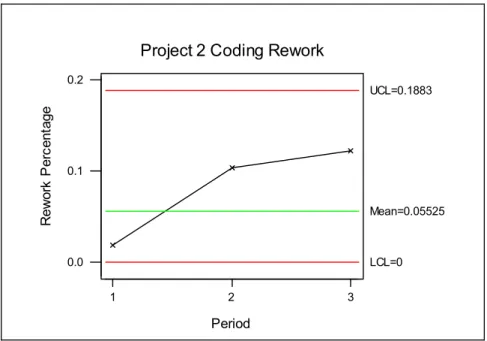
4.5 Project 2 Coding Rework...68
4.6 Project 2 Documentation Rework...68
4.7 Project 3 Coding Rework...69
4.8 Project 3 Documentation Rework...69
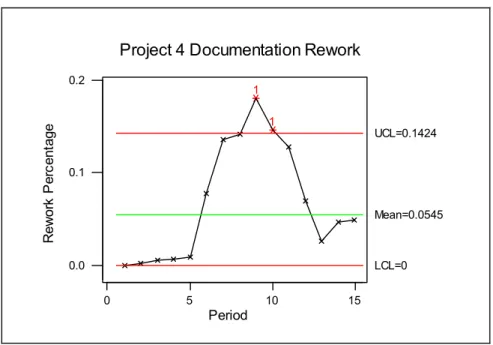
4.9 Project 4 Documentation Rework...70
4.10 Project 5 Coding Rework...71
4.11 Project 5 Documentation Rework...72
4.12 Project 6 Documentation Rework...73
4.13 Project 7 Coding Rework...73
4.14 Project 7 Documentation Rework...74
4.15 u-chart (Defect Density for Requirements Documents) ...78
4.16 u-chart (Defect Density for Design Documents) ...79
4.17 Defect Density Group 2 Implementation (Requirements Documents)...80
4.18 Defect Density Group 2 Maintenance (Requirements Documents) ...81
4.19 Defect Density Priority 3 Implementation (Requirements Documents)....82
4.20 Defect Density Group 3 Maintenance (Requirements Documents) ...82
4.21 Defect Density Implementation (Requirements Documents – All Priorities) ...83
4.22 Defect Density Maintenance (Requirements Documents - All Priorities) 84 4.23 Defect Density Group 2 Implementation (Design Documents) ...85
4.24 Defect Density Group 2 Maintenance (Design Documents) ...87
4.25 Defect Density Group 3 Implementation (Design Documents) ...87
4.26 Defect Density Group 3 Implementation (Only SDD) ...88
4.27 Defect Density Group 3 Maintenance (Design Documents) ...89
xv
4.29 Defect Density Maintenance (All Priorities - Design Documents) ...90
4.30 SDD Final Peer Review Individuals Chart...95
4.31 SDD Draft Peer Review Individuals Chart...96
4.32 UTD Final Peer Review Individuals Chart...97
4.33 UTD Final Peer Review Individuals Chart (Limits Adjusted) ...98
4.34 UTD Draft Peer Review Individuals Chart ...98
4.35 UITD Peer Review Individuals Chart (Draft + Final) ...99
4.36 SRS Peer Review Individuals Chart (Draft + Final) ...100
xvi
LIST OF ABBREVIATIONS
AIL: Action Item List
BMI: Backlog Management Index CEO: Chief Executive Officer CL: Control Limit
CMM: Capability Maturity Model
CMMI: Capability Maturity Model Integration CoSQ: Cost of Software Quality
CPU: Central Process Unit
CSCI: Computer Software Configuration Item CUSUM: Cumulative Sum
DCR: Document Change Request FP: Function Point
IDD: Interface Design Description
IRS: Interface Requirements Specification LCL: Lower Control Limit
NASA: National Aeronautics and Space Administration PA: Process Attribute
PMBOK: Project Management Body of Knowledge PR: Problem Report
xvii SDD: Software Design Description SLOC: Source Lines of Code SOW: Statement of Work SPC: Statistical Process Control
SPICE: Software Process Improvement and Capability Determination SRS: Software Requirements Specification
TDCE: Total Defect Containment Effectiveness UCL: Upper Control Limit
UITD: Unit Integration Test Description UTD: Unit Test Description
1.
CHAPTER 1
….INTRODUCTION
The influence of software technologies on our daily life has grown exponentially during the last two decades. From a simple digital clock to telecommunication networks, software is extensively used to ease our way of living. Thus software can be regarded as “the gate to future” as it provides the basis for much of the technological advance in this century.
If we look at the history of software at a glance, we see that there is a rapid improvement in this sector since 1960s. However, software industry is quite young compared to manufacturing industries. After the industrial revolution, the manufacturing industry has come up to a level of stability, and the idea of continuous process improvement has been accepted throughout the world. In software, however, the improvement trend is too steep and organizations still strive for achieving a high level of maturity. Moreover, the characteristics of software make it complex and invisible, which make it difficult to apply the practices that are in use in other industries.
One of these common practices in manufacturing industry is statistical process control. The investigation on quantitative mechanisms as an aid to control process variation gave rise to the application of SPC since 1930s [1]. The idea of applying SPC to software development, however, is brought mainly by Capability Maturity Model (CMM) in mid 90s. Although its benefits are accepted for manufacturing companies, there have been many debates about its application in software development ([2], [3], [4]).
1.1. Difficulties and Benefits of SPC in Software Development
As Card [2] points out, SPC is founded on the principle that a process will demonstrate consistent results unless it is performed inconsistently. Thus, we can define control limits for a consistent process and check new process outputs in order to determine whether there is a discrepancy or not.
In the manufacturing arena, it is not difficult to figure out the relationship between product quality and the corresponding production process. Therefore we can measure process attributes, work on them, improve according to the results and produce high quality products. There is a repetitive fabrication of the same products in high numbers and this brings an opportunity to obtain high sample size for the measured attributes. Moreover, the product is concrete, and the attributes and variables to be measured are easily defined. Consequently, the only difficulty left is to define correct attributes and collect data for utilizing the tools of Statistical Process Control.
On the other hand, software product is difficult to characterize. As it is not concrete, it is difficult to recognize the correlation between a single software process and the quality of the related software product. Crosby [5] defines quality as conformance to customer requirements. In addition, Lantzy [4] indicates that a software process must be assessed based on its capability to develop software that is consistent with user’s requirements. Actually, there is no specific software measure showing the extent to which customer requirements are met. However, there are processes and products that influence production life cycle. By measuring specific characteristics of these processes and products, we can have an idea about the quality of the final product.
One other difficulty in software production is that, there is not a repetitive production. Each product is distinct and possesses different characteristics. For this reason, it is usually not possible to form a sample of n measurements. In this case, we shall take care of each single measurement, and perform the analysis accordingly.
Beside these general software process characteristics, software measurement is also a very complicated process. Each metric requires different measurement
techniques and the reliability of the metric data depends on how well the metric is defined, how properly the data collection procedures are performed and how robust the measures are with respect to varying environmental conditions. As the metrics are usually abstract, the interpretation of the data necessitates good judgment. Since the metric data are collected by regular project individuals a firm understanding of metrics should be provided for data validity.
Despite the mentioned difficulties, it may still be possible to apply Statistical Process Control to software processes. However, special consideration shall be given to the establishment of relevant mechanisms to gather beneficial outcomes. First of all, the key processes that need statistical control should be identified. Not every process needs statistical control, nor is related to organizational goals and process performance objectives. The variability may be inherently existent in the process, undermining the idea of using SPC. Moreover, it may not be economically and technically feasible to apply statistical control to some of the processes. SPC necessitates process stability for meaningful data analysis; thus the selected processes should have well-prepared process definitions.
Secondly, relevant measures for the selected processes should be defined. These measures should be informative about the desired process/product characteristics. For this reason, the relationship between the measure and the process/product it represents should be clearly understood. Moreover, it is critical to provide repeatability in measurement practices and consistency in the measured data. Therefore, relevant data collection mechanisms should be described in detail; and manual or automated means for data collection should be constructed. A database should also be created to accommodate the data as a baseline for the derivation of control limits within the organization.
Most of the times, the collected measure cannot be used directly in SPC analysis as some inherent parameters influence the generation of the data. Thus, it is essential to normalize the raw measures. These normalization procedures should be described in order to provide a consistent basis for meaningful comparison among different process instances. Meanwhile, relevant statistical techniques, control chart categories, and interpretation approaches should be identified.
Finally, these techniques should be utilized first to find and correct special causes, and then to visualize and improve processes.
If supported with reasonable data, necessary infrastructure and human resources, Statistical Process Control can be appropriately applied to gather beneficial information for software processes. First of all, the processes can be monitored with the establishment of process capability baseline and the process outcomes become predictable. Unpredicted behavior can be detected and necessary corrective actions can be implemented on time. As the process describes the way a product is produced, the quality of the product can be deduced from the related process and this enables the organization to produce high quality products by controlling the processes. After stability is achieved and special causes are removed, process improvement activities can be tracked through the analysis of common causes. The results of improvement actions can also be evaluated with the comparison of past and current conditions statistically.
1.2. Utilization of SPC in Software
The interest to apply SPC techniques in the software industry has been growing during the last decade as more organizations advance in maturity levels of process improvement models such as Capability Maturity Model (CMM) [6], Capability Maturity Model Integration (CMMI) [7] and SPICE ([8], [9]). These models implicitly direct software companies to implement SPC as a crucial step for achieving higher process maturity levels. They suggest control charts for both project level process control and organizational level process improvement purposes. In the literature, there are several resources on the usage of statistical techniques in software development ([2] - [4], [6], [10] - [19]). Some researchers contribute to this trend by providing approaches to utilize SPC techniques for software industry ([10], [12] - [16]). Moreover, most of the examples ([10], [12] - [16], [17], [19], [20]) exhibited in the studies refer to defect and inspection data [21]. These studies however, focus on the potential benefits of SPC implementation, rather than providing a satisfactory guideline for software firms to implement SPC techniques with convincing information. We specifically lack
knowledge on the applicability of different metrics, the means of reliable data collection mechanisms, meaningful analysis approaches and practical evidence. In this study, we investigated how SPC can be effectively applied to the processes of a software firm by using its existing measures. In order to visualize SPC implementation in real time, we performed a case study in an emergent CMM Level 3 software organization. After selecting a number of metrics, we performed a theoretical study to recognize metric basics and data analysis mechanisms. By working on the metric data, we established normalization procedures and translated the metric data to a form that is appropriate for comparison among different projects and products. As control chart is one of the most sophisticated data analysis tools within SPC, we demonstrated practical evidence on the utilization of SPC via control charts. Finally, we prepared a guideline for software companies in order to apply SPC techniques successfully and obtain the greatest benefits from an SPC implementation.
1.3. Roadmap
In Chapter 1, we give an introduction about our study and present the basics of our analysis. In Chapter 2, we establish an overall understanding on Statistical Process Control; we describe the methods used in statistical process control including check sheets, cause-and-effect diagrams, scatter diagrams, run charts, histograms, bar charts and pareto charts. Then we describe the concept of process variability and focus on control charts as a sophisticated SPC technique.
In Chapter 3, we investigate the extent to which SPC techniques are necessary and/or sufficient to conform to industrial software standards such as CMM, CMMI, SPICE, ISO 9000-3. We also highlight some of the software process guidelines and find out the clauses related to statistical methods. Then we cite several papers and books mentioning Statistical Process Control as an aid to visualize the evolution of SPC techniques in the industry. After summarizing the findings that inspired us during our study, we outline the difficulties related to the metrics that we worked on during the case study, make suggestions for proper metric analysis and describe means of using control charts.
Chapter 4 is devoted to our case study. We first give the reasons for selecting a case study and describe the fundamentals of our specific case. Then we focus on each metric separately and explain company-specific issues related to relevant software processes, measurement and data collection procedures. We also present details about our experiences while implementing SPC to metric data. Finally we summarize our analysis results.
In Chapter 5, we present our suggestions for a software firm as a guideline for achieving successful SPC implementation to the metrics that we handled during our case. In Chapter 6, we summarize our study, portray our overall findings and describe potential research opportunities on this subject.
2.
CHAPTER 2
….STUDY BACKGROUND
2.1. Statistical Process Control
Statistical Process Control (SPC) is a methodology that aims to provide process control in statistical terms. Since the great industrial revolution in Japan, SPC has been widely used in manufacturing industries in order to control variability and improve processes [1]. The basic tools used for statistical control are ([21], [23]):
• Check Sheet • Cause-and-Effect Diagram • Scatter Diagram • Run Chart • Histogram • Bar Chart • Pareto Chart • Control Chart Check Sheet
Check sheets are good means for collecting data efficiently, reliably and easily. As the detail and characteristics of data are different, check sheets are designed specifically considering the particular needs. In software industry, metric
datasheet is in form of a check sheet, which is used to collect measurement data. Although automated measurement techniques minimize the human interaction for data collection, metric datasheets are still used extensively in order to represent the data in the desired format. A sample metric datasheet is depicted in Figure 2.1.
Defect Density
Project Name:
Date Software Component SLOC Number of Defects Defect Density
Figure 2.1 Sample Metric Datasheet
Cause-and-Effect Diagram
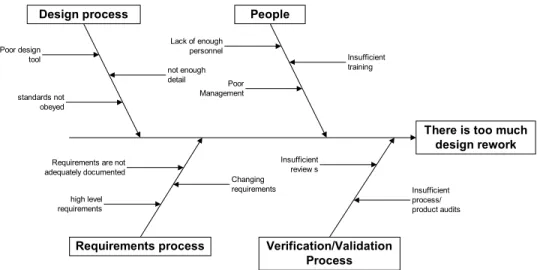
Cause-and-Effect Diagrams are useful tools to visualize, categorize and rank potential causes of a problem, a situation or any outcome. They are also named as fishbone diagrams because of their shapes and are usually formed as a result of a discussion or a brainstorming session of a group of people. A sample Cause-and-Effect Diagram can be seen in Figure 2.2.
Scatter Diagram
In order to draw a Scatter Diagram, data for two variables are collected in pairs (xi, yi), and each point yi is plotted against corresponding xi. This is a useful plot
for identifying a potential relationship between two process characteristics. A pattern in the plotted points may suggest that the two factors are associated, perhaps with a cause-effect relationship. Moreover, scatter diagrams may be used for regression analysis if the necessary assumptions are satisfied. A sample Scatter Diagram can be seen in Figure 2.3.
There is too much design rework Design process Requirements process People Verification/Validation Process Poor design tool Lack of enough personnel Insufficient training Poor Management
Requirements are not adequately documented Changing requirements high level requirements Insufficient review s Insufficient process/ product audits not enough detail standards not obeyed
Figure 2.2 Sample Cause-and-Effect Diagram
Scatter Diagram 0 10 20 30 40 50 60 0 1 2 3 4 5 6 7 8 9 Review Hours # o f D ef ect s
Run Chart
Run Charts are specialized, time-sequenced form of scatter diagrams that can be used to examine data quickly and informally for trends or other patterns that occur over time. They dynamically observe performance of one or more processes over time. They look like control charts, but without the control limits and center line. They are useful for visualizing performance after a process change.
In Run Charts, there should be at least 20-25 points and y axis should be 1 ½ times the range expected [17]. A sample Run Chart is given in Figure 2.4.
Run Chart 0 5 10 15 20 25 30 35 1 2 3 4 5 6 7 8 9 10 11 12 13 14 15 16 17 18 19 20 21 22 23 24 25 Instance De fe ct s/ KL O C
Figure 2.4 Sample Run chart
Histogram
Histograms show the frequency distribution of data in a sample. The first step to draw a histogram is to categorize the data into classes with equal ranges. Data sets with a large number of elements usually require a larger number of classes, whereas smaller data sets require fewer classes. As a rule of thumb, the number of
classes should be between 5 and 15. Then the number of data in each cell is found and depicted with bars on the graph (see Figure 2.5). The data represents the state of a system at a certain time; thus there is no time dimension. These charts are quite practical to visualize central tendency and skewness of the measured attribute.
Histogram
0 5 10 15 20 25 30 1 4 7 10 13 16 19 22 25 28 More Days OpenFigure 2.5 Sample Histogram
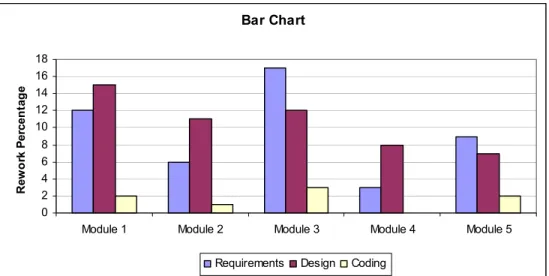
Bar Chart
Bar charts are like histograms. But they are not only used for depicting the frequencies of occurrences, but also for showing any numerical value of the attribute. A sample bar chart can be seen in Figure 2.6.
Pareto Chart
Pareto chart is another form of bar chart. However, the occurrences are ordered with respect to their frequencies (see Figure 2.7). Pareto charts are good means to visualize the ranking of an attribute among different categories.
Bar Chart 0 2 4 6 8 10 12 14 16 18
Module 1 Module 2 Module 3 Module 4 Module 5
R ew o rk P er ce n tag e
Requirements Design Coding
Figure 2.6 Sample Bar Chart
Pareto Chart 0 5 10 15 20 25 30 Softw are Requirements
Coding Testing System Requirements Softw are Design System Design Project Phase R ew o rk P er ce n ta g e
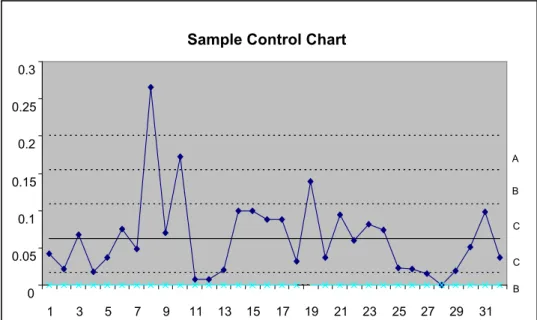
Control Chart
Control Charts are sophisticated statistical data analysis tools, which include upper and lower limits to detect any outliers. They are frequently used in SPC analyses and will be described in detail in the following sections.
2.1.1 Concept of Variability in Processes
In 1920s, W. A. Shewhart was working on the idea of quality control and he brought the idea that each process is driven by forces of variation [24]. However, variation results in loss of quality by causing inefficiency and waste. If we can understand the sources of variation, we can take necessary actions to remove inefficiency, and increase quality.
If we think of variation in software industry, source lines of code produced a day can be considered as a variable parameter. Either if the same person produces SLOC for the same component, the amount of time he spends will be different from one day to the other. This can be explained as the variation in a process attribute.
According to Shewhart [24], variation in a process has two types of causes: assignable causes and chance causes. Assignable causes appear in unexpected periods and can be fixed by immediate actions. For instance, if a new tool is being used for coding, the productivity of the coder may be lower during adaptation period. When this is realized, a training program can be implemented to improve productivity.
On the other hand, chance causes are the results of the system itself (Deming [25] refers them as Common Causes). They are naturally existent within the defined processes and can only be avoided by performing improvement programs. If we think of a software engineering firm that has no reusable code library, we witness that similar code pieces are written separately in each new application and this causes delays due to rework. Such a chance cause can be prevented by creating a reusable code library.
2.1.2 Statistical Control
Control means predictability. If the variation in the behavior of a process is predictable in statistical terms, that process is said to be in control. This means that, we can expect (within certain limits) what the outcome will be the next time we perform the same process. In this way, we can prepare more accurate project plans, do better cost estimations and schedule activities in more reasonable basis. In order to calculate the variance in process behavior, several attributes or variables representing the outcomes of the process shall be defined. The number of defects found during unit testing, the number of requirements that are changed after requirements analysis phase, amount of CPU utilized to perform a specific application may all be used to understand the behavior of the processes they represent. The variability in process behavior, then, can be tracked through these measures.
The aim of Statistical Process Control is: firstly to detect assignable causes of variation in the processes and provide process control; secondly to enable monitoring of the improvement in processes (that are already under statistical control) by demonstrating the chance causes; and Shewhart Control Charts are good means to achieve Statistical Process Control.
2.1.3 Shewhart Control Charts
During his studies at Bell Labs in 1920s, Shewhart proposed that it is possible to define limits within which the results of routine efforts must lie to be economical. Deviations in the process outcomes resulting in values out of these limits indicate that the process is not performed economically. In order to detect assignable causes, Shewhart utilized statistics and control charts [24].
Shewhart control chart model depends on hypothesis testing. First of all, a sample of data (sufficient enough to represent the whole) is collected for the subject measure (i.e. number of defects in a piece of code). Then, its mean and variance are calculated. The lower and upper control limits are derived and data is analyzed using the statistical evidence on hand. By analyzing the data values with respect to upper and lower control limits together with their location in the zones, assignable
causes are detected. Then necessary actions are taken and measurements are repeated. The charts are redrawn with the existing data values, and this process is repeated until no evidence remains for the existence of assignable causes. Once the process is brought under control, further improvement activities are implemented to minimize the effect of common causes.
The measurement can be performed by means of either variables or attributes. Burr and Owen [10] define a variable as “measure of a product that can have any value between the limits of the measurement”, while an attribute as “count of things which may or may not be present in the product”. The nature of these two measurement categories necessitates different statistical analyses. A variable normally has normal probabilistic distribution, whereas it is likely to be binomial for an attribute.
Statistical analysis may be performed by implementing X and R charts for sample data. When variable measures are individual data points, Individuals Charts are mostly utilized. (Exponentially weighted moving average charts and CUSUM (cumulative sum) charts are also used for this aim.)
The limits for an Individuals Chart are calculated as:
UCL = X + 3 2 d R M LCL = X - 3 2 d R M
where X is the average of individual values, MRis the average of moving ranges and d2 is a constant which depends on the number of individual values that
moving range is calculated [23]. If the moving range is calculated for 2 consecutive data values, d2 takes the value of 1.128.
Moving range charts are also frequently used as complementary to Individuals Charts. For this reason, these charts together are referred as XmR Charts. As subsequent moving range values are correlated, patterns of cycles or runs are natural for the range charts. However, these charts are especially useful to view trends in the process.
The attribute measures are defined in sense of “presence or absence” (i.e. the number of defects) [1]. The fraction of defectives in a sample can be explained with a binomial distribution and p-chart is drawn to investigate statistical control. The other major charts that may be utilized for the analysis of attribute data are the following:
np charts: When we want to work on the number of defectives instead of the fraction.
c-charts: If we want to emphasize the number of defects (of a certain type). u-charts: If we want to emphasize the number of defects per unit.
The limits for u-chart are calculated as:
∑
∑
= i i n d u UCL/LCL = i n u u±3 where,di: number of defects for measurement i
ni: sample size for measure i
Shewhart charts are good indicators for detecting out-of-control situations in a process. For ease of understanding, the charts are divided into zones (A, B and C), which represent values of “Mean ± 1/2/3 Standard Deviation” as seen in Figure 2.8.
Figure 2.8 Sample Control Chart
Sutherland [1] has suggested the following test conditions for detection of violations in process control:
1) Extreme Points (Data beyond control limits) 2) Two out of Three points in zone A or beyond 3) Four out of five points in zone B or beyond 4) Eight or more runs above or below the mean 5) 6 successive points
6) 14 successive points oscillate up and down 7) 8 successive points not in Zone C
8) 15 successive points in zone C
These test conditions are applicable for different charts and give us evidence for deviation. By considering the nature of the process, the chart type, data
Sample Control Chart
0 0.05 0.1 0.15 0.2 0.25 0.3 1 3 5 7 9 11 13 15 17 19 21 23 25 27 29 31 A B C C B
characteristics, current environmental conditions and other external factors, the process should be analyzed with the interpretation of the charts.
3.
CHAPTER 3
….RELATED LITERATURE
Human kind has always felt the need to evaluate tangible and intangible objects and processes. From the weight of sugar to the intensity of love (via love tests), we use measures in every aspect of our lives. Fenton [26] defines measurement as “the process by which numbers or symbols are assigned to attributes of entities in the real world in such a way as to describe them according to clearly defined rules”. Here an entity stands for a process or a product whereas an attribute is a feature of the entity.
Software industry is not an exception and the intangible structure of software further increases the importance of measurement. For this reason, software measurement has been in concept of many authors, researchers and software engineers since late 1960s [5]. Today, statistical techniques begin to act as a supportive tool for the representation and analysis of measurement data with the enforcement of new trends. Moreover, the industrial standards and guidelines recommend utilization of different statistical techniques for successful process management. Among all the statistical techniques, the interest to apply SPC techniques in the software industry has also been growing during the last decade as more organization advance in maturity levels of process improvement models such as Capability Maturity Model (CMM) [6], Capability Maturity Model Integration (CMMI) [7] and SPICE ([8], [9]). These models implicitly direct software companies to implement SPC as a crucial step for achieving higher process maturity levels. They suggest control charts for both project level process
control and organizational level process improvement purposes. Many researchers contribute to this trend by providing approaches to utilize SPC techniques for software industry ([10] - [15]). Moreover, most of the examples exhibited in the studies refer to defect and inspection data ([10], [12] - [14], [17], [19], [20]). These studies however, focus on the potential benefits of SPC implementation, rather than providing a satisfactory guideline for software firms to implement SPC techniques with convincing practical evidence. We specifically lack knowledge on the applicability of different metrics, the means of reliable data collection mechanisms, meaningful analysis approaches and practical evidence. Nevertheless, the literature is very scarce in terms of practical experiences in application of statistical techniques in contrast to measurement.
In the following section we will investigate the place of statistical techniques in terms of necessity and sufficiency within industrial software standards such as CMM, CMMI, SPICE, ISO 9000-3. We will also go over some of the software process guidelines and try to make a connection between statistical methods and good software practices. In the second section, we will demonstrate our findings for the literature about the application of Statistical Process Control to software domain as an aid to visualize the evolution of SPC techniques in the industry. We will also mention about relevant citations that leaded us throughout our study with their content on measurement and SPC in general. Then we will summarize the current state of SPC techniques in the academic and industrial environments. Finally, we will go over each metric that we worked on during the case study and explain the fundamental issues regarding definition, analysis and interpretation of metrics.
3.1. Standards and Guidelines
A standard is a rule or basis for the comparison that is used to assess the size, content, value, or quality of an object or activity [20]. Thus, it defines what characteristics a product or a process shall possess. On the other hand, a guideline is a suggested practice, method, or procedure, typically issued by some authority [20]. Therefore, they lead process owners in performing their work although the rules are not mandatory. In practice, today’s software standards include both
mandatory rules and suggested actions which are prepared by very experienced people in the related domain in long periods of time. Moreover, they evolve over time with the accumulation of new practices, tools, techniques and methodologies. Because of the complexity of processes and the diversity of products, standards play a significant role for software development. And measurement is one of the important processes for which specific regulations are defined within software standards. The horizon of measurement is continuously growing day by day. Accordingly, the newer versions of software standards and guidelines begin to direct software organizations to utilize statistical techniques like reliability analysis, 6-sigma analysis and SPC.
Quantitative Process Management is one of the Level 4 key process areas of CMM [6], which involves establishing goals for the performance of the project's defined software process, taking measurements of the process performance, analyzing these measurements, and making adjustments to maintain process performance within acceptable limits. In the description of Commitment 1, the term "quantitative control" is referred to as any quantitative or statistically-based technique appropriate to analyze a software process, identify special causes of variations in the performance of the software process, and bring the performance of the software process within well-defined limits. Although the control chart is given only as an example for statistical analysis (not mandatory), CMM implicitly supports its utilization by mentioning about calculating mean and variances, identifying control limits and establishing process performance baselines. CMM also necessitates the collection of data from the projects to characterize the process capability in the organizational level. Therefore, the software organizations are trying to use control chart in order to meet the CMM Level 4 requirements.
On the other hand, CMMI [7] analyzes process performance in two process areas: Organizational Process Performance and Quantitative Project Management. The former mentions about establishing process performance baselines for the organization’s standard software processes. The latter aims to quantitatively manage the project’s defined process to achieve the project’s established quality
and process performance objectives. Actually these two process areas work in harmony. The organizational process performance baselines, which are established by the data from all the projects, are used in order to control project level process performances. The project data are then added to the data pool in order to update organizational level process performance baselines.
QPM process area of CMMI aims to statistically manage a project’s defined software processes (Sub-goal 2). CMMI differs from CMM in that it gives more detail about the statistical management. It gives more practical information to the software organizations as it is based on the realization that statistical techniques are not appropriate for all the processes. It necessitates identification of tasks and appropriate measures for those tasks to perform statistical analyses; it defines criteria for selecting the measures, and for determining whether historical data are comparable. Similar to CMM, control chart is given as an example for potential statistical analysis techniques. However, the requirements can best be met by implementing control chart analysis.
Although SPICE is an assessment model, it implicitly provides software organizations a framework to improve their processes ([8], [9]). In SPICE, the analysis is performed in two dimensions: Process Dimension and Capability Dimension. Capability Dimension is divided into 6 levels and Level 4 (Predictable Process) has measurement (PA 4.1) and process control (PA 4.2) attributes. Measurement attribute requires a software firm to analyze trends in process performance and maintain process capability within defined limits across the organization. Similarly, Process Control attribute necessitates control of process performance to maintain control or implement improvement. The idea resembles that of Capability Maturity Model as the software firms are implicitly incited to use control charts.
The importance of quantitative methodologies is mainly because good decision making depends on how much you know about the process and the product. As defined in Metrics Guidebook of NASA [27], knowing what an organization does and how it operates is a fundamental requirement for any attempt to plan, manage, or improve. On the other hand, Tracey O’Rourke, CEO of Allen-Bradley, says
“without the right information, you’re just another person with an opinion.” Thus information is essential for understanding of processes and this leads to better management as soon as the information is valid.
In order to understand the need for measurement in project management, we can look at Project Management Body of Knowledge [30]. It defines project management as: “the application of knowledge, skills, tools and techniques to project activities in order to meet project requirements”. It investigates project management in nine knowledge areas and five process groups. PMBOK describes inputs, outputs, and relevant tools and techniques for the major processes in the knowledge areas in order to aid as a guideline for project managers. If we analyze Project Quality Management knowledge area, we see that control charts, pareto diagrams, statistical sampling and trend analysis are referred as techniques for Quality Control process. As PMBOK is a guideline, it does not have any obligatory nature for the software firms. However, it provides useful practices for good project management and SPC techniques are also recommended within this guide.
We see that CMM (Capability Maturity Model), its new version CMMI (Capability Maturity Model Integration), and SPICE implicitly direct software companies to implement Statistical Process Control as a crucial step for achieving higher process maturities. They suggest control charts for both project level process control and organizational level process improvement purposes. The traces of SPC are also found in software process guidelines such as PMBOK and NASA measurement guidelines. Actually, it is possible to utilize SPC methodologies to comply with some other software standards such as ISO 9000-3 [29], which requires determination of applicable statistical methods to monitor, measure and analyze the processes. This trend shows that software community has high expectations from statistical applications of SPC techniques. As seen, the results of practical SPC applications in the industry will be designative for its place in the future.
3.2. SPC in Software Development
As Card [2] points out, SPC and other measurement based techniques are based on the assumption that the organization has defined processes. Thus, before starting to work on the application of SPC techniques, it is essential to have an understanding about the measurement processes and metrics. Fortunately, software area has extensive resources on measurement processes. Fenton and Pfleeger [26] provide valuable information by considering the whole life cycle of measurement from planning to data analysis in a software organization. They also define the basics of some mostly used metrics and provide empirical information in software organizations.
Humphrey [20] can be regarded as a reflection of quality management on software engineering discipline. He describes a framework for software process management, outlines the actions to provide higher maturity levels and acts as a basic guide to improve processes in a software organization. In this book, Statistical Process Control appears as a means of data analysis technique for level 4 organizations. Humphrey emphasizes that measures should be robust, suggest a norm, relate to specific product and process properties, suggest an improvement strategy and be a natural result of the process. He also mentions that it is essential to have a model, but believing it too implicitly can be a mistake.
As SPC is more regarded in software industry, additional studies are being performed by the researchers. Lantzy [4] presents one of the earliest studies on the debate of applying Statistical Process Control to software processes. In this paper, he summarizes the concept of SPC and gives some practical examples from manufacturing industry. Then he offers a set of transformations on these principles via software quality characteristics revealing the uniqueness of software products. After giving the process-product relationship, he outlines a seven-step guideline for successful SPC implementation in a software organization. This study reveals four important points for the application of SPC to software processes:
• Metrics should correlate to the quality characteristics of the products that are defined by the customer
• Metrics should be selected for the activities that produce tangible items
• SPC should be applied only to critical processes
• The processes should be capable of producing the desired software product Card [2] discusses the utilization of SPC for software by also considering some of the objections and mentioning about possible implementation problems. He gives an example control chart for testing effectiveness measure and concludes that SPC principles can be beneficial for a software organization although formal statistical control techniques may not be used.
Kan [3] provides detailed information about software metrics, software reliability models, and models and analysis of program complexity. The book also includes examples from real-life practices and presents empirical knowledge to the software community. The author emphasizes the difficulty in achieving process capability in software domain and is cautious about SPC implementation. He mentions that the use of control charts can be helpful for a software organization especially as a supplementary tool to quality engineering models such as defect models and reliability models. However, it is not possible to provide control as in manufacturing since the parameters being charted are usually in-process measures instead of representing the final product quality. The final product quality can only be measured at the end of a project as opposed to the production in manufacturing industry, so that on-time control on processes becomes impossible. He also underlines the necessity of maturity for achieving process stability in software development. Finally, he brings a relaxed understanding by stating that the processes can be regarded in control when the project meets in-process targets and achieves end-product quality goals.
Burr and Owen [10] describe the statistical techniques currently available for managing and controlling the quality of software during specification, design, production and maintenance. This book is one of the very few resources in the area as it is a full reference on statistical methods from technical background of statistics and measurement to managerial concerns in software industry. The main focus is given to control charts as beneficial SPC tools and guidelines are
provided for measurement, process improvement and process management within software domain.
A similar work is performed by Florac and Carleton [12]. They represent CMM understanding on the utilization of Statistical Process Control for software process improvement. The book includes detailed technical information about SPC and provides a roadmap for SPC implementation. It mostly focuses on the benefits of control charts depending on Shewhart’s principles [24]. It also discusses some issues related to the application of control charts in software development and incorporates the experience gained from manufacturing industries to software processes.
Radice [17] describes SPC techniques constrained within software domain and gives a detailed tutorial by supporting his theoretical knowledge with practical experiences. He states that all SPC techniques may not be applicable for software processes and gives XmR and u charts as possible techniques. He also explains the relevance of SPC for CMM Level 4 and regards back-off of control charts in Level 4 as a mistake. He states five problems with control charts: too much variation; unnecessary use of control charts; lack of enough data; lack of specification limits from the clients; the idea that control charts cannot be used with software processes.
Weller [19] provides a distinct study by presenting the SPC implementation details from a software organization. In order to regard defect density as an indicator of product quality, he first wants to be sure that inspection process is stable in the organization. He uses X and moving range charts for the lines of code inspected per hour for each inspection and achieves a stable inspection process after removing the outliers from the dataset. Then he draws u-chart for the defect density data for each inspection. By using these findings, he makes reliable estimations for inspection effectiveness and gains an insight on when to stop testing. This study carries the idea of SPC beyond theory and shows its benefits in providing control of process data and in creating a performance base for making predictions in real application environment.
Jakolte and Saxena [16] move ahead on the idea of 3 sigma control limits and propose a model for the calculation of control limits to minimize the cost of type1 and type2 errors. The foundation of this study is a pioneering one as it questions an accepted practice for control charts and the results of the example studies are encouraging. However, the study is more academic rather than a practical one as it includes too many parameters and assumptions.
3.3. Contribution of Literature to Our Study
After going through the literature we realize that the current trends in software industry designate a movement towards utilization of SPC techniques. In CMM and even more in CMMI, SPC is depicted as a challenge for high maturity organizations. They are also the most detailed resources in terms of providing a guideline for SPC implementation in a software organization.
Apart from the software standards, the studies of researchers in this area also constitute an important part of the literature. One important common point among the researchers is that they all accept the difficulties of using SPC techniques in software domain. And a high majority of them regard SPC as a beneficial tool for controlling processes. While supporting their ideas, they usually refer to de facto experiences in manufacturing industries.
In some of the resources, we come up against examples of SPC for software metric data. Most of these examples are limited to defect density (defects / SLOC) and inspection effectiveness (defects / inspection hour) measurements. However, these studies contain very little information about implementation details. The characteristics that metrics should possess for proper SPC utilization, the categorization of data, the normalization of metric data to make it comparable among projects, and implementation procedures are not described. For instance, the control charts depict defect density data; but the definition of a defect, the type and priority of defects, the definition of SLOC, the components within SLOC counts (reused parts, blank lines, comment lines etc.), and many other small but very important details are not described. Because of these deficiencies, the existing studies are far from being capable of providing sufficient guidelines for
applying SPC techniques to software processes. Nevertheless, one can establish a good understanding of SPC before starting an improvement program in a software organization by reviewing the available literature. In this regard, our survey revealed that:
• SPC is not applicable to all software processes.
• SPC should only be applied to critical processes in a software organization.
• Not all SPC techniques are applicable to software processes.
• The processes should be well-defined and stable so that we can apply SPC techniques successfully.
• SPC techniques are required for achieving CMM Level 4.
• Control chart is the most sophisticated and useful SPC technique.
With these findings, we performed our case study in order to bring new insights on this issue.
3.4. Measurement Background
In order to establish a firm knowledge on the measures, we carried out a theoretical research at the beginning of our case study. We decided to work on rework effort, defect density, productivity and inspection performance metrics after long negotiations with the company (see section 4.1). We outlined the general properties for each measure including its definition, importance in software development, collection principles, various implications of metric information, difficulties in the measurement processes, data analysis guidelines, and possible uses of control charts relevant to the metric. In the following sections we first establish a firm understanding of defect and size measures, which form the basis for the issued metrics. Then we describe our findings that directed our way of analysis throughout the case.
3.4.1 Some Preliminary Issues about Defect
The number of defects in a work product is an important measure as it gives us an intuition about how much the customer will be satisfied (from post-release defects), how much rework will be performed, how efficient our inspection processes work, which processes need improvement, which components of the system are error prone etc. Therefore, defect counts provide evidence not only on the quality of the product, but also on the quality of the related processes.
Before starting to count defects in software products, however, it is important to establish necessary background in order to provide consistency among measurements. First of all, there is not an exact agreement on the meaning of defect in software industry. The terms defect, fault, failure and error are usually used interchangeably. In order to avoid such misconceptions and to establish a universal understanding, IEEE Std 982.2-1988 software standard [30] makes the following definitions:
Defect: a product anomaly. (1) omissions and imperfections found during early life cycle phases, and (2) faults contained in software sufficiently mature for test or operation.
Error: Human action that results in software containing a fault.
Failure: (1) the termination of the ability of a functional unit to perform its required function. (2) an event in which a system or system component does not perform a required function within specified limits. A failure may be produced when a fault is encountered.
Fault: (1) an accidental condition that causes a functional unit to fail to perform its required function. (2) a manifestation of an error in software. A fault, if encountered, may cause failure.
From these definitions, we understand that defect is named as a fault when it is found in software, and a failure occurs when the software malfunctions as a result of a fault. Thus, not every fault results in a failure; and a number of faults together may cause a system/component to fail operation. Actually, it is common to come up against different definitions of these terms in different environments. However,
for ease of understanding, it is appropriate to refer to any software or documentation anomaly as a defect in our analysis.
If we consider an automobile, we see that it may encounter many problems with different criticalities, impacts, repair times and costs. If the breaks do not work properly, the result may be very serious, and even fatal; thus, the car should be repaired as soon as possible. However, a driver may use his car forever although the horn is not functioning. Therefore, a mechanic makes different treatments according to the characteristics of the problems. Software is similar to an automobile in that, each defect has distinctive properties. Not all defects have the same impact, urgency, origination point and cause. For this reason, it is not a good practice to compare software products only by looking at the number of defects without additional information.
In some cases, an anomaly about a functional software requirement might be regarded as a defect, although it may constitute more than one defect with different causes, priorities or sources. For instance, a defect detected by the customer during a qualification test may be recorded as “a new customer cannot be added by using addition function”. From the customer’s perspective, the defect is the inability to save a new customer record. When the problem is investigated, it may be realized that one of the fields (i.e. customer name) has a database connection problem, another field (i.e. customer NO) has a logic error while the confirmation button has a totally distinct problem. If these different defects are not clearly identified, the number of defects will give deviated results.
Another difficulty arises because of the necessity to distinguish between an enhancement and an error. Sometimes change procedures may not be appropriate to distinguish between an enhancement and a defect since both represent a change. Thus, a detailed conceptual analysis will be needed to decide whether a change is a defect or not, and most probably such a practice will not be feasible. Even with relevant change procedures, it will still be difficult to determine the reason of a change because of marketing issues. From the customer’s point of view, a functionality may be regarded as an inherent property, for which there is no need to write an explicit requirement. So when that functionality is not present, he may
be reluctant to accept the product. The developer would not think this way, and may argue against the customer’s intention. Most probably, the change will be performed by the software company considering the market conditions. Such cases are very frequently seen in software industry. And the nature of software development causes difficulties in determining whether such a change is an enhancement or a defect.
Benchmark
We see that, analysis and interpretation of defect requires some preliminary work and a precise understanding of some issues. First of all, a global perception of defect should be retained in order to avoid possible misconceptions regarding the defect definition. Secondly, we should categorize defects and products with respect to specific characteristics up to a certain level for meaningful comparison among metric data. Neither all defects nor all the products are the same. The defects can be grouped by type, priority and impact, whereas the products can be classified within certain product groups such as requirements documents, design documents, code, and test documents. It is still possible to divide groups into subgroups as soon as the data is available and the detailed analysis is feasible. Each software organization should individually determine the level of detail and the categorization of the groups after working on the historical data, determining specific needs and analyzing related processes. IEEE gives a practical framework for the classification of defect data ([31], [32]).
Moreover, the change procedures should be defined well enough to distinguish between an enhancement and a defect. It can be made either by using different processes and forms to implement an enhancement and a defect, or by depicting the type of change explicitly.
Having an understanding on defect origins beside the defective products would also be very beneficial for making a proper interpretation of defects. This information allows us to identify the cause of a defect and take corrective actions to improve the problematic process. A future defect may be a result of any previous process within the lifecycle. Thus, only the number of defects for a product may be misleading in terms of evaluating the quality of the related
process. By recording the origin of each defect, we may extend our analysis to investigate the defect injection potentials of different processes.
3.4.2 Some Preliminary Issues about Size
Size is one of the major and most frequently used metrics in software development. As it depicts the amount of production as a quantitative measure, it enables us to understand different dimensions of software processes and products. We can divide software process artifacts as documents and code. “Source lines of code” is one of the major measures for counting the size of code. However, some complexities make it difficult to measure software size in terms of SLOC [33]. First of all, there are many different definitions of SLOC in different organizations. Source code is composed of different sections like executables, data declarations and comment lines, and deciding which parts to include in counting is a hard issue for the software specialists. However, it is also important to provide consistency among different measurements so that they may be comparable to each other.
Another difficulty arises from the existence of different programming languages. The source lines of code required to perform a function changes from one language to the other. In order to avoid this problem, there are conversion tables that convert the number of lines in one language to the other. However, considering the defect density metric, it is difficult to decide whether to use converted lines or not. If a coding defect is due to a logical error, it would be reasonable to convert all source lines to assembly language. However, if the defect is due to a syntax error, the total lines of code would be more meaningful regardless of the language used.
Today many software tools provide enhanced capabilities for code generation, user interface development and compilation. Without writing a single line of code, it is made possible to create a user interface by dragging and dropping components. Integrated development allows software engineers to share their code with others and productivity is greatly improved. Although these additional features enhance software development, it makes that much difficult to find a concrete measure for quantifying software size. Comparing automatically