Feature Selection Based on Hybridization of
Genetic Algorithm and Particle Swarm Optimization
Pedram Ghamisi,
Student Member, IEEE and
Jon Atli Benediktsson,
Fellow, IEEE
Abstract—A new feature selection approach which is based on the integration of a Genetic Algorithm and Particle Swarm Optimizationis proposed. The overall accuracy ofSupport Vector Machineclassifier on validation samples is used as fitness value. The new approach is carried out on the well-known Indian Pines hyperspectral data set. Results confirm that the new approach is able to automatically select the most informative features in terms of classification accuracy within an acceptable CPU processing time without requiring the number of desired features to be set a priori by users. Furthermore, the usefulness of the proposed method is also tested for road detection. Results confirm that the proposed method is capable of discriminating between road and background pixels and performs better than the other approaches used for comparison in terms of performance metrics.
Index Terms—Hyperspectral image analysis, feature selection, hybridization of GA and PSO, attribute profile, road detection, support vector machine classifier.
I. INTRODUCTION
S
UPERVISED classification techniques classify the input data by partitioning the feature space into decision re-gions, by using a set of training samples for each class. These samples are usually obtained by manual labeling of a small number of pixels in an image or based on some field measurements. Thus, the collection of these samples is expensive and time demanding. As a result, the number of available training samples is usually limited, which is a challenging issue in supervised classification.In [1], it was shown, after a few features, while the number of training samples is kept constant, the classification accuracy actually decreases as the number of features increases. For the purpose of classification, this is referred to the curse of dimensionality [2]. In order to address this issue, the use of feature selection/extraction techniques is of importance.
Feature extraction/selection techniques can be grouped into two categories; unsupervised approaches and supervised ap-proaches. For the purpose of image classification, the latter techniques are preferred since they try to reduce the di-mensionality of the data while maximizing the separability between classes. Nonparametric Weighted Feature Extraction (NWFE) and parametric Decision Boundary Feature Extrac-tion (DBFE) have been used extensively for this purpose. On the other hand, Divergence, Transformed divergence, Bhat-tacharyya distance and Jeffries-Matusita distance are well-known feature selection techniques which have been widely
P. Ghamisi and J. A. Benediktsson are with the Faculty of Electrical and Computer Engineering, University of Iceland, 107 Reykjavik, Iceland (corresponding author, e-mail: [email protected])
This research was supported in part by the Icelandic Research Fund for Graduate Students.
used in remote sensing. For more information for the above-mentioned techniques, please see [1].
Conventional feature selection techniques usually demand many samples in order to estimate statistics accurately. In addition, they are usually based on an exhaustive process for finding the best set of features, and in this case, they are time demanding and their CPU processing time exponentially increases as the number of bands (features) increases. To this extent, a new generation of feature selection techniques is based on evolutionary optimization methods, since they are not based on an exhaustive process and can lead to a conclusion in a faster way. In addition, by considering an efficient fitness function for these methods, they can handle high dimensional data with even a limited number of training samples (ill-posed situations). In particular,Genetic Algorithm
(GA) and Particle Swarm Optimization (PSO) have gained significant attention from researchers. There is an extensive literature regarding the use of GA and PSO for the purpose of feature selection. For example in [3], the authors proposed a SVM classification system which allows to detect the most distinctive features and estimate the SVM parameters by using a GA. In [4], the authors proposed to use PSO in order to select for classification the most informative features obtained by morphological profiles. However, both PSO and GA suffer from a few shortcomings. The main shortcoming of the PSO is the premature convergence of a swarm. The key reason behind this shortcoming is that particles try to converge to a single point, which is located on a line between the global best and the personal best positions. This point is not guaranteed for a local optimum [5]. Another reason could be the fast rate of information flow between particles, which leads to the creation of similar particles. This results in a loss in diversity. Furthermore, the possibility of being trapped in local optima is increased [6]. The main advantage of using the PSO is its simple concept along with the fact that it can be implemented in a few lines of code. Furthermore, PSO also has a memory of past iterations. On the other hand, in GA, if a chromosome is not selected, the information contained by it is lost. However, without a selection operator as in GA, PSO may waste resources on inferior individuals [6]. PSO may enhance the search capability for finding an optimal solution. However, GA has problem in finding an exact solution [7].
In this paper, in order to address the main shortcomings of GA- and PSO-based feature selection techniques and also to take the advantage of their strength, a new feature selection approach is proposed which is based on the integration of the GA and PSO. In order to find the most discriminative features in terms of classification accuracies, the Overall Accuracy (OA) of Support Vector Machine (SVM) classifier
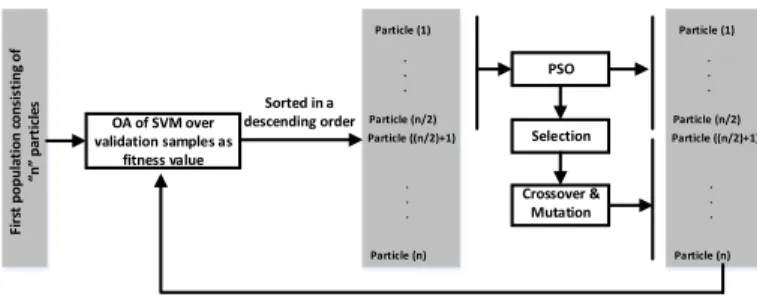
Fi rs t p o p u la ti o n c o n si st in g o f n p art ic le s OA of SVM over validation samples as fitness value Particle (1) Particle (n/2) Particle (n) Particle ((n/2)+1) . . . . . . Particle (1) Particle (n/2) Particle (n) Particle ((n/2)+1) . . . . . . PSO Selection Crossover & Mutation Sorted in a descending order
Fig. 1. A flowchart of the proposed method.
over validation samples is investigated as fitness value. The SVM is selected due to the fact that it is capable of providing acceptable classification accuracies for high dimensional data when even a limited number of training samples is available. In order to evaluate the efficiency of the proposed method, two different scenarios are drawn.
i) In the first scenario, the proposed feature selection ap-proach is performed on a well-known hyperspectral data set, the AVIRIS Indian Pines. Results demonstrate that the new method can significantly increase the classification accuracy of the raw data in an acceptable CPU processing time.
ii) In the second scenario, the proposed feature selection technique is applied on a set of features derived by attribute profiles [8], in order to select the most discriminative features for detecting roads from a background. Results infer that the new feature selection approach is able to detect roads in an complex urban image with an acceptable accuracy.
The paper is organized as follows: The proposed method-ology is discussed in Section II. Section III is devoted to experimental results. Finally, Section IV outlines the main conclusions.
II. METHODOLOGY
In this section, first, the concept of two well-known op-timization techniques, GA and PSO, will be recalled. Then, the proposed feature selection technique which is based on the hybridization of GA and PSO (HGAPSO+SVM) will be described.
A. GA
GA is inspired by the genetic process of biological organ-isms. GA consists of several solutions; called chromosomes or individuals. Each chromosome in a binary GA includes several genes with binary values; 0 and 1, which determines the attributes for each individual. A set of the chromosomes is made up to form a population. The merit of each chromosome is evaluated by using a fitness function. Fit chromosomes are selected for the generation of new chromosomes. In that step, two fit chromosomes are selected and combined through a crossover step in order to produce a new offspring (or solution). Then, mutation is applied on the population in order to increase the randomness of individuals for decreasing the possibility of getting stucked in local optimum [9].
B. PSO
PSO is a biologically inspired technique derived from the collective behavior of bird flocks, first introduced by Kennedy and Eberhart [10]. PSO consists of a set of solutions (particles) called population. Each solution consists of a set of parameters and represents a point in a multidimensional space. A group of particles (population) makes up a swarm. Particles move through the search space with a specified velocity for finding the optimal solution. Each particle has a memory which helps it in keeping the track of its previous best position. The positions of the particles are distinguished aspersonal bestand
global best. The velocities of particles are adjusted according to the historical behavior of each particle and its neighbors, while they fly through the search space. Each move of particles is deeply influenced by its current position, its memory of previous useful parameters, and the group knowledge of the swarm [10]. Therefore, the particles have a tendency to fly towards improved search areas over the course of the search process.
The velocity of the i-th particle in (k+1)-th iteration is mathematically defined as:
Vik+1=W Vik+C1r1(pbki −X
k
i) +C2r2(gbkd−X k i), (1) where C1 and C2 are acceleration constants, r1 and r2 are random values in the range of 0 and 1, W is the inertia weight (predefined by the user), Xik shows the position of each particle in ad-dimensional search space,pbki is the best previous position of each particle named particle best position, and gbk is the best position of all the particles (called the global best particle). The position of thei-th particle is updated by:
Xik+1=Xik+Vik+1. (2)
The PSO was originally introduced for the optimization of problems in continuous, multidimensional search spaces. In order to extend that concept to feature selection, it needs to be developed to deal with binary data, in which 0 and 1 demon-strate the absence and presence of a band, respectively. In [10],
KennedyandEberhart applied the sigmoid transformation on the velocity component to develop a binary discrete PSO to control the range of velocity between 0 and 1 according to:
∆Xik+1= 1
1 + exp(−Vik+1). (3)
For updating the position of each particles, ∆Xik+1 is compared with, rx which is a random d-dimensional vector in which each component is in generally a uniform random number between 0 and 1 according to:
Xik+1= ( 1, ∆Xik+1≥rx. 0, ∆Xik+1< rx (4) C. HGAPSO+SVM
GA and PSO can be combined in different ways. However, in the proposed feature selection approach, the hybridization is obtained through integrating the standard velocity and update rules of PSO with selection, crossover and mutation from GA.
Fig. 1 shows the block diagram of the proposed approach. In order to investigate the hybridization of GA and PSO for the purpose of feature selection, the dimension of each particle needs to be equal to the number of features. In this case, that velocity dimension, i.e., dim Vk
i , as well as the position dimension, dimXk
i, correspond to the total number of bands (l bands) in the input data (dim Vk
i = dim Xik =l). In that case, each particle’s velocity is represented as a l-dimension vector. In addition, as one wishes to use the algorithm for band selection, each particle represents its position in binary values, i.e., 0 or 1, where 0 and 1 demonstrate the absence and the presence of the corresponding feature.
In this work, a random population is initially generated. The individuals in the population may be regarded as chromosomes with respect to GA, or as particles with respect to PSO. Then, a new population for the next generation is produced through enhancement, crossover and mutation as described below.
Enhancement: In each generation, after the fitness values of all the individuals in the same population are calculated (the OA of SVM on validation samples), the top-half of the best-performing particles are selected. These individuals are regarded as elites. Then, the elites are enhanced by PSO. By using these enhanced elites as parents, the generated off-springs usually achieves better performance than using the elites directly [11]. Furthermore, Eq. (1) is applied to the elites. In each iteration, the range of velocity is regulated between 0 and 1 with the sigmoid function (Eq. (3)) and compared with a random chromosome between 0 and 1 in order to update the position in the binary format (Eq. (4)). By performing PSO on the elites, the search ability of the algorithm may increase. A half of the population in the next generation consists of the enhanced individuals, and the rest is generated by the crossover operation.
Crossover: In order to produce well performing individuals, the crossover operation is only performed on selected indi-viduals produced by PSO. To select parents for the crossover operation, a tournament-selection scheme is used, in which two enhanced elites are selected at random, and their fitness values are compared. The individual with the better fitness value is selected as a parent and inserted into the mating pool. Then, the two individuals are moved back to the population. In the same way, the other parent is chosen and moved to the mating pool. Two off-springs are created by performing crossover on the selected parents. A two-points crossover operation is used. The produced off-springs make up the other half of the population in the next generation.
Mutation: This operation occurs along with the crossover operation. Here, uniform mutation is adopted. In our case, a constant mutation-probability equal to 0.01 is used.
III. EXPERIMENTAL RESULTS
A. Description of Data Sets
1) Indian Pines: The hyperspectral data set used in experi-ments is the well-known AVIRIS data captured of Indian Pines (NW Indiana) in 1992 comprising 16 classes, mostly related to different land covers. The data set consists of 145×145
pixels with a spatial resolution of 20 m/pixel. In this work,220
data channels (including all noisy and atmospheric absorption bands) are used. The training samples are available for 16 classes and the total number of training and test samples are 695 and 9691, respectively. The same training and test samples for all 16 classes as in [12] are chosen and a half of the training samples is selected fot validation.
2) Toronto: The RGB Toronto Roads data set is captured at the resolution of 1.2m per pixel. This data set contains three bands consisting of 1500 by 1500 samples. Figs. 2.a and 2.b show this data set and its corresponding digitized samples [13]. For this data set, 0.01 of the total samples are randomly chosen as training samples (1052 samples for class Road and 21448 for class No-road) and the rest as test samples (102007 samples for class Road and 2125493 for class No-road). Then, a half of the training samples is chosen for validation.
B. General Information
The proposed method was implemented inMATLAB, on a computer having Intel(R) Core(TM) i7 CPU 2.40 GHz and 16GB (15.9GB usable) of memory.
The number of populations in the first and second scenarios were set as 20 and 10, respectively. The same set of parameters for both data sets were chosen which infers that the proposed method is data set distribution independent and there is no need to set any parameters for it and the method can au-tomatically choose the most informative bands in terms of classification accuracies.
The hybridization of GA-PSO will stop automatically, when the difference between the OA of the best solution and the average value of fitness values in a swarm is less than a predefined threshold value.
For the first scenario, in order to compare the capability of the proposed methodology, four well known feature selectors, Divergence, Transformed divergence, Bhattacharyya distance and Jeffries-Matusita distance have been taken into account. In addition, two frequently used supervised feature extraction techniques, DBFE and NWFE have been considered. In the case of NWFE and DBFE, features with cumulative eigen-values above 99%are retained and classified with SVM. This way of choosing features has been widely used in the literature (e.g., [14] and [15]). Besides the aforementioned techniques, GA+SVM and PSO+SVM have been investigated in order to be compared with the proposed approach. Since the first scenario is related to feature selection and image classification, OA, Average Accuracy (AA), kappa coefficient and CPU processing time are considered for the evaluation of the final results. Since the PSO+SVM, GA+SVM and HGAPSO+SVM are based on evolutionary techniques and their results can be different in different runs, all above-mentioned approaches have been run 10 times and the average results are reported in Tables I.
For the second scenario, since it is related to road detection, Root Mean Square Error (RMSE) is taken into account as it was suggested that RMSE is the most solid index [16]. For this scenario, since the Toronto data consist of only three components (RGB), in order to produce extra features, an attribute profile is used. A morphological attribute profile
is considered as the generalization of morphological profile which simplifies the input image by using the sequential stricter thresholds to model spatial information of the input image. For a detailed description of the attribute profile, refer to [8] and [14]. In this work, three attributes; area (λa = (1000/v){1,3,5,7} where v is the resolution of the input data), standard deviation (λs = (µi/100){30,40} where µ is the mean of the i-th feature), and diagonal of the box bounding the regions (λd ={25,50,100}) are used. However, other types of attributes with different ranges can be used. In this case, 19 features for each component (including itself) was produced. Since we have three components (R, G and B), the total number of produced features is 57 which were considered as the input for the proposed methodology. Then, HGAPSO+SVM is applied on the features obtained by the attribute profile (and named as HGAP SO+SV MAP) and compared with i) the result of SVM performed on the RGB data (named as SV MRGB) and ii) the result of SVM performed on the features produced by the attribute profile (named as SV MAP).
The data sets have been classified with SVM and a Gaussian kernel.5-fold cross validation is taken into account in order to select the hyperplane parameters when SVM is used for the last step (for the classification of informative bands).
C. First Scenario
The result of classification with different techniques is listed in Table I. These results have been obtained when con-ventional feature selection techniques including Divergence, Transformed Divergence and Bhattacharyya distance, cannot work due to the singularity of the covariance matrix. The main reasons behind this shortcoming is that the conventional feature selectors cannot eliminate the corrupted bands auto-matically and this step should be done manually which is time consuming. In addition, when there is not a balance between the number of bands and the number of training samples, the above-mentioned conventional feature selection techniques will not perform well. Furthermore, almost all of the conventional feature selection methods are computationally time demanding. For those approaches, in order to select a subset ofmfeatures out of a total ofnfeatures,n!/(n−m)!m!
alternatives must be calculated, which is a laborious task and demands a lot of computational memory. In other words, the feature selection techniques are only feasible in relatively low dimensional cases. Another shortcoming of the most of conventional methods (in particular Divergence, Transformed Divergence and Bhattacharyya distance) is that the number of desired features must be initialized a priori. On the contrary, since the evolutionary-based feature selection techniques (e.g., PSO+SVM, GA+SVM and HGAPSO+SVM) are not based on the calculation of the second order statistics, the singularity of the covariance matrix is not a problem. In addition, when an evolutionary technique is taken into consideration, there is no need to calculate all different alternatives in order to find the most informative bands and in this case these methods are usually faster than the conventional ones. Furthermore, in the proposed method, there is no need to initialize the number of
desired features and it can find the most informative bands with respect to the OA of SVM over the validation samples.
Some algorithms, such as the originally proposed DBFE, demand the use of second order statistics (e.g., the covariance matrix) to characterize the distribution of training samples with respect to the mean. In this case, if the number of available training samples is not sufficient, a good estimation of the covariance matrix might be impossible. For this purpose, the use of a sample covariance or a common covariance [1], may not be successful. As an example, either when the sample covariance or the common covariance, is taken into account to estimate the statistics for each available class for DBFE, if the number of pixels in the classes is not, at least one greater than the total number of features being used, the DBFE stops working. In order to handle this issue, the Leave-One-Out Covariance (LOOC) [1] estimator can be used as an alternative to estimate the covariance matrix. However, this is not a problem for evolutionary based feature selectors since they are non-parametric and do not need to estimate class conditional densities. In addition, they can efficiently handle high dimensional data with a very limited number of training samples due to the generalization of the SVM which has been considered as the fitness function. As can be seen from Table I, the proposed method outperforms NWFE and DBFE in terms of classification accuracies and improved the OA of DBFE and NWFE by almost 12 and 8, respectively.
As can be seen from Table I, HGAPSO+SVM outperforms the other evolutionary based feature selection techniques (e.g., GA+SVM and PSO+SVM) in terms of classification accuracy. On the other hand, PSO+SVM has the highest CPU processing time among other evolutionary based feature selectors. The main reason of this shortcoming is that although PSO is a fast optimization method, it converged after a higher number of iterations. On the contrary, although the convergence of GA+SVM is faster than PSO+SVM and HGAPSO+SVM, it has the worst classification accuracies due to the premature convergence of the chromosomes.
Since, all the evolutionary-based optimization methods are based on a random process, the selected features are different in different trials. In the experiments, the proposed approach selected 73 to 94 features in 10 different trials. It should be noted that, the proposed approach allows the detection of the best distinctive features without requiring the number to be set
a prioriby the user.
D. Second Scenario
The obtained RMSE for SV MRGB, SV MAP and
HGAP SO+SV MAP are 0.7669, 0.6461 and 0.6049,
re-spectively.HGAP SO+SV MAPprovides the smallest RMSE among all techniques, which confirms the capability of the pro-posed method to detect the classes of interest. The main reason that the proposed approach outperforms SV MAP is that although attribute profiles are a powerful technique to model spatial information of an image, they produces redundant fea-tures which can reduce the classification accuracies. However, by using the proposed technique, the most informative features can be selected leading to higher classification accuracies. Fig.
TABLE I
FIRSTSCENARIO: CLASSIFICATION ACCURACIES ANDCPUPROCESSING TIME IN SECONDS. THE BEST RESULT IN EACH ROW IS SHOWN IN BOLD FACE.
THE NUMBER OF FEATURES IS SHOWN IN BRACKET. SINCEPSO+SVM, GA+SVMANDHGAPSO+SVMARE THE AVERAGE OF10RUNS,THE NUMBER
OF FEATURES IS NOT GIVEN.
Index SVM DBFE NWFE PSO GA HGAPSO
(220) (17) (120) +SVM +SVM +SVM AA 76.02 73.36 60.13 74.94±2.54 73.96±4.37 77.92±1.42 Kappa 0.6119 0.6055 0.5533 0.7281±0.025 0.7141±0.040 0.7495±0.0069 OA 65.41 64.96 68.44 74.69±2.38 73.39±3.81 76.68±0.64 Time(s) 70 72 132 293±39 121±19 201±58 (a) (b) (c) (d) (e)
Fig. 2. a) input data, b) manually produced reference map, c) the map obtained bySV MRGB, d) the map obtained bySV MAP and e) the map obtained
byHGAP SO+SV MAP.
2 shows the input data, the manually produced reference map, and the maps obtained by SVM, AP and HGAPSO+SVM, respectively. As can be seen, the proposed method detects more details from the road network as compared to the other approaches and outperforms SV MRGB andSV MAP.
IV. CONCLUSION
In this paper, a new feature selection technique which does not need to set the number of desired features a priori
is introduced, based on the integration of GA and PSO. According to the experiments, the following can be concluded:
i) The proposed method can find informative bands in terms of classification accuracies in an acceptable CPU time.
ii) The proposed method can be used for road detection.
iii)In the novel feature selection approach, there is no need to set the number of output features since the proposed approach can automatically select the most useful features in terms of classification accuracies.
iv) The proposed method is data set distribution independent and for it, there is no need to initialize any parameters.
v) Since the proposed algorithm is based on evolutionary techniques, it is much faster than other well-known feature selection techniques which require an exhaustive process to se-lect the most informative bands. Therefore, the new approach can work appropriately in a situation which other feature selection techniques are not applicable.
vi) Since SVM is considered as a fitness function in the proposed method, it can handle high dimensional data with a limited number of training samples, when other feature se-lection techniques cannot proceed due to singularity problems of covariance matrices.
REFERENCES
[1] D. A. Landgrebe, Signal Theory Methods in Multispectral Remote
Sensing. Hoboken, NJ: Wiley, 2003.
[2] G. Hughes, “On the mean accuracy of statistical pattern recognizers,”
IEEE Trans. Inf. Theory, vol. IT, no. 14, pp. 55 – 63, 1968.
[3] Y. Bazi and F. Melgani, “Toward an optimal svm classification system
for hyperspectral remote sensing images,” IEEE Trans. Geos. Remote
Sens., vol. 44, no. 11, pp. 3374–3385, 2006.
[4] A. Daamouche, F. Melgani, N. Alajlan, and N. Conci, “Swarm
optimiza-tion of structuring elements for vhr image classificaoptimiza-tion,”IEEE Geos.
Remote Sens. Letters, vol. 10, no. 6, pp. 1334–1338, 2013.
[5] F. Bergh and A. P. Engelbrecht, “A cooperative approach to particle
swarm optimization,” IEEE Trans. Evolutionary Computation, vol. 8,
no. 3, pp. 225–239, 2004.
[6] K. Premalatha and A. M. Natarajan, “Hybrid pso and ga for global
maximization,”Int. J. Open Prob. Compt. Math., vol. 2, pp. 597–608,
2009.
[7] R. C. Eberhart and Y. Shi.,Comparison between genetic algorithms and
particle swarm optimization, V. W. Porto, Ed. Springer, 1998. [8] M. Dalla Mura, J. A. Benediktsson, B. Waske, and L. Bruzzone,
“Morphological attribute profiles for the analysis of very high resolution
images,”IEEE Trans. Geos. and Remote Sens., vol. 48, pp. 3747–3762,
2010.
[9] D. Beasley, D. Bull, and R. Martin,An overview of genetic algorithms.
Univ. Camping, 1993, vol. 15, no. 2.
[10] J. Kennedy and R. Eberhart,Swarm Intelligence. Morgan Kaufmann,
San Francisco, 2001.
[11] P. Ghamisi, F. Sepehrband, J. Choupan, and M. Mortazavi, “Binary hybrid ga-pso based algorithm for compression of hyperspectral data,” in2011 5th International Conference on Signal Processing and Com-munication Systems (ICSPCS), Dec 2011, pp. 1–8.
[12] P. Ghamisi, J. A. Benediktsson, and M. O. Ulfarsson, “Spectral-spatial classification of hyperspectral images based on hidden Markov random
fields,” IEEE Trans. on Geos. and Remote Sens., vol. 52, no. 5, pp.
2565–2574, May 2014.
[13] V. Mnih, “Machine learning for aerial image labeling,” Ph.D. disserta-tion, University of Toronto, 2013.
[14] P. Ghamisi, J. A. Benediktsson, and J. R. Sveinsson, “Automatic spectral-spatial classification framework based on attribute profiles and
super-vised feature extraction,” IEEE Trans. Rem. Sens. and Geos., vol. 52,
no. 9, pp. 5771–5782, Sept 2014.
[15] P. Ghamisi, J. A. Benediktsson, G. Cavallaro, and A. Plaza, “Automatic framework for spectral-spatial classification based on supervised
fea-ture extraction and morphological attribute profiles,”IEEE Journal of
Selected Topics in Applied Earth Obs. and Remote Sens., no. 99, 2014. [16] M. Mokhtarzade and M. V. Zoej, “Road detection from high-resolution
satellite images using artificial neural networks,”Int. Journal of Applied