An analysis of the relationship between US REIT returns
Hideki NishigakiSaitama University
Abstract
This study analyses the long-term relationship between real estate investment trust (REIT) returns and house price in the US financial market. The relationship between REIT
performance and house price or other financial variables represents important information for the risk management strategy of investors. Using a vector error correction model (VECM), the analysis found that in the long run, there exists a positive correlation between US equity REIT returns and house price. Our results reveal that if house prices in the US decline or the inflation index rises, the REIT performance will drop in the long run. Our empirical results also indicate that in recent years, there appears to be a stronger positive correlation between US equity REIT returns and house price.
1. Introduction
In recent years, there has been an increased interest in the effect of the slowdown in the US housing market. The US housing market activity has slowed down since mid-2005, and the pace of increase in house price has been moderated. However, the commercial real estate market has continued to surge and the real estate investment trust (REIT) has remained strong. Therefore, investors have been interested in knowing whether REIT returns will be affected by the housing market activity.
In this paper, using the vector error correction model (VECM), we attempt to investigate the relationship between REIT performance and house price, which is important information for the risk management strategy of investors.
Some previous studies have already investigated the relationship between REIT returns and house price or other macroeconomic variables (He, 2000; Glascock et al., 2000; Goodman, 2003; Berg et al., 2006).
He (2000) found a very strong positive contemporaneous causality between
apartment REIT stock price returns and new house prices. Glascock et al. (2000)
analysed the cointegration between the equity REIT and the unsecuritised real estate; they also examined the long-term relationship between REIT and stock price, and interest rate and inflation. Goodman (2003) revealed a low correlation between REIT returns and house price in a sample spanning 1976 to 2001. Moreover, Goodman (2003) found that REIT returns were linked with other macroeconomic factors. However, these studies did not use a VECM. Ewing and Payne (2005) examined the time series dynamics of REIT returns by estimating a vector autoregressive (VAR) model incorporating the influence of four macroeconomic variables on REIT returns, specifically, the Federal Funds rate, the index of coincident indicators, inflation and the default risk premium. Ewing and Payne (2005) found that a sudden monetary tightening, the rise in the index of coincident indicators and inflation corresponded to lower the returns. On the other hand, an unexpected rise in the default risk premium was found to increase REIT returns. Although their empirical work used monthly data spanning the period between January 1980 to September 2000, Ewing and Payne (2005) did not incorporate house price in their study.
This paper focuses on four key financial variables including the equity REIT and house price. However, this paper contains certain characteristics that distinguish it from previous studies.
First, our estimation includes more immediate samples than those of previous studies, and we have also attempted to investigate whether there is a cointegration relationship between the REIT index and house price. The relationship between the REIT index and each macroeconomic variable is examined by estimating the VECM.
Second, we have conducted the Johansen’s cointegration test used for multivariate case, unlike the residual-based Engle-Granger Test technique as used by Glascock et
al. (2000), which tends to be inaccurate and can lead to contradictory results, particularly when more than two I(1) variables are being considered (Pesaran and Pesaran, 1997).
Third, we have presented robustness checks for the estimation results using the
CUSUM and CUSUMSQ tests proposed by Brown et al. (1975), which have been
rarely applied in previous studies regarding REIT returns. The theoretical background is presented in Section II, while data are given in Section III. The empirical results are presented in Section IV, and Section V provides the concluding remarks.
2. Theoretical Background
There are two views regarding the relationship between REIT performance and the housing market. On one hand, it is argued that the REIT returns may be negatively connected with the house price. For example, people who have sold their homes often wait until the prices decrease before buying new ones. Meanwhile, since they reside in rental accommodation, the rental market naturally becomes stronger, and this is likely to increase the REIT returns.
In this way, the decline in the residential real estate market has been instrumental in boosting the apartment REIT, which is actually considered to be the higher performing REIT.
On the other hand, the argument that a poorly performing housing market is good for the apartment market does not necessarily hold true. In other words, REIT returns may be positively connected with the house price. The softening housing market is responding to real economic forces. If the inflation index rises and the overall economy weakens, people can neither afford homes nor can their incomes sustain their monthly expenses. Moreover, both the rent growth or REIT performance and the housing market weaken.
REIT pertains to a financial instrument as well as a common stock, bond and house for investors. A broad range of investors are using REIT for achieving their investment goals. If the REIT index has a weak relationship with other financial investments, REIT will be a diversification investment.
Investment sentiment can be damaged by inflation. If the inflation index rises, the interest rates will increase and the stock, bond and house prices will decrease. Thus, the REIT returns may be positively connected with the house price.
3. Data
Many macroeconomic variables can affect the REIT returns. However, in this paper, we have particularly focussed on the relationship between REIT returns and house price. Therefore, we selected stock prices, interest rates and inflation as the macroeconomic or financial variables that are closely related to the real estate market. The data used in this paper comprises the following five variables: the US equity
REIT index, the house price, the stock price, the long term interest rate and the inflation index.
The REIT index was obtained from equity REIT of the National Association of Real Estate Investment Trust (NAREIT). The equity REIT index tracks apartment REITs in the US (LREIT). The house price (LHP) is the average sales price of new houses, provided by the US Bureau of Census, following He (2000). The Dow Jones Industrial average (LDOW) is the source for the stock price, and the 10-year rate (US10) is from the Federal Reserve Board (FRB). The consumer price index for all urban consumers (LCPI) is the measure of the aggregate price level (Ewing and Payne, 2005), from the Bureau of Labor Statistics.
All variables except the interest rate are entered in natural logarithms. The data are monthly observations from January 1980 to November 2006.
4. Empirical Results 4.1 Unit Root Test
Prior to the cointegration analysis, we tested the order of integration for all the time series. The results of the unit root test, reported in Table 1, indicate that the level of each series is non-stationary. Using the augmented Dickey-Fuller (ADF) test, the hypothesis of a non-stationary level cannot be rejected for all the series. However, the
Table1. Unit Root Test
Test statistics ADF
Intercept Intercept and trend
Level LREIT 0.016 (1) -2.157 (1) LDOW -0.085 (1) -1.962 (1) LHP -0.490 (5) -1.408 (5) US10 -1.876 (15) -2.776 (15) LCPI -1.921 (13) -1.947 (13) First Difference LREIT -15.147 (0) *** -15.131 (0) *** LDOW -13.957 (0) *** -13.949 (0) *** LHP -12.438 (4) *** -12.421 (4) *** US10 -6.677 (14) *** -6.738 (14) *** LCPI -4.227 (12) *** -4.474 (12) ***
The ADF test examines the null hypothesis of a unit root against the stationary alter Figures in parentheses indicate the lag length
The AIC are used to determine the optimal lag length Asterisks(***) denote significance at the 1% level
results for the first difference clearly indicate that the non-stationarity hypothesis can be rejected. Consequently, all our five endogenous variables, LREIT, LDOW, LHP, US10 and LCPI are considered as integrated to the order of one.
4.2 Cointegration Test
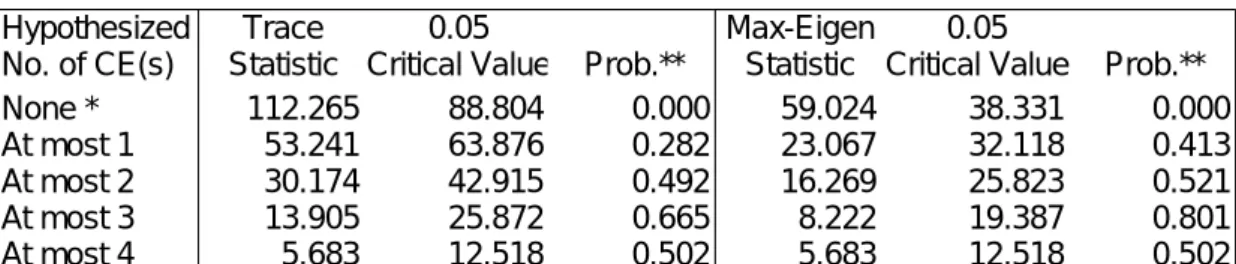
Subsequent to this test, we can now apply the Johansen and Juselius (1990) cointegration analysis, which is based on the maximum-likelihood estimation technique. Johansen and Juselius have introduced two test statistics known as trace and λmax to determine the number of cointegrating vectors. These two statistics are reported in Panel A of Table 2. The order of the cointegrating equation was determined to be two based on Akaike’s Information Criterion (AIC). From Panel A of Table 2, it is clear that the null of no cointegration is rejected by both statistics because each statistic is larger than the critical value (indicated by *). However, the null of at most one vector cannot be rejected in favour of the two cointegrating equations.
Table 2. Cointegration Test Results and Cointegrating Coefficients
Panel A : Cointegration Test Result
Hypothesized Trace 0.05 Max-Eigen 0.05
No. of CE(s) Statistic Critical Value Prob.** Statistic Critical Value Prob.**
None * 112.265 88.804 0.000 59.024 38.331 0.000 At most 1 53.241 63.876 0.282 23.067 32.118 0.413 At most 2 30.174 42.915 0.492 16.269 25.823 0.521 At most 3 13.905 25.872 0.665 8.222 19.387 0.801 At most 4 5.683 12.518 0.502 5.683 12.518 0.502 Sample (adjusted): 1980M04 2006M10
Trace test indicates 1 cointegrating eqn(s) at the 0.05 level
Max-eigenvalue test indicates 1 cointegrating eqn(s) at the 0.05 level Asterisk(*) denotes rejection of the hypothesis at the 0.05 level Asterisks(**) denote MacKinnon-Haug-Michelis (1999) p-values Panel B :Normalized cointegrating coefficients
Sample (adjusted): 1980M04 2006M10
LREIT LDOW LHP US10 LCPI TREND
1.000 0.009 -1.385 0.013 6.373 -0.018
(0.221) (0.511) (0.035) (1.215) (0.004) Sample (adjusted): 1980M04 1996M12
LREIT LDOW LHP US10 LCPI TREND
1 -0.511 -0.688 -0.015 9.556 -0.03
(0.507) (0.530) (0.036) (2.290) (0.009)
Figures in parentheses indicate standard error
µ
τ τµ
µ
Thus, there is only one cointegrating vector. The estimate of this vector normalized on LREIT is reported in Panel B of Table 2. These results demonstrate that in the long run, the house price (LHP) is a primary factor in influencing the REIT returns (LREIT).
The cointegration results suggest that REIT returns are positively correlated with the house price and negatively correlated with the CPI. In order to conduct a robustness check, we substituted the data pertaining to a new house price with the price of existing single family homes.TP
1
PT
However, our conclusion was not affected by the choice of house price data.
As regards the other variables, the REIT returns are found to have a relatively low correlation with the stock price and interest rate.
Panel B of Table 2 presents the results of different sample estimations. It is evident that there is an increasingly stronger positive relationship between the REIT returns and house price when the estimation includes the more immediate sample.
4.3 Stability Test
In this section, we address the stability of long-term coefficient estimates by taking the short-term dynamics into consideration.
For this purpose, in accordance with Pesaran and Pesaran (1997), we formulate an error correction (EC) term using the long-term coefficient estimates for the whole period and employ its lagged value in the following EC model.
∑
∑
∑
∑
∑
= − − = − = − = − = − + ∆ ∆ ∆ ∆ + + ∆ + = ∆ n j t t j t j n j j t j n j j t j n j j t j n j j t jt a b LREIT c LHP d LDOW e US f LCPI EC
LREIT 1 1 1 1 1 1 10 λ ε
Once the model has been estimated, Pesaran and Pesaran (1997) suggest employing the cumulative sum of recursive residuals (CUSUM) and the CUSUM of square (CUSUMSQ) tests proposed by Brown et al. (1975) in order to assess the parameter constancy. If the plots of CUSUM and CUSUMSQ lie outside the area between the two critical lines, the parameters and variance are said to be unstable. However, Figure 1 indicates that both short-term and long-term elasticities are stable.
TP
1
PT
We used the average sales price of existing single family homes provided by the National Association of Realtors
Figure1. CUSUM and CUSUMSQ Test -60 -40 -20 0 20 40 60 82 84 86 88 90 92 94 96 98 00 02 04 06 CUSUM 5% Significance -0.2 0.0 0.2 0.4 0.6 0.8 1.0 1.2 82 84 86 88 90 92 94 96 98 00 02 04 06 CUSUM of Squares 5% Significance 5. Conclusions
This paper aimed to investigate the relationship between REIT and house price. In the long run, the US equity REIT index is positively correlated with house price and negatively correlated with inflation. Our results were found to support the results of several previous studies that did not use the VECM and indicated that REIT performance would worsen consequent to a decline in the house price or an increase in the inflation index.
We tested for the stability of all the estimated coefficients using an EC model in order to check the robustness of estimates. The results obtained from applying the CUSUM and CUSUMSQ tests revealed the stability in the estimated elasticities.
References
Berg, N., Gu, A., and Donald, L. (forthcoming) “Dynamic correlation: A tool for hedging house-price risk?” Journal of Real Estate Portfolio Management.
Brown, R. L., Durbin, J., and Evans, J. M. (1975) “Techniques for testing the constancy of regression relationships over time” Journal of the Royal Statistical Society, Series B 37, 149–192.
Ewing, B. T., and Payne, J. E. (2005) “The response of real estate investment trust returns to macroeconomic shocks” Journal of Business Research58, 293–300. Giliberto, S. M. (1990) “Equity real estate investment trusts and real estate returns”
The Journal of Real Estate Research5(2), 259–263.
Glascock, J. L., Lu, C., and Raymond, W. S. (2000) “Further evidence on the integration of REIT, bond, and stock returns” Journal of Real Estate Finance and
Economics20(2), 177–194.
Goodman, J. (2003) “Homeownership and investment in real estate stocks” Journal of Real Estate Portfolio Management,May–August.
He, L. T. (2000) “Causal relationships between apartment REIT stock returns and unsecuritized residential real estate” Journal of Real Estate Portfolio Management 6(4), 365–372.
Johansen, S., and Juselius, K. (1990) “Maximum likelihood estimation and influences on cointegration—with applications to the demand for money” Oxford Bulletin of Economics and Statistics52, 169–210.
Lu, C., and Raymond, W. S. (2001) “The relationship between REIT returns and inflation: A vector error correction approach” Review of Quantitative Finance and Accounting, 16, 103–115.
Pesaran, M. H., and Pesaran, B. (1997) Working with Microfit 4.0: Interactive Econometric Analysis Oxford: Oxford University Press.