NASA/TM 2017-219020
Atmospheric Research
2016 Technical Highlights
Natural Color
Yuekui used logarithmic transformation that replaces each pixel value with its logarithm. As a result of the transformation, low intensity pixel values of dark surfaces have been enhanced.
LEFT, TOP AND BOTTOM
ATom field campaign provides a new perspective on tropospheric formaldehyde. Concentration of HCHO measured in situ from the NASA DC-8 with the ISAF instrument plotting versus latitude and altitude. The flights consisted of multiple vertical profiles that sampled the atmosphere at altitudes between 150 m and 12,000 m. The flights were designed to provide a representative slice of the atmosphere during the Northern Hemisphere summer. .
UPPER RIGHT
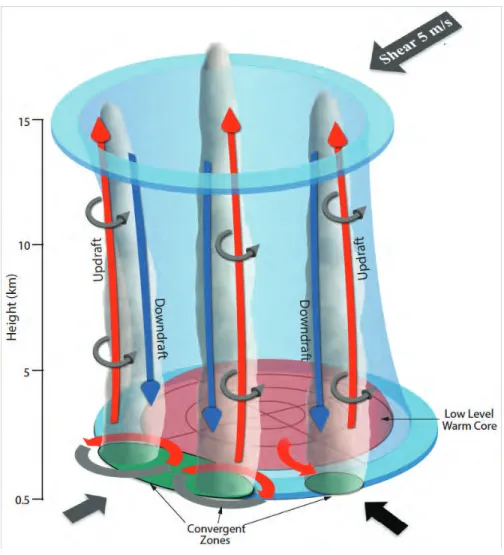
Convective bursts. A conceptual diagram summarizing the measurements and analysis from the rapid intensification of Karl. Red arrows denote the flow of air having anomalously warm characteristics. Green patches denote regions of convergence that form due to interaction between the mesovortex circulations and the larger scale vortex inflow.
CENTER RIGHT
GPM-WFF validation network. NASA has extended GPM/PMM ground validation (GV) activities through the development of a Wallops-based network of state-of-the-art GPM GV rain gauge, disdrometer, and multi-parameter radar measurements geared toward validating NASA precipitation products (spaceborne and combined ground and spaceborne retrieval algorithms and physics). .
BOTTOM RIGHT
Level of Review: This material has been technically reviewed by technical management.
Trade names and trademarks are used in this report for identification only. Their usage does not constitute an official endorsement, either expressed or implied, by the National Aeronautics and Space Administration.
Notice for Copyrighted Information
This manuscript is a work of the United States Government authored as part of the official duties of employee(s) of the National Aeronautics and Space Administration. No copyright is claimed in the United States under Title 17, U.S. Code. All other rights are reserved by the United States Government. Any publisher accepting this manuscript for publication acknowledges that the United States Government retains a non-exclusive, irrevocable, worldwide license to prepare derivative works, publish, or reproduce this manuscript, or allow others to do so, for United States Government purposes.
Since its founding, NASA has been dedicated to the advancement of aeronautics and space science. The NASA scientific and technical information (STI) pro -gram plays a key part in helping NASA maintain this important role.
The NASA STI program operates under the auspices of the Agency Chief Information Officer. It collects, organizes, provides for archiving, and disseminates NASA’s STI. The NASA STI program provides access to the NASA Aeronautics and Space Database and its public interface, the NASA Technical Report Server, thus providing one of the largest collections of aero -nautical and space science STI in the world. Results are published in both non-NASA channels and by NASA in the NASA STI Report Series, which includes the following report types:
• TECHNICAL PUBLICATION. Reports of completed research or a major significant phase of research that present the results of NASA Programs and include extensive data or theoretical analysis. Includes compilations of significant scientific and technical data and information deemed to be of continuing reference value. NASA counterpart of peer-reviewed formal professional papers but has less stringent limitations on manuscript length and extent of graphic presentations.
• TECHNICAL MEMORANDUM. Scientific and technical findings that are preliminary or of specialized interest, e.g., quick release reports, working papers, and bibliographies that contain minimal annotation. Does not contain extensive analysis.
• CONTRACTOR REPORT. Scientific and technical findings by NASA-sponsored contractors and grantees.
• CONFERENCE PUBLICATION. Collected papers from scientific and technical conferences, symposia, seminars, or other meetings sponsored or co-sponsored by NASA.
• SPECIAL PUBLICATION. Scientific, technical, or historical information from NASA programs, projects, and missions, often concerned with subjects having substantial public interest.
• TECHNICAL TRANSLATION. English-language translations of foreign scientific and technical material pertinent to NASA’s mission. Specialized services also include organizing and publishing research results, distributing specialized research announcements and feeds, providing help desk and personal search support, and enabling data exchange services. For more information about the NASA STI program, see the following:
• Access the NASA STI program home page at http://www.sti.nasa.gov
• E-mail your question via the Internet to [email protected]
• Fax your question to the NASA STI Help Desk at 443-757-5803
Goddard Space Flight Center Greenbelt, Maryland 20771 Dear Reader:
Welcome to the 2016 Atmospheric Research Highlights report, summarizing Earth atmospheric science highlights and communication/outreach accomplishments from NASA’s Goddard Space Flight Center (GSFC). As in previous years, this report is intended for a broad audience, including colleagues within NASA, scientists outside the Agency, science graduate students, and members of the public.
Organizationally, the report covers research activities under the Office of Deputy Director for Atmospheres (Code 610AT), which is within Earth Sciences Division (610) in the Sciences and Exploration Directorate (600). Laboratories and office within 610AT include: Mesoscale Atmospheric Processes Laboratory (612), Climate and Radiation Laboratory (613), Atmospheric Chemistry and Dynamics Laboratory (614), and the Wallops Field Support Office (610.W).
While the report provides a comprehensive summary of 610AT activities, a few items of note are worth reporting here.
Satellite Observations: Early 2016 marked the spaceflight anniversaries of three recent 610AT-related projects. The Global Precipitation Measurement (GPM) mission entered its second year in orbit on February 27, while the Cloud-Aerosol Transport System (CATS) laser, installed on the International Space Stations (ISS) and DSCOVR/ EPIC, completed their first year in orbit on January 10 and February 11, respectively. In addition, The Time-Resolved Observations of Precipitation structure and storm Intensity with a Constellation of Smallsats (TROPICS) mission was selected as the third NASA Earth Venture Instrument (EVI-3) in March 2016. Notable highlights:
• The GPM core observatory mission reached several significant milestones this year including product updates, recalibration of TRMM (previous precipitation mission) datasets, a highly successful conclusion to the OLYMPEX field campaign, new visualization tools, and a vigorous outreach and education effort. • The CATS collects data to improve our understanding of aerosol and cloud interactions. Principal
investiga-tor (PI) Matthew McGill (610) and science lead John Yorks (612) have been actively collaborating with the scientific community to utilize measurement results. The CATS data and analysis team (612) includes Patrick Selmer, Andrew Kupchock, Dennis Hlavka, Steve Palm, and Edward Nowottnick.
• The Goddard Earth Polychromatic Imaging Camera (EPIC) is one of two NASA instruments on the DSCOVR mission that is observing our planet from the Lagrange-1, located about one million miles from Earth. From that vantage point, EPIC views the Earth disk from sunrise to sunset in 10 different wavelengths, ranging from ultraviolet to near-infrared. Jay Herman (614/UMBC), Sasha Marshak (613), and colleagues are now concentrating on deriving an accurate in-flight calibration for use in production algorithms to produce useful science products such as ozone, aerosols, and clouds.
• Scott Braun (GSFC/612) is the project scientist for the NASA TROPICS mission. With a constellation of 12 smallsats, TROPICS will provide rapid-refresh (21-minute median refresh rate) microwave measurements over the tropics for up to one year, observing the thermodynamic environment and precipitation structure of tropical cyclones over much of their lifecycle.
• Paul Newman and Tom Hanisco are members of NASA’s Earth Venture Suborbital (EVS) Atmospheric Tomography Mission (ATom) science team. ATom deploys an extensive gas and aerosol payload on the NASA DC-8 aircraft for systematic, global-scale sampling of the atmosphere during four separate seasons. Its mea-surements of formaldehyde in August 2016 revealed a distinct pattern that provided new insights to the chem-istry of the remote troposphere.
• Several teams from 610AT participated in the joint Korean-U.S. Air Quality (KORUS-AQ) campaign at the Taehwa Mountain Forest Research site located about 60 km southeast of Seoul, South Korea. PI Tom McGee (614) and coinvestigators John Sullivan (614/USRA), Laurence Twigg (614/SSAI), and Grant Sumnicht (614/ SSAI) obtained TROPospheric Ozone (TROPOZ) differential absorption lidar measurements. Anne Thompson (610) and Ryan Stauffer (614/USRA) supported Tom McGee’s lidar team by launching daily ozonesondes. The sonde profiles calibrated the TROPOZ lidar and provided comparisons for DC-8 spirals over the Taehwa site. Jay Herman (614/UMBC) and team installed a network of nine Pandora instruments.
• Steven Platnick and several 610 scientists were in Namibia in August–September 2016 participating in the EVS ORACLES (ObseRvations of Aerosols above CLouds and their intEractionS) campaign, focusing on the interaction of African biomass burning aerosol with the extensive marine boundary layer clouds off the coasts of Namibia and Angola. Platnick was the principal investigator for the eMAS imager flown on the NASA ER-2 high-altitude research aircraft during the campaign. Other 610AT scientists in the field included Kerry Meyer (613/USRA) and Tom Arnold (613/SSAI).
• Judd Welton (612), Sebastian Stewart (612/SSAI), and other MPLNET team members were Namibia in June to finalize the installation of a new MPLNET site located near Etosha National Park. The new site is located immediately downwind from the Etosha salt pan, a large dust source in Northern Namibia.
• Scott Braun (612) was the mission scientist for the NOAA Sensing Hazards with Operational Unmanned Technology (SHOUT) experiment flown out of Wallops Flight Facility (WFF). SHOUT used the NASA Global Hawk to conduct operational flights over Atlantic hurricanes to evaluate the impact of the airborne and sensor technologies in operational hurricane forecasts. Gerry Heymsfield (612) and the HIWRAP team collected data during Hurricane Matthew and Tropical Storm Hermine.
• On March 25, Anne Thompson (610) and Ryan Stauffer (614/USRA) launched the first ozonesonde from the Ascension Auxiliary Airfield since NASA and NOAA/National Weather Service (NWS) Ascension sonde operations ended in mid-2010. U.S. Air Force (USAF) contractors were trained to conduct weekly ozonesonde launches for the SHADOZ (Southern Hemisphere Additional Ozonesondes) network, as part of a new agree-ment between GSFC and USAF.
Kudos: As in previous years, 610AT scientists garnered professional honors and other recognition during 2016. • Paul Newman (610) was elected as the Vice President of the International Ozone Commission. The International
Ozone Commission is one of the special commissions of the International Union of Geodesy and Geophysics, who represent the entire community of geophysical scientists around the world.
• The TRMM team, headed by Scott Braun (612), was selected for the 2016 Group William T. Pecora Award. The Pecora Award is presented annually to individuals or groups that make outstanding contributions toward understanding the Earth by means of remote sensing.
• Agency Honor Awards were received by Alexander Marshak (613), Matthew DeLand (614/SSAI), and Kevin Ward (613/SSAI, Team Award). Robert H. Goddard Awards were received by Ralph Kahn (613) and Gerald Heymsfield (612, Team Award).
Organizational Changes: David Wolff (610.W) was selected as the new chief of the 610.W Field Support Office, effective April 17. The 610 Office is involved in several key projects (GPM cal/val, IceSat, Operation Ice Bridge, O3 sondes, UAS capabilities) and science (PMM, ocean biology, and optics) activities. About 40 civil servants and
Charles Ichoku (613) assumed the position of Assistant Chief of the Climate and Radiation Laboratory, supporting Laboratory Chief Lazaros Oreopoulos (613).
Transitions: Change is ongoing, whether it be the excitement of a new hire, the celebration of retirement, or the ultimate sadness when we lose close colleagues.
• Piers Sellers, Director of the Earth Sciences Division (610), passed away December 23. We remember Piers as an exceptional scientist and leader, but most importantly as an inspiring human being. Piers’ contributions to Earth science are beyond significant, and his enthusiasm and positive attitude will be missed by all.
• We were terribly saddened by the tragic loss of Tiffany Moisan (610.W). Her research focused on marine biol-ogy, optics, and remote sensing of the ocean. She was especially interested the remote sensing of ocean color and its implications relative to discernment of algal blooms and phytoplankton types, the basis of the ocean food chain. She will be greatly missed by her NASA family.
• Jose Rodriguez retired after 9 years of service. Jose was head of the Atmospheric Chemistry and Dynamics Laboratory (614) since September 2006 where he exhibited exceptional qualities of leadership and manage-ment. For the past 30 years, he was involved in modeling anthropogenic perturbations to the atmosphere. He was also a guest investigator under the Pioneer Venus Program and the Solar Mesospheric Explorer Program, and he was the principal investigator in numerous projects involving modeling support of aircraft campaigns, both in the stratosphere and in the troposphere. He was a member of NASA’s Earth System Science and Applications Advisory Committee (ESSAAC) and served as project scientist for the Global Modeling Initiative (GMI) since its inception in 1994. He also held various leadership positions in international efforts.
• Ken Pickering retired after 11 years of service. Ken was an internationally known and highly respected sci-entist in the study of the effects of clouds on the distributions and budgets of tropospheric chemical species. He was closely aligned with the development of cloud system and mesoscale chemical transport models. His was primarily interested in the role of deep convection in vertical transport and redistribution of tropospheric trace gases and the subsequent consequences for upper tropospheric chemistry. Ken participated in numerous field experiments over the years and has led the use of data from convective events in cloud-scale modeling. • Larry Wharton retired after 35 years of service. Larry made significant contributions to the understanding of
Earth’s atmosphere in his early years through analysis of measurements made from spacecraft such as the Dynamics Explorer (DE). He was the key scientist in developing the Wind and Temperature Spectrometer (WATS) instrument that flew on DE-2. He also made significant contributions to the improvement of the equations describing the Langmuir probes that flew on many satellites. In recent years, he oversaw IT security for the 613 Laboratory.
• We were pleased to welcome civil servant Yuekui Yang as a research physical scientist into Code 613 on December 27. Yang has expertise in atmospheric radiative transfer modeling and satellite remote-sensing. With leadership roles in several NASA-funded projects, Yang will be well-positioned to act as a liaison between the 613 Lab and other Goddard Earth Science Division organizations.
This report has been published in two media: a printed version and an electronic version on our Atmospheric Science Research Portal site, http://atmospheres.gsfc.nasa.gov. It continues to be redesigned to be more useful for our scien-tists, colleagues, and the public. We welcome comments on this report and on the material displayed on our Web site.
Steven Platnick
TABLE OF CONTENTS
1. INTRODUCTION _________________________________________________________7 2. SCIENCE HIGHLIGHTS ___________________________________________________9
2.1 Mesoscale Atmospheric Processes Laboratory. ... 9
2.2 Climate and Radiation Laboratory. ... 17
2.3 Atmospheric Chemistry and Dynamics Laboratory... 25
2.4 Wallops Field Support Office. ... 31
3. MAJOR ACTIVITIES ______________________________________________________47 3.1 Missions. ... 47 3.2 Project Scientists. ... 60 4. FIELD CAMPAIGNS ______________________________________________________63 4.1 MPLNET. ... 63 4.2 GPM. ... 63 4.3 SHOUT. ... 64 4.4 KORUS-AQ. ... 65 4.5 SHADOZ. ... 69 4.6 ATom. ... 70
4.7 eMAS and ORACLES. ... 71
5. AWARDS AND SPECIAL RECOGNITION ___________________________________73 5.1 Introduction. ... 73
5.2 Agency Honor Awards. ... 73
5.3 Robert H. Goddard Awards. ... 73
5.4 External Awards and Recognition. ... 74
5.5 William Nordberg Award. ... 74
5.6 American Meteorological Society. ... 74
6. COMMUNICATION _______________________________________________________77
6.1 Introduction. ... 77
6.2 University and K-12 Interactions. ... 77
6.3 Public Outreach . ... 83
6.4 Lectures and Seminars. ... 86
6.5 AeroCenter Seminars. ... 92
6.6 NASA Cloud-Precipitation Center Annual Report. ... 92
7. ATMOSPHERIC SCIENCE IN THE NEWS _______________________________ 93 8. ACRONYMS _____________________________________________________________107 APPENDIX 1. REFEREED ARTICLES __________________________________________117
1.
INTRODUCTIONAtmospheric research in the Earth Sciences Division (610) consists of research and technology develop-ment programs dedicated to advancing knowledge and understanding of the atmosphere and its interac-tion with the climate of Earth. The Division’s goals are to improve understanding of the dynamics and physical properties of precipitation, clouds, and aerosols; atmospheric chemistry, including the role of natural and anthropogenic trace species on the ozone balance in the stratosphere and the troposphere; and radiative properties of Earth’s atmosphere and the influence of solar variability on the Earth’s climate. Major research activities are carried out in the Mesoscale Atmospheric Processes Laboratory, the Climate and Radiation Laboratory, the Atmospheric Chemistry and Dynamics Laboratory, and the Wallops Field Support Office. The overall scope of the research covers an end-to-end process, starting with the identification of scientific problems, leading to observation requirements for remote-sensing platforms, technology and retrieval algorithm development; followed by flight projects and satellite missions; and eventually, resulting in data processing, analyses of measurements, and dissemination from flight projects and missions. Instrument scientists conceive, design, develop, and implement ultraviolet, infrared, opti-cal, radar, laser, and lidar technology to remotely sense the atmosphere.
Members of the various Laboratories conduct field measurements for satellite sensor calibration and data validation, and carry out numerous modeling activities. These modeling activities include climate model simulations, modeling the chemistry and transport of trace species on regional-to-global scales, cloud resolving models, and developing the next-generation Earth system models. Satellite missions, field cam-paigns, peer-reviewed publications, and successful proposals are essential at every stage of the research process to meeting our goals and maintaining leadership of the Earth Sciences Division in atmospheric science research. Figure 1.1 shows the 22-year record of peer-reviewed publications and proposals among the various Laboratories.
Figure 1.1: Proposals Total publications First author
Publication History
0 45 90 135 180 225 2016 2015 2014 2013 2012 2011 2010 2009 2008 2007 2006 2005 2004 2003 2002 2001 2000 1999 1998 1997 1996 1995 117 180 114 116 118 107 107 107 84 111 85 59 60 80 85 176 1 17 65 52 64 29 67 57 69 68 50 39 62 89 21 178 176 182 179 200 201 162 138 152 62 44 148 171 199 182 64 58 75 50 185 194 207 205 213 165 158 80 89 7175 89 89 110 70Number of proposals and referred publications by Atmospheric Sciences members over the years. The green bars are the total number of publications and the blue bars the number of publications where a
This data shows that the scientific work being conducted in the Laboratories is competitive with the work being done elsewhere in universities and other government agencies. The office of Deputy Director for Atmospheric Research will strive to maintain this record by rigorously monitoring and promoting quality while emphasizing coordination and integration among atmospheric disciplines. Also, an appropriate balance will be maintained between the scientists’ responsibility for large collaborative projects and mis-sions and their need to carry out active science research as a principal investigator. This balance allows members of the Laboratories to improve their scientific credentials, and develop leadership potentials. Interdisciplinary research is carried out in collaboration with other laboratories and research groups within the Earth Sciences Division, across the Sciences and Exploration Directorate, and with partners in universities and other government agencies. Members of the Laboratories interact with the general public to support a wide range of interests in the atmospheric sciences. Among other activities, the Laboratories raise the public’s awareness of atmospheric science by presenting public lectures and demonstrations, by making scientific data available to wide audiences, by teaching, and by mentoring students and teachers. The Atmosphere Laboratories make substantial efforts to attract and recruit new scientists to the various areas of atmospheric research. We strongly encourage the establishment of partnerships with Federal and state agencies that have operational responsibilities to promote the societal application of our science products. This report describes our role in NASA’s mission, provides highlights of our research scope and activities, and summarizes our scientists’ major accomplishments during calendar year 2016. The composition of the organization is shown in Figure 1.2 for each code. This report is published in a printed version with an electronic version on our atmospheres Web site, http://atmospheres.gsfc.nasa.gov/.
0 50 100 150 200 250 300 350 Total 614 613 612 610.W 610AT 32 29 65 31 55 5 56 17 24 10 2 6 15 11 147 111 7 17 5 3 Number of Employees Organizational Code Employment Mix Civil Servant Contractor Associate
NASA Postdoctoral Fellow (NPP)
2. SCIENCE HIGHLIGHTS
Atmospheric research at Goddard has a long history (more than 50 years) in Earth Science studying the atmospheres of both the Earth and the planets. The early days of the TIROS and Nimbus satellites (1960s–1970s) emphasized ozone monitoring, Earth radiation, and weather forecasting. Planetary atmo-spheric research with the Explorer, Pioneer Venus Orbiter and Galileo missions was carried out until around 2000. In the recent years, Earth Observing System (EOS) missions have provided an abundance of data and information to advance knowledge and understanding of atmospheric and climate processes. Basic and crosscutting research has been carried out through observations, modeling, and analysis. Observation data has been provided through satellite missions as well as in situ and remote-sensing data from field campaigns. Scientists are also focusing their efforts on satellite mission planning and instrument development. For example, feasibility studies, improvements in remote-sensing measurement design, modeling and technology are underway in preparation for the planned missions recommended in Earth Science and Applications from Space: National Imperatives for the Next Decade and Beyond,
The 2007 Decadal Survey by the National Academy of Sciences (www.nap.edu/catalog/11820.html). The
2017–2027 Decadal Survey for Earth Science and Applications from Space (ESAS) has updated priorities that will help shape science priorities and guide agency investments into the next decade. Many of our scientists are expected to contribute to surveys and other functions.
The following sections summarize some of the scientific highlights of each Laboratory and the Wallops Field Office for the year 2016. The individual contributors are named at the end of each summary. Additional highlights and other information may be found at the website: atmospheres.gsfc.nasa.gov. 2.1. Mesoscale Atmospheric Processes Laboratory
The Mesoscale Atmospheric Processes Laboratory (612) seeks to understand the contributions of meso-scale atmospheric processes to the global climate system. The Laboratory conducts research on the physi-cal and dynamic properties as well as the structure and evolution of meteorologiphysi-cal phenomena—ranging from synoptic scale down to microscale—with an emphasis on the initiation, development, and effects of cloud and precipitation. Significant attention is placed on understanding energy exchange and conver-sion mechanisms; especially cloud microphysical development and latent heat release associated with atmospheric motions. The research is inherently focused on defining the atmospheric component of the global hydrologic cycle, especially precipitation, and its interaction with other components of the Earth system. The Laboratory also played a key science leadership role in the Tropical Rainfall Measurement Mission (TRMM), launched in 1997, as well as in developing the Global Precipitation Measurement (GPM) mission concept and continuing to lead the scientific investigations. The Mesoscale Atmospheric Processes Laboratory is also developing remote-sensing technology and methods to measure aerosols, clouds, precipitation, water vapor, and winds, especially using active remote sensing (lidar and radar). Highlights of Laboratory research activities carried out during the year 2016 are summarized below.
2.1.1. Uncertainties of GPM/DPR rain estimates caused by DSD parameterizations
The Ku- and Ka-band dual-frequency radar (DPR) is one of the instruments aboard the GPM satellite. One of its primary goals is to derive rain rate by estimating the rain’s drop size distribution (DSD), which is often modeled by an analytical function with two or three unknown parameters. The inability of the mod-eled DSD to represent actual DSD spectra, as well as intrinsic variations of DSD in time and space, lead to uncertainties in the estimates of rainfall rate obtained from the DPR. Understanding the uncertainties in rain estimation that depend on DSD parameterizations is important in evaluating the overall performance
reflectivity to rain-rate relationship but also on attenuation corrections needed to compensate for the loss of the radar signal caused by precipitation. Analysis of the uncertainties associated with the DSD model employed in the DPR rain estimation procedure also provides insight into the selection of DSD models adopted in the Ku- and Ka-band dual-wavelength radar rain-profiling algorithms. A large set of DSD mea-surement data (approximately 50,000 spectra averaged per minute), taken from 11 Parsivel disdrometers during the IFloodS field campaign, have been employed in this study to assess retrieval uncertainties in connection with the choice of DSD model within the context of dual-frequency retrievals.
L. Liao (612/Morgan State University), R. Meneghini (612), and A. Tokay (612/UMD/JCET)
2.1.2. Exploiting the full GPM constellation for the retrieval of precipitation
The GPM mission, launched in February 2014, has provided a greatly enhanced system for measur-ing precipitation on a global scale. Through improved instrumentation on the GPM Core Observatory, together with international partner satellites and sensors, observations can be generated globally every three hours more than 90% of the time, and ultimately 30-minute estimates can be obtained with the integration of infrared data. The team compared mean daily precipitation estimates from March 6, 2014, through March 5, 2015, generated by four different satellite sensors within the GPM mission constellation using the Advanced Microwave Scanning Radiometer-2 (AMSR2), GPM Microwave Imager (GMI) and Special Sensor Microwave Imager-Sounder (SSMIS). The mean daily rainfall derived from the cross-track Microwave Humidity Sounder (MHS) in Figure 2.1, lower left, illustrates the ability of the cross-track sensors to provide precipitation estimates similar to those derived from the conically-scanning sensors.
Figure 2.1: The exploitation of all GPM constellation sensors is critical to achieve accurate and timely precipitation estimates. Model-generated databases allow cross-track sensors to be fully utilized for global precipitation measurements.
Products derived from the conically-scanning sensors have formed the mainstay of satellite precipita-tion retrievals for the last 30 years. The ability to exploit observaprecipita-tions from cross-track sensors is critical to achieve the temporal sampling needed for accurate precipitation retrievals. Historically the
conically-scanning passive microwave radiometers (imagers) have been the mainstay of observations for precipitation estimates, but cross-track sensors (known as sounders) also have the capability to provide precipitation retrievals. The inclusion of the cross-track sensors within the GPM constellation is key to achieving the greater than 90-percent revisit time. Moreover, with the demise of the Tropical Rainfall Measuring Mission (TRMM) and the Defense Military Satellite Program (DMSP) F19 satellite, cross-track sensors now form the majority of precipitation-capable sensors. Unfortunately, no future launches of conically-scanning sensors are planned before that of the European Polar System-Second Generation (EPS-SG) MicroWave Imager (MWI) in 2023.
C. Kidd (612/UMD/ESSIC), T. Matsui (612/UMD/ESSIC), J. Chern (612/UMD/ESSIC), K. Mohr (610), C. Kummerow (Colorado State University) and D. Randel (Colorado State University)
2.1.3. Tropical convection and microphysics equilibrium
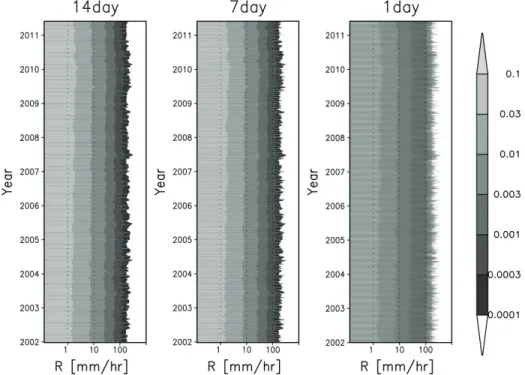
Microphysics and moist convection have been and unresolved physical processes—until now. These complex phenomena can be explained by a simple relationship using TRMM observations integrated over the entire tropics on the month-to-day scale. Namely, the spectrum shape of precipitation intensity and microphysics has virtually no change over time with extremely large samples over the entire tropics. When TRMM observation are integrated over the entire tropics, the precipitation particle-size distribu-tions (microphysics) and precipitation intensity (convection) spectrum become equilibrium states on the month-to-daily time scale, regardless of variability of tropical meteorology. Shown in Figure 2.3, this study’s data was acquired from TRMM Precipitation Radar (TRMM PR) attenuation-corrected echo pro-file from 2A25 and TRMM Microwave Imager (TMI) 89 GHz brightness temperature (Tb85) from 1B11. Precipitation intensity frequency were derived from merged precipitation data from (3B42). GPM precipi-tation microphysics was derived from GPM radar-radiometer combined retrievals (GPM 2A-CMB). All data were distributed by the NASA Precipitation Processing System.
T. Matsui (612/UMD/ESSIC), W.-K. Tao (612), S. J. Munchak (612), M. Grecu (612/MSU/GESTAR), and G. J. Huffman (612)
Figure 2.2: Tropics-integrated precipitation particle size distributions are estimated from the TRMM PR with Marshal-Palmer relationship, the TRMM PR algorithm (2A25), and the GPM combined algorithm (GPM 2A-CMB). These distribution shapes are invariant over time (i.e., equilibrium state). The equilibrium particle size distribution of GPM
2B-COMB is more broadly distributed than that from 2A25 due to different orbital patterns between TRMM and GPM
Figure 2.3: TRMM 3B42 datasets estimate precipitation using three measurements per hour on a 0.25°grid. With this, time series of the precipitation intensity frequencies are created by averaging for different time intervals (14 days, 7 days, and 1 day) over entire tropics to investigate equilibrium adjustment time. Comparing three averaging intervals, the time series of 1-day averaging is slightly noisier than 7-day, which is noisier than the 14-day composite; however, structures appears to be very similar between each other. This suggests that planetary-scale precipitation intensity (i.e., moist convection) spectrum could be equilibrium down to at least a 1-day time period.
2.1.4. A first look at X-BADGER data from the PECAN field campaign
Thunderstorms are most common after sunset across the Southern Great Plains in the summer and much of the resulting precipitation occurs from mesoscale convective systems (MCSs). Nocturnal MCSs can produce heavy rainfall, and their intensity is often correlated with the strength of a nocturnal low-level jet. The PECAN field campaign was a multi-agency project (NSF, NOAA, NASA, DOE) designed to advance the understanding and increased accuracy of predicting continental, nocturnal, warm-season precipita-tion. PECAN focused on nocturnal convection in conditions over the Southern Great Plains including convective initiation, mesoscale convective systems, bore/gravity waves, and the nocturnal low-level jets (NLLJ).
Multiple instruments (including a profiling radar, an interferometer, three lidars, and a tethersonde) were set up in Greensburg, Kansas, from June 1 through July 15, 2015, to study convection, which often occurs at night over the Great Plains region. Vertical profiles of radar reflectivity, Doppler velocity, and spectrum width were collected with the X-Band Atmospheric Doppler Ground-based Radar (X-BADGER) on June 25, 2015, during the PECAN field campaign. Data were collected over a period of nearly three hours where the continued descent of a cloud deck was observed. Rain finally began to fall from of the cloud base and was reported at the surface of the FP2 site in Greensburg, Kansas. The melting layer, positioned just above the bright band, is a feature commonly observed in stratiform precipitation. Approximately fifteen minutes after rain commenced at the surface, the cloud deck lifted back up and produced small wave-like undulations within the anvil (ice) cloud.
To date, accurate prediction and an in-depth understanding of elevated convection in this environment has remained an elusive goal for researchers. Case studies like these allow researchers to study large rain producing events that impact the Great Plains agricultural region in detail.
A. Emory (612), S. Nicholls (JCET), and M. Coon (555)
Figure 2.4: This is an image of one type of precipitation observed at the FP2 site. This photo was taken looking west from the FP2 site in Greensburg, Kansas, on June 18, 2015.
2.1.5. First remote-sensing observations of convective bursts in a rapidly intensifying hur-ricane from the Global Hawk platform
Understanding and predicting the rapid intensification of hurricanes is among the most challenging prob-lems in atmospheric science due to the stochastic, turbulent nature of the primary forcing (convective clouds). In many cases, researchers require comprehensive observations from a variety of instruments to determine if there is some level of order in the chaotic evolution of convection. Using new NASA technologies, observations have indicated that deep convective clouds can be organized by mesoscale circulations at the eye/eyewall interface, which may provide some level of determinism for the predictive problem. During the NASAGRIP field experiment, scientists using GSFC’s HIWRAP radar flying on the unmanned Global Hawk aircraft—with additional measurements from the Jet Propulsion Laboratory’s (JPL) HAMSR radiometer and NOAA radars—obtained an unprecedented view of the rapid intensifica-tion of Hurricane Karl (2010) for approximately14 hours. Convective bursts formed in the hurricane through: (1 ) convergence generated from counter-rotating mesovortex circulations and the larger-scale vortex flow and (2 ) the turbulent transport of warm, buoyant air from the eye to the eyewall at low- to mid-levels. Figure 2.5 shows a conceptual diagram summarizing the measurements and analysis from the rapid intensification of Hurricane Karl. Red arrows denote the flow of air having anomalously warm characteristics. Green patches denote regions of convergence that formed due to the interaction between the mesovortex circulations and the larger scale vortex inflow.
Figure 2.5: A conceptual diagram summarizing the measurements and analysis from the rapid intensification of Karl. Red arrows denote the flow of air having anomalously warm characteristics. Green patches denote regions of convergence that form due to the interaction between the mesovortex circulations and the larger scale vortex inflow.
2.1.6. Engaging audiences about rain, snow and storms: GPM’s Rain EnGAUGE
The GPM education and communication team developed the Rain EnGAUGE project to make resources easily accessible for others to plan their own outreach events and further spread information about the mission and precipitation science, ultimately magnifying the effect of the small GPM core team. Rain EnGAUGE was intended to share the scientific information from the GPM mission in a way that is understandable to students, teachers, and the general public, rather than furthering the science itself. The program provides free precipitation education activities and resources available online (https://pmm.nasa. gov/education/rain-engauge). Thousands of people have learned about NASA Earth science generally and GPM specifically in events sponsored by or known to the GPM team. Other events may have used Rain EnGAUGE resources without any assistance from GPM. The concept of the program, best practices, and lessons learned have been shared with other NASA missions to help spread their own science messages.
2.1.7. Nonspherical ice particle models for precipitation remote sensing
At higher latitudes (greater than 40°N and less than 40°S), snow contributes a significant proportion of the net precipitation at the Earth’s surface, making it an important component of the global water cycle and a key climate indicator at those latitudes. The GPM Core Satellite Observatory is fitted with a downward-looking weather radar and passive microwave radiometer. These multichannel instruments were designed to work synergistically to estimate surface precipitation and precipitation vertical structure over the 65°S to 65°N latitude range.
Snow affects both spaceborne radar and microwave radiometer observations. Kuo et al. (2016) and other recent studies have begun to quantify the impact of snow particle shape on both radar reflectivities and the scattering of microwave radiances. Snow particles generally have irregular, nonspherical shapes; Kuo et al. simulated snow particles (2016) and computed their radiative properties. Although the nonsphericity of snow particles has an influence on radar reflectivities at GPM channel frequencies, it has its greatest impact on higher-frequency microwave radiances sensed by the GPM radiometer, such as those at 89 GHz and 166 GHz. This impact on microwave radiances is mainly due to less forward scattering by nonspherical particles relative to spheres of the same mass, leading to lower upwelling radiances at the higher frequencies. Therefore, the proper interpretation of the higher-frequency microwave channel data from GPM, as well as other microwave sensors such as SSMIS and AMSR2, depends on models of the atmosphere containing nonspherical snow particles. Proposed satellite missions such as ACE and CaPPM plan to utilize higher-frequency radar and passive microwave channels to interpret cloud and precipitation distributions. Further research into the structural and radiative properties of snow particles will be needed to better quantify their impact on remote-sensing observations.
K.-S. Kuo (612/UMD/ESSIC), W. Olson (612/UMBC/JCET), B. Johnson (612/UMBC/JCET), M. Grecu (612/MSU/GESTAR), L. Tian (612/MSU/GESTAR), T. Clune (610.1), B. van Aartsen (606/SSAI), A. Heymsfield (NCAR/UCAR),
L. Liao (612/MSU/GESTAR), and R. Meneghini (612)
2.1.8. Validation of ice particle models using airborne observations
At higher latitudes (greater than 40°N or less than 40°S), snow contributes a significant proportion of the net precipitation at the Earth’s surface, making it an important component of the global water cycle and a key climate indicator at those latitudes. The responses of the Ku/Ka band radar and multichannel micro-wave radiometer of the GPM mission to snow particles must be properly modeled so that GPM measure-ments can be used to accurately quantify snowfall rates. In this study, the scattering properties of snow particle models are evaluated using field campaign measurements from airborne HIWRAP and CoSMIR observations. The objective is to determine how well different snow particle models can be used to simul-taneously explain radar and radiometer observations from GPM-like instruments. Nonspherical snow models produce simulated radiances at 89 and 166 GHz that are consistent with CoSMIR observations, while simpler, spherical snow particle models do not. The proper interpretation of the higher-frequency microwave channel data from GPM, as well as other microwave sensors such as SSMIS and AMSR2, therefore depends on models of the atmosphere containing nonspherical snow particles. Proposed satellite missions such as ACE and CaPPM will utilize higher-frequency radar and passive microwave channels to interpret cloud and precipitation distributions, and so further research on the properties of snow particles will be needed to better quantify their impact on remote-sensing observations.
W. Olson (612/UMBC/JCET), L. Tian (612/MSU/GESTAR), M. Grecu (612/MSU/GESTAR), K.-S. Kuo (612/UMD/ESSIC), B. Johnson (612/UMBC/JCET), A. Heymsfield (NCAR/UCAR), A. Bansemer (NCAR/UCAR), G. Heymsfield (612), J. Wang, R. Meneghini (612)
Figure 2.6: Microwave radiances at 89 GHz (solid blue) and 166 GHz (solid red) simulated from the estimated precipitation profiles from HIWRAP, using spherical (upper panel) and nonspherical (lower panel) ice particle models. Width of curves indicates uncertainties due to humidity and precipitation size distribution variability. CoSMIR -observed radiances at 89 GHz (dashed blue) and 166 GHz (dashed red) are shown for comparison.
2.1.9. Improved cirrus cloud retrievals from new MPLNET algorithm
Information about cloud height, thickness, occurrence, and amount are critical inputs for a host of numeri-cal applications involving climate research. Therefore, it is important to have highly accurate and quan-titative data records of cloud properties that span several years and geographic regions. A new Version 3 algorithm has been developed to detect clouds from the Micropulse Lidar Network (MPLNET). When compared to Version 2, the Version 3 algorithm improves the ability to detect clouds at high altitudes (i.e. cirrus) and provides, for the first time, information about cloud phase and cloud optical depth (COD). The new algorithm increases the quality of detection for cirrus clouds, which is significant for studies of radiative forcing because cirrus are known to both warm and cool the atmosphere depending on their varying physical properties. Autonomous lidar monitoring projects, like MPLNET and CALIOP aboard the CALIPSO satellite, have already demonstrated that optically thin cirrus clouds are the most common cloud type in the earth–atmosphere system. Long-term ground-based datasets from MPLNET continue to provide crucial diurnal information to complement NASA satellite missions.
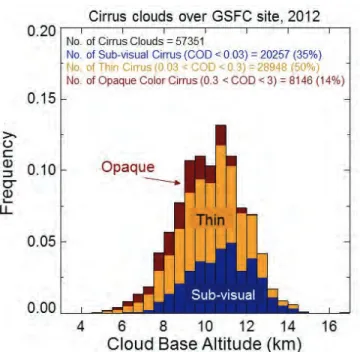
Figure 2.7: Distribution of cloud base heights for cirrus clouds observed over the GSFC site during 2012. The colors indicate the cirrus type based on the estimated cloud optical depth (blue for sub-visual, yellow for thin, and red for opaque color) using an effective extinction-to-backscatter ratio of 30 sr. The combination of sub-visual and thin cirrus clouds accounts for over 85 percent of the sample, which is significant because these clouds are the most difficult to detect using passive remote-sensing methods. However, it is noted that the limit to which the cirrus cloud optical depth could be reliably estimated occurs between of 0.5 and 0.8.
2.2. Climate and Radiation Laboratory
One of the most pressing issues humans face is to understand the Earth’s climate system and how it is affected by human activities now and in the future. This has been the driving force behind many of the activities in the Climate and Radiation Laboratory (613). Accordingly, the Laboratory has made major scientific contributions in five key areas: hydrologic processes and climate, aerosol-climate interaction, clouds and radiation, model physics improvement, and technology development. Examples of these con-tributions may be found in the list of refereed articles in Appendix II and in the material updated regularly on the Code 613 Laboratory Web site: http://atmospheres.gsfc.nasa.gov/climate/.
Key observational satellite efforts in the Laboratory include MODIS and MISR algorithm development and data analysis, SORCE solar irradiance (both total and spectral) data analysis and modeling, and TRMM and ISCCP data analysis. Leadership and participation in science and validation field campaigns provide key measurements as well as publications and presentations. Laboratory scientists serve in influential leadership positions on international programs, panels, and committees, serve as project scientists on NASA missions and PI’s on research studies and experiments, and make strides in many areas of science leadership, education, and outreach. Some of the Laboratory research highlights for the year are described below. They cover the areas aerosol-cloud-precipitation interactions, aerosol effects on climate, reflected solar radiation, land-atmosphere feedback, polar region variations, and hydrological cycle changes. The Laboratory also carries out an active program in mission concept developments, instrument concepts and systems development, and Global Climate Models (GCMs). The Projects link on the Climate and Radiation Laboratory Web site contains recent significant findings in these and other areas.
The study of aerosols is important to Laboratory scientists for many reasons: (1 ) Their direct and indirect effects on climate are complicated and not well-quantified; (2 ) Poor air quality due to high aerosol load-ings in urban areas has adverse effects on human health; (3 ) Transported aerosols provide nutrients such as iron (from mineral dust and volcanic ash), important for fertilization of parts of the world’s oceans and tropical rainforests; and (4 ) Knowledge of aerosol loading is important to determine the potential yield from the green solar energy sources. Highlights of Laboratory research activities carried out during the year 2016 are summarized below.
2.2.1. GPS radio occultation valuable for polar boundary layer studies
This study describes a unique GPS radio occultation (RO) refractivity-based algorithm to derive boundary layer properties (viz., inversion height and surface-based inversion frequency) for the dry polar atmo-sphere (total precipitable water ≤ 3.6 mm). The retrieval method is applied to multiyear GPS/Constellation Navigation Observing System (COSMIC) RO data over the remote Arctic Ocean during the cold season (November–April). For the ice-covered Arctic Ocean, the retrieved inversion height is found to be sensi-tive to the surface air temperature. An irregular peak in the RO-derived inversion height reflects the anomalous warming in the central polar ice pack during January 2012 (evidenced by higher-than-average surface air temperatures and below-average sea ice fraction). The refractivity-based retrieval method thus enables an independent evaluation of model and observations. It can also be used to investigate the bound-ary layer response to surface warming and to monitor the multiyear variability in polar climate. Changes to the Arctic Ocean and Greenland ice sheet have implications for the global population and should be monitored closely for geopolitical and climatic reasons.
This work was supported by NASA’s Constellation Observing System for Meteorology, Ionosphere, and Climate (GNSS) Remote-Sensing and Interdisciplinary Research in Earth Science programs. Given the promise for polar climate monitoring, GPS RO should be considered as a measurement capability in the portfolio of future NASA missions.
M. Ganeshan (613/GESTAR/USRA) and D. L. Wu (613)
2.2.2. A stable, high-quality aerosol data record from MODIS Terra Deep Blue
The calibration efforts by the MODIS Characterization Support Team and Ocean Biology Processing Group have resulted in high quality measurements by the Terra MODIS instrument going back to its launch in 2000. As a result, the new Collection 6 MODIS Terra Deep Blue time series is highly consistent with its MODIS Aqua (launched 2002) counterpart, without the strong divergence exhibited in MODIS Collection 5. Well-understood, accurate, and stable calibration of a satellite sensor is a requirement before attempting to detect trends in derived data sets such as aerosol loading or others. Sensors with calibra-tion drift can falsely mask or magnify real changes in the Earth system. The present study illustrates and confirms the potential of MODIS Terra Collection 6 data for scientific analyses of trend studies. To understand the long-term behaviour of the Earth system, stable records from historical, current, and future space-based sensors must be obtained and stitched together to move towards a long-term climate data record. One of the goals of the Deep Blue aerosol project is to achieve this by applying the same basic approach to monitor aerosols from sensors including (at present) SeaWiFS (1997–2010), MODIS Terra (2000 onwards), MODIS Aqua (2002 onwards), and S-NPPVIIRS (2012 onwards).
A. M. Sayer (613/GESTAR/USRA), N. C. Hsu (613), C. Bettenhausen (613/SSAI), M. J. Jeong (Gangneung-Wonju National University, Korea), and G. Meister (616)
Figure 2.8: This figure shows the global over land-area–weighted time series of Deep Blue (a) AOD from MODIS
Terra (red) and Aqua (blue), and (b) the time series and decadal trend in the Terra-Aqua AOD difference.
2.2.3. Aircraft observations help quantify smoke microphysical impacts on Arctic and subarctic clouds
The Arctic is experiencing a series of rapid environmental changes. Currently, our ability to predict future changes is hampered, in part, by a poor understanding of Arctic cloud-aerosol interactions, which affect the radiation budget. At the same time, Arctic and subarctic wildfires are increasing due to the changing climate, and might double or triple by the end of the century. Smoke is believed to have a large effect on cloud lifetime, albedo, and precipitation. However, the interactions between smoke particles and clouds remain poorly quantified due to confounding meteorological influences, remote-sensing limitations and biases (which are particularly high in the Arctic), and limited in situ observations. Here, we gathered data from multiple historic aircraft campaigns in the Arctic and subarctic to reduce these uncertainties. Smoke halved median cloud droplet radius in liquid clouds. In certain low-albedo conditions during the summer, we estimate that smoke-driven cloud indirect effects may decrease surface shortwave fluxes by 2 to 4 Wm-2 or more. These findings will be useful input for radiative transfer models and for constrain-ing the energy balance in a changconstrain-ing Arctic. Moreover, they will enhance the utility of remote-sensconstrain-ing observations, which show trends in clouds very well, but which, without context from in situ studies, can underestimate cloud albedo effects. Information from our study highlights the need to continue improve-ments to satellite retrievals of aerosol and cloud properties in polar regions.
L. Zamora (613/GESTAR/USRA) and R. Kahn (613)
2.2.4. The missing tropical arm of the Atlantic Multidecadal Oscillation
In the current generation of global climate models, the tropical arm of the Atlantic Multidecadal Oscillation (AMO) is often absent. Using many years of satellite observations, we show that positive feedbacks from low clouds and dust are critical. However, models fail to produce these feedbacks because of miss-ing both physics and a key coupled atmosphere-ocean teleconnection between high and low latitudes. This is the first study that highlights the connection between mid- to low-latitude SST anomalies in the North Atlantic and discovers the positive feedbacks from dust and low clouds. Our analysis reveals the common weakness in current global climate models that fail to simulate the tropical arm of AMO that is
an important source of predictability at decadal time scale, an important new research area. The study also underscores that for low frequency climatic oscillations like the AMO long time series of satellite data are essential for understanding the nature and behavior of the processes involved.
T. Yuan (613/UMBC/JCET), L. Oreopoulos (613), H. Yu (613/UMD/ESSIC), M. Chin (614), S. Platnick (610), K. Meyer (613/GESTAR/USRA)
2.2.5. DSCOVR[ing] EPIC’s utility for cloud retrievals
The Deep Space Climate Observatory (DSCOVR) satellite was launched on February 11, 2015, and in June 2015 began making observations of both the Earth and the Sun from its Lissajous orbit about the Earth’s L1 Lagrange point, a gravity neutral position near the Sun-Earth line 1.5 million km from the planet. The DSCOVR payload includes the Earth Polychromatic Imaging Camera (EPIC) that views the entire sunlit half of the Earth continuously at near backscatter directions (scattering angle between 164° and 176°) at a native spatial resolution of 8 km at nadir. Numerous geophysical products will be derived from EPIC observations at 10 spectral channels ranging from the ultraviolet to the near-infrared that are sensitive to various atmospheric and surface components, and can provide information on ozone, aerosol, cloud, and vegetation properties. NASA’s EPIC cloud products will include cloud detection, cloud optical thickness (COT), and cloud effective height derived from the oxygen (O2) A- and B-band observations. The EPICCOT product will be produced with the same core algorithms as those used by the operational MODerate-resolution Imaging Spectroradiometer (MODIS) cloud optical and microphysical property product (MOD06/MYD06 for Terra/Aqua) that provides cloud-top pressure, temperature, and height retrievals, as well as simultaneous two-channel retrievals of COT and cloud effective particle radius (CER) and cloud phase retrievals using a variety of spectral tests. However, because the EPIC spectral channel set does not extend to wavelengths longer than near-infrared, COT retrievals will be performed using a single-channel approach similar to that of the International Satellite Cloud Climatology Project (ISCCP) and the Multi-angle Imaging SpectroRadiometer (MISR) mission, assuming fixed values for CER. Since COT can be dependent on CER, single-channel COT retrievals are prone to errors larger than those of the two-channel COT-CER retrievals. Cloud thermodynamic phase will be inferred by imposing thresholds on cloud temperature converted from O2 A-band cloud effective height retrievals, an approach different from MOD06 that relies on measurements in infrared window and CO2 absorption channels. Here, the team degraded the 1-km Aqua MODIS observations to 25-km spatial resolution to investigate the impacts of EPIC’s coarser spatial resolution and limited spectral channel set on retrievals of cloud thermodynamic phase and COT, as well as their aggregated statistics. Results show that EPIC can provide COT retrievals mostly within 10 percent uncertainty for liquid phase clouds, and within 2 percent for ice phase clouds.
K. Meyer (613/GESTAR/USRA), Y. Yang (613/GESTAR/USRA), and S. Platnick (610)
2.2.6. A new method to quantify smoke and dust aerosols above clouds
Light-absorbing smoke and mineral-dust aerosols above clouds (AAC) are omitted from most passive space-based aerosol optical depth (AOD) data sets. We developed a method to determine above-cloud AOD and liquid cloud optical depth (COD) from MODIS and similar sensors, for incorporation into the NASA Deep Blue AOD data set.
Most existing satellite AOD retrieval algorithms determine the total column AOD only for clear-sky pixels. In cloudy conditions, no retrieval is performed. This leads to significant data gaps in the derived
satellite AOD records, which is doubly unfortunate because some of the large-scale recurring absorbing aerosol features, such as from springtime biomass burning in southeastern Asia, occur in very cloudy environments. Extending the coverage of these data sets to include cases of AAC renders them more useful for monitoring aerosol transport or evaluating climate model output. These techniques can be applied directly to multiple past, present, and future NASA and international Earth-orbiting satellite data, providing a means to decrease coverage gaps in these data sets.
Two MODIS scenes with AAC were analyzed using NASA Ames Airborne Tracking Sun photometer (AATS) data as a truth AOD and Angström exponent (ANG) data source, demonstrating the validity of the technique with real observations.
A. M. Sayer (613/GESTAR/USRA), N. C. Hsu (613), C. Bettenhausen (612/SSAI), and J. Lee (612/UMD/ESSIC)
Figure 2.9: A MODIS true-color image from September 13, 2000, of smoke-laden clouds off the African coast (left), and mid-visible AOD above these clouds determined using the new algorithm developed in this study (right). The green box indicates the region of a same-day flight of the University of Washington’s Convair-580 aircraft, upon which the
AATS instrument was mounted.
2.2.7. Effects of DSCOVR temporal sampling frequency quantified with GEOS-5 Nature Run
Orbiting around the Earth’s L1 Lagrange point, the DSCOVR satellite always stays near the Sun-Earth line. At this location, which lies around 1.5 million km away from the Earth, DSCOVR can view the entire daytime hemisphere continuously. Observations from the two Earth-observing instruments onboard, the National Institute of Standards and Technology Advanced Radiometer (NISTAR) and the Earth Polychromatic Imaging Camera (EPIC), are being used to derive information about the Earth’s radiation budget, cloud, aerosol, ozone, and vegetation. We investigate how subsampling affects the calculated mean and how close the sampled time series is to the truth using GEOS-5 Nature Run data.
DSCOVR sampling of global radiation and cloud cover is simulated using high spatial resolution output from NASA’s GEOS-5 model. We find that the less frequent the sampling, the worse the correlation between the subsample and the original time series, as expected. On the other hand, more frequent sam-pling is not as beneficial as expected due to errors in the global monthly, seasonal, and annual means. For example, the uncertainty in the Figure below is larger for 6-hour sampling than for 7, 9, 10 and 11 hours.
This is due to the Earth’s 24-hour rotation cycle. Using sampling frequencies that are a factor of 24 result in repeatedly capturing specific parts of the cycle, introducing a bias. As shown by DSCOVR, satellites located at the L1 point has the unique advantage in observing the climate system. In the future, should a DSCOVR follow-up be planned, this study could provide general guidance in the sampling strategy.
D. Holdaway (610.1/GESTAR/USRA) and Y. Yang (613/GESTAR/USRA)
Figure 2.10: Left: Mean of the correlation coefficients between the original and subsampled global total outgoing radiation time series as a function of temporal sampling frequency. The different curves represent different time scales. Right: The error in the global mean total outgoing radiation derived from the subsampled time series as a function of temporal sampling frequency.
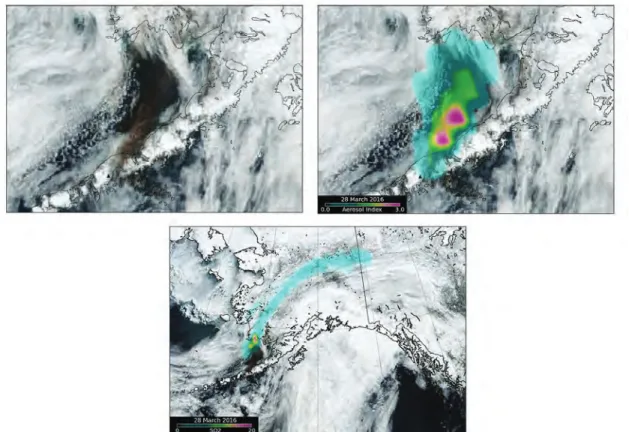
2.2.8. Alaska, Greenland, Iceland, and Patagonia are active dust producing regions
Scientists expect high-latitude glaciers and ice sheets to retreat during the 21st century. Dust activity can occur during cold, dry conditions in these environments. An international, multidisciplinary collaboration assessed the state of knowledge and current understanding of contemporary dust activity of high-latitude dust sources. Possible impacts (some of them already observed) include changes in air quality and snow/ ice albedo, and nutrient deficient marine ecosystems. Under contemporary environmental conditions, 80–100 Tg yr-1 of dust is contributed to the global dust cycle from high-latitude sources; this very rough estimate represents up to five percent of the global dust budget. However, with receding glaciers and ice fields as well as expansion of human settlements towards high latitudes, it is expected that air quality issues and regional aerosol direct effects will become more apparent. In addition, Aeolian deposition of glacier silt will increase over nutrients deficient marine ecosystems with unknown biogeochemical impacts. Understanding current high-latitude dust in the Earth system, even at relatively small scales, requires a multidisciplinary approach combining expertise in geomorphology, glaciology, meteorology, oceanography, sedimentology, atmospheric sciences, and other specializations. It also requires the use of a range of research tools including fieldwork, experimentation, observational networks, modeling, and especially remote sensing.
Figure 2.11: MODIS Aqua image on December 4, 2012, showing a major dust plume originating from the Copper River Valley and extending >200 km over the Gulf of Alaska. The dust cloud reaches a region known to be deficient of the micronutrient iron.
2.2.9. Advancements in observing and modeling coupled aerosol-cloud systems
The inaugural deployment of GSFC’s SMARTLabs-ACHIEVE mobile laboratory, in conjunction with ground-based cloud radar monitored for the first time the evolution of pre-monsoon continental strato-cumulus in the presence of biomass-burning aerosols. Such detailed observations are critical for improv-ing models simulatimprov-ing aerosol-cloud-precipitation processes and for validatimprov-ing future spaceborne cloud measurements.
Ground-based cloud radar measurements, though spatially limited, provide detailed information on low-level stratocumulus cloud properties currently not attainable from much coarser resolution spaceborne radar systems—which also suffer from surface clutter and signal attenuation. Such data can be used to both constrain and evaluate models that simulate the potential impacts of these coupled aerosol-cloud sys-tems on local and regional weather and air quality. Because microphysical processes and cloud radiative properties depend on the cloud/raindrop size distribution (CDSD), accurate CDSD prediction is critical. The modeling portion of this study employed a new triple-moment (3M) bulk microphysics scheme for fully prognostic CDSDs as an efficient alternative to computationally expensive size-resolving (bin) microphysics schemes. Deployable ground-based cloud radar provided critical measurements of cloud properties in regions with strong aerosol-cloud interaction signals that will aid the design of future space-borne cloud measurements (e.g., a NASAACE-like mission). Systematic model simulations, utilizing the GCE with 3M microphysics, and a larger-scale regional model (e.g., NU-WRF) equipped with a detailed aerosol module, can bridge the gap between in situ and remote measurements at field campaigns and collocated satellite measurements for understanding the physical processes involved in aerosol-cloud interactions.
Figure 2.12: Time series of radar reflectivity showing in unprecedented detail the nighttime development/ encroachment of a stratocumulus deck and evolution into a lightly precipitating system (after ~02:00 local time) on April 7–8, 2013, over Yen Bai, Vietnam during the Seven Southeast Asian Studies/Biomass-burning Aerosols and Stratocumulus Environment: Lifecycles and Interactions Experiment (7-SEAS/BASELInE) campaign. Breaks in reflectivity time series coincide with radar scans in range height indicator and plan position indicator modes.
2.2.10. Fire-induced land conversion to cropland is increasing in middle Africa
Northern Sub-Saharan Africa (NSSA) accounts for 20 to 25 percent of the global carbon emissions from biomass burning. Widespread burning that peaked in 2006 influences land-cover changes that result in a net conversion of 0.28 percent/year of the total land area to cropland, with the majority (0.18 percent/ year) coming from savanna. Over the last decade, the trend is increasing from savanna, forest, and wet-lands to cropland. Given such overwhelming occurrence of biomass burning in this region and its inherent potential to affect vegetation changes, land degradation, deforestation, surface albedo, aerosol emissions, and surface evapotranspiration, it is reasonable to hypothesize that biomass burning, directly or indirectly, exerts significant impact on NSSA’s environmental dynamics and water cycle across different spatial and temporal scales. These results provide observational evidence of changes in land-cover that are consistent with feedbacks from biomass burning in NSSA and encourage more synergistic modeling and obser-vational studies (including field campaigns) that can elaborate this feedback mechanism and its wider ramifications
C. Ichoku (613) and L. Ellison (613/SSAI)
2.2.11. Diurnal cycle and evolution of tracked cold-cloud clusters
Storms are a major contributor to natural hazards, so understanding how and when cloud development occurs is important for storm prediction. Tracking clouds using overlapping clusters between satellite images allows scientists to study their trajectories. By analyzing millions of clouds in this manner, we can determine the time of day that major storm phases occur. Our results show that during their life cycle, cloud clusters typically undergo distinct life cycle stages. However, the clusters with longer and shorter lifetimes mature differently: Long-lasting clusters tend to achieve their temperature maturity before size maturity, thereby prolonging this stage. Timing wise, afternoon development is more likely over land, while over the ocean there are two peaks in activity: one in the early morning and one in the afternoon. This study provides the first big picture survey of cold-cloud cluster evolution, characteristics, and daily cycle.
Figure 2.13: Climatology of cloud cluster trajectories acquired January to August 2002–2012, with 6- to 9-hour lifetimes binned at 2° x 2°. Lines show average displacement of all cloud clusters that initiated at the same point over the 11-year period studied. Coloring indicates net zonal movement of clusters. Grid boxes with fewer than five initiations were not displayed.
2.3. Atmospheric Chemistry and Dynamics Laboratory
The Atmospheric Chemistry and Dynamics Laboratory (614) conducts research including both the gas-phase and aerosol composition of the atmosphere. Both areas of research involve extensive measurements from space to assess the current composition and to validate the parameterized processes that are used in chemical and climate prediction models. This area of chemical research dates back to the first satellite ozone missions and the Division has had a strong satellite instrument, aircraft instrument, and modeling presence in the community. Both the EOS Aura satellite and the Ozone Monitoring Instrument (OMI) instrument U.S. Science team come from this group. The Laboratory also is a leader in the integration and execution of the NPOESS Preparatory Mission (NPP) mission, and is also providing leadership for the former NPOESS, now the newly reorganized Joint Polar Satellite System (JPSS). This group has also developed a state-of-the-art chemistry-climate model, in collaboration with the Goddard Modeling and Analysis Office (GMAO). This model has proved to be one of the best performers in a recent international chemistry-climate model evaluation for the stratosphere. Highlights of Laboratory research activities carried out during the year are summarized. Dry deposition of NO2 and SO2 contributes excess nitro-gen and sulfur to vegetation, soil, and water. Deposited nitronitro-gen can cause eutrophication, leading to a loss of biodiversity. Deposited nitrogen and sulfur both have the potential to acidify soil and water, and may influence climate by perturbing the carbon uptake of an ecosystem. Measurements of NO2 and SO2 columns from OMI in combination with the GEOS-Chem chemical transport model have provided the first global budgets and estimates of spatial patterns of NO2 and SO2 dry deposition. These results have potential applications in a range of fields, from atmospheric chemistry to ecology. The upcoming NASA Earth venture mission called Tropospheric Emissions: Monitoring of Pollution (TEMPO) will allow dry deposition to be quantified at very high spatial and temporal resolution.
2.3.1. Total ozone comparison between SNPP/OMPS and DSCVR/EPIC
We have obtained estimates for the calibration coefficients K (317.5), K (325 nm), and K (340 nm) that yielded an improved (right) ozone retrieval that has been compared with the same day as observed from Suomi/ Ozone Mapping and Profile Suite (OMPS) (Figure 2.14, left). The calibration estimates will be