Preprint typeset using LATEX style emulateapj v. 12/14/05
JETS IN CORONAL HOLES: HINODE OBSERVATIONS AND 3D COMPUTER MODELLING F. Moreno-Insertis1,2, K. Galsgaard3, I. Ugarte-Urra4,5
Accepted for publication in ApJ Letters, 10 Dec 2007
ABSTRACT
Recent observations of coronal hole areas with the XRT and EIS instruments onboard the Hinode satellite have shown with unprecedented detail the launching of fast, hot jets away from the solar surface. In some cases these events coincide with episodes of flux emergence from beneath the pho-tosphere. In this letter we show results of a 3D numerical experiment of flux emergence from the solar interior into a coronal hole and compare them with simultaneous XRT and EIS observations of a jet-launching event that accompanied the appearance of a bipolar region in MDI magnetograms. The magnetic skeleton and topology that result in the experiment bear a strong resemblance to lin-ear force-fee extrapolations of the SOHO/MDI magnetograms. A thin current sheet is formed at the boundary of the emerging plasma. A jet is launched upward along the open reconnected field lines with values of temperature, density and velocity in agreement with the XRT and EIS observations. Below the jet, a split-vault structure results with two chambers: a shrinking one containing the emerged field loops and a growing one with loops produced by the reconnection. The ongoing reconnection leads to a horizontal drift of the vault-and-jet structure. The timescales, velocities, and other plasma properties in the experiment are consistent with recent statistical studies of this type of events made with Hinode data.
Subject headings: Sun: X-rays — Sun: Magnetic fields — Sun: Corona
1. INTRODUCTION
X-ray jets in coronal holes are being observed with un-precedented quality by the instruments onboard the Hin-ode satellite, in particular the X-Ray Telescope (XRT) (Golub et al. 2007) and the Extreme UV Imaging Spec-trometer (EIS) (Culhane et al. 2007). With their en-hanced sensitivity and spatial resolution, those instru-ments have revealed that the frequency of jet formation is at least an order of magnitude greater than was thought previously (Cirtain et al. 2007). The new observations are leading to an in-depth revision of the statistics of jet properties (Shimojo et al. 1996; Savcheva et al. 2007). Sometimes, the formation of the jet is seen to occur si-multaneously with an episode of flux emergence from the solar interior (e.g., Canfield et al. 1996; Jiang et al. 2007). In many XRT events, a brightening close to the sur-face is followed by enhanced emission in a region with aninverted-Yshape above the former (Fig. 1). The tail of the invertedYcoincides with a fast jet.
This kind of jets is most probably a consequence of the field line reconnection between the upcoming magnetic system and the open ambient field in the coronal hole, as originally suggested by theory and 2D numerical ex-periments (Heyvaerts et al. 1977; Yokoyama & Shibata 1996). In this letter, we analyze XRT and EIS obser-vations of a jet in a coronal hole cospatial with a si-multaneous flux emergence event observed with SOHO-MDI (Sec. 2). We study the magnetic topology using
1
Instituto de Astrofisica de Canarias (IAC), 38200 La Laguna (Tenerife), Spain; [email protected]
2
Also at Department of Astrophysics, Faculty of Physics, Uni-versidad de La Laguna, Tenerife, Spain
3
Niels Bohr Institute, University of Copenhagen, Copenhagen, Denmark; [email protected]
4
Space Science Division, Naval Research Laboratory, Washing-ton DC 20375, USA; [email protected]
5
Also at College of Science, George Mason University, 4400 Uni-versity Drive, Fairfax, VA 22030, USA
linear force-free extrapolations from the MDI data. We then present the results of a three-dimensional experi-ment of flux emergence into a region in the atmosphere with temperature, density and magnetic field values akin to those in a coronal hole (Sec. 3). We explain the re-sulting three-dimensional structure (geometry, topology, dynamics) and show the excellent overall agreement with the observations.
2. OBSERVATIONS
A large coronal hole was observed near disk center on March 10, 2007 by the Hinode satellite (Kosugi et al. 2007). We present EIS and XRT observations of a jet that appeared at 06:20 UTC at solar coordinates (−25′′,−115′′) within the equatorial hole, at the same time as a magnetic bipole emerged at the photosphere (Fig. 2). A low-latitude event was chosen to facilitate the extrapolation and radial velocity measurement. The evolution of the jet was inspected using XRT 512×512 pixel images taken in the Open/Ti poly filter combina-tion at a cadence of 70 s. Spatial sampling is 1′′ per pixel. The EIS observations consisted of 30 s exposures in sit-and-stare mode with the 1′′×512′′slit. Standard routines were used in the data processing. The alignment between both instruments was done via cross-correlation of North-South cross-sections of the X-ray images with the FeXIIemission along the EIS slit. Accuracy is down
to between 1′′and 2′′ in the N-S direction and less than 5′′ in the E-W. For the analysis of the magnetic flux density we used full disk magnetograms from SOHO-MDI (Michelson Doppler Imager, Scherrer et al. 1995). Only magnetograms with a 96-min cadence were avail-able at the time of the jet. The closest one in time (06:27 UTC) shows a newly emerged bipole under the location where the jet is formed. The magnetic flux density of the emerged polarities is in the range (-70, 88) Mx cm−2[i.e., (−7,8.8) 10−7Wb m−2] with total fluxes of≈1×10¹⁹
Mx = 1×10¹¹ Wb. The magnetic topology was deter-mined with a linear force-free extrapolation method (see details in Ugarte-Urra et al. 2007) and reveals the exis-tence of a coronal null point and a separatrix dome that encloses the connectivity domain of the newly emerged flux.
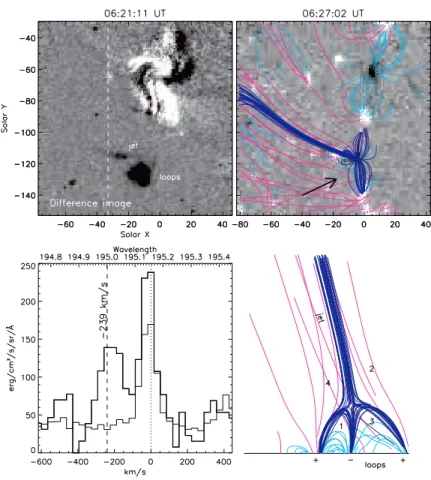
In the XRT images (as, e.g., in the top-left panel of Fig. 2), we first see the appearance of small coronal loops that connect the pre-existing dominant ambient positive flux to the newly emerged negative polarity. This is fol-lowed immediately by the formation of the jet, oppositely oriented and rooted in the positive flux, with the foot-points most likely located where the separatrix surface intersects the photosphere. The top-right panel of the figure shows the relationship of the loops and jet to the magnetic topology from the extrapolation. The bottom right panel shows a side view of the topology with four la-beled connectivity domains. In region 1 lie the magnetic connections between the two newly emerged polarities. The loops on the XRT image correspond to region 3. A natural explanation for this configuration is that the emerging flux (region 1) is merging with flux from region 2 yielding two reconnected-line regions (3 and 4). The jet must be in an open-field region, so it must be in region 4, and close to the separatrix (dark-blue field lines). This is consistent with what the projected extrapolation and the XRT image suggest and is also in agreement with the results of the numerical simulation presented in Sec. 3. At least two consecutive jet events can be identified in the XRT movie before the loops grow and finally pop-ulate the whole enclosed domain. The initial and most impulsive phase lasts around 12 min.
The EIS slit crosses the jet structure at about 15′′ to the East side of its origin. EIS’s unique combination of high spatial, spectral and temporal resolution can pro-vide diagnostics for the density and velocity (for an in-depth discussion of previous EUV spectroscopic observa-tions of jets see Wilhelm et al. 2002; Ko et al. 2005; Pike & Harrison 1997 and references therein). On the jet we measured (Fig. 2, bottom-left panel) a line-of-sight blue-shifted velocity of up to 240 km s−1in the FeXII 195.12-˚
A line. The zero value is given by an average profile in the quiet coronal hole. After averaging two pixels along the slit and two exposures, to increase the signal-to-noise ratio, and subtracting the background emission, we also obtained an estimate for the electron density through the line ratio FeXII195.1/186.9: 5.5×109cm−3. The density estimate is consistent with a filling factor of≈0.2 for the FeXII195.1˚A column emission measure, assuming
pho-tospheric abundance (Grevesse et al. 2007), a temper-ature corresponding to the maximum in the ionization fractions (Mazzotta et al. 1998) and a column depth of 4.7 Mm, equal to the jet’s measured width. We used CHIANTI v5.2 (Landi et al. 2006) for the calculations.
3. NUMERICAL EXPERIMENT
The numerical results were obtained for a three-dimensional domain of size 34 Mm×38 Mm in the hor-izontal directions and 33 Mm in the vertical direction, z, 29 Mm of which are above the photosphere. For the unmagnetized hydrostatic background at timet = 0 we chose an adiabatic stratification in the solar interior and a domain at photospheric temperature in the first 2 Mm above the surface; above it, we have a steep temperature
gradient mimicking the transition region and, finally, an isothermal (T = 1.1×10⁶K) corona in the topmost 25 Mm (as in Fig. 1 of Archontis et al. 2004, but with a much larger vertical domain). In the main experiment described here, ρtop, the initial coronal density at the top of the box, was 5×10⁻¹⁶ g cm−3, equivalent to an atom number density of ≈2×108 cm−3. The domain is endowed at time t= 0 with a uniform magnetic field contained in thexz plane of strengthBamb= 10 G = 10 mT and pointing 25◦ away from the vertical. This field is dynamically dominant in the corona [β ≈ O(10−2)], whereas it is very weak (β ≫ 1) in the solar interior. Density and field strength are adequate to simulate coro-nal holes (see Wilhelm 2006; Harvey & Recely 2002). To explore the parameter space, experiments have also been carried out for Bamb equal to 25 G and 5 G, for ρtop = 1.5×10⁻¹⁴ g cm−3, and for inclinations of 15◦ and 0◦ to the vertical. We solve the MHD equations and assume an ideal gas law, no radiation cooling, and no heat conduction. The system is solved using the staggered-grid MHD code of our previous experiments (Nordlund & Galsgaard 1997; see Archontis et al. 2004). The numerical grid is non-uniform in the vertical direc-tion, with minimum resolution of 5.3 points per scale height (pps) in the photosphere (65 pps in the corona), and has 350×322×320 nodes in the (x, y, z) directions. The emergence process is initiated by including a twisted magnetic flux tube with axis along the y coor-dinate direction located 1.7 Mm below the photosphere and with maximum field strength 3.8 kG. The tube is endowed with buoyancy in its central part so that it rises and reaches the surface in about 15 min. The main features of these initial phases are as described in our previous experiments (e.g., Archontis et al. 2004, 2005). Once in the atmosphere, the rising plasma has a con-siderable magnetic pressure excess and expands in all directions, albeit preferentially horizontally, whereby it adopts a helmet shape protruding from the solar inte-rior. The pressure of the ambient coronal field opposes the expansion and the emerged volume reaches a max-imum size of about 8 Mm in height, 11 Mm in the x direction (i.e., transverse to the original tube axis) and 17 Mm in the ydirection.
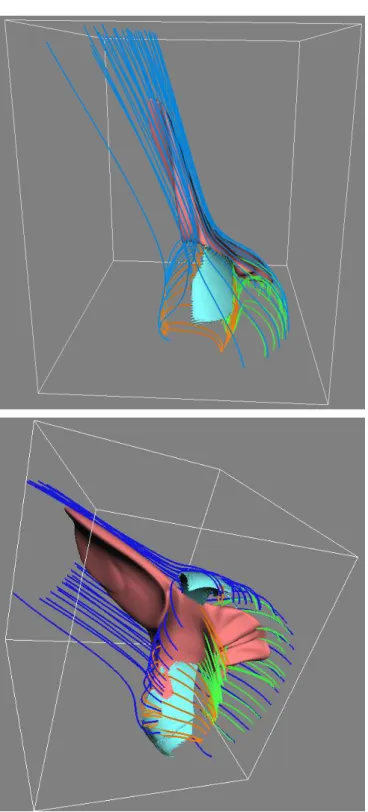
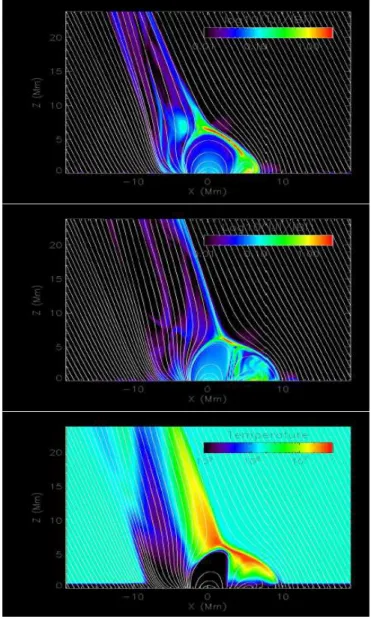
The expansion just described firmly presses against each other the magnetic field in the emerged volume and the ambient corona. The field in the rising plasma is twisted around the tube axis; hence, it is almost coun-teraligned with the coronal field on one of the sides of the emerging volume. A thin, elongated current sheet is thereby formed (blue isosurface in Fig. 3) that embraces that side of the volume, resembling those obtained by Archontis et al. (2005). Seen in a vertical cut, the sheet appears as a thin stripe (in red in Fig. 4, top panel) of Syrovatskii type. Reconnection takes place across the current sheet: the arch-like loops next to it inside the helmet merge with the open loops coming in from the other side of the sheet. Two regions of reconnected field result; at the thin edge at the top of the current sheet, a set of open field lines are ejected: that region is visible in Fig. 4 (top panel) as a vertical band of diffuse current perturbations. At the lower edge, closed coronal loops ensue.
lower edge of the current sheet. The outflow at the upper edge (Fig. 4, center) is roughly horizontal and reaches peak speeds around 400 km s−1(of order the lo-cal Alfv´en speed). Shortly after leaving the reconnection site, it is deflected into two secondary jets propagating upward and downward along the field lines, basically as described in 2D by Yokoyama & Shibata (1996). The up-going branch attains vertical velocities above 200 km s−1 (Fig. 4, center). High temperature values are reached in the jets and in the reconnection site itself. At the peak of activity (Figs. 3 and 4), the 6.5×10⁶K isosurface (in pink in Fig. 3) extends over the current sheet and into the jet. Values as high as 3×10⁷K (reconnection site) and slightly above 107 K (jet) are reached (Fig. 4, bottom). The high-T regions have the shape of an inverted-Y on top of the emerged material (Figs. 3 and 4), not unlike those observed by Hinode (Fig. 1). The density of the jet at the peak of activity is about 10 times the density of the unperturbed corona.
As reconnection proceeds, a double-chambered vault structure of closed loops develops below the jet, visible below the blue stripe in Figs. 3 and 4 (center and bot-tom panels): in one of the chambers (the emerged cham-ber), coronal loops with the original connectivity are still present; in the other (the reconnected chamber), the new set of closed, high-T coronal loops are being stored. The whole system strongly resembles the topology obtained in Sect. 2 through extrapolation from MDI data. As time proceeds, the emerged chamber decreases in trans-verse size while the reconnected chambergrows to a size similar to the original emerged volume. There results an apparent sidewaysdriftof the vault and of the jet in the direction toward the reconnected loops, with roughly 10 km s−1 drift speed. This may correspond to the drift discussed by Savcheva et al. (2007).
The main phase of reconnection with jet speeds above 100 km s−1lasts around 7 min, followed by an extended phase with lower temperature and jet velocities, for a total duration of some 20 min. In the early stages of reconnection, in turn, we observe cool and dense plasma being ejected from the reconnection site. At that stage, the high-density shell that covers the emerging plasma is being merged with the ambient coronal field. The re-sulting reconnected open field lines become loaded with high-density [ρ≈O(102ρtop)], low-T [O(105) K] material (visible to the left of the hot jet in Fig. 4, bottom panel).
4. DISCUSSION
In this letter we have shown that the inverted-Y shaped jets recently observed by Hinode/XRT in coronal holes are a natural consequence of the emergence of magnetic flux from below the surface and its interaction with the preexisting open field in the coronal hole. Flux emer-gence is a prime candidate to trigger reconnection and the consequent launching of jets along field lines in the corona, as proposed through theoretical or 2D numerical results (Heyvaerts et al. 1977; Yokoyama & Shibata 1996) and through 3D experiments of jet formation in a hori-zontally magnetized atmosphere (Archontis et al. 2005; Galsgaard et al. 2007). Our present 3D experiments had a field configuration and stratification parameters akin to those in a coronal hole. The match we obtain be-tween the X-Ray, EUV and magnetogram data and the numerical results is highly satisfactory concerning over-all geometry, topology of the magnetic field, and density, temperature and velocity of the plasma. Various basic features obtained through 2D vertical cuts in our exper-iments agree qualitatively with the results of Yokoyama & Shibata (1996), in spite of the differences in parameter values. Beyond all that, our experiments permit discern-ing for the first time the 3D geometry of this type of events.
A number of refinements must be implemented for a better test of the match of the present numerical results with the observations, like heat conduction or radiative cooling. Those improvements are being included into this research at present.
Financial support by the European Commission through the SOLAIRE Network (MTRN-CT-2006-035484) and by the Spanish Ministery of Educa-tion through project AYA2007-66502 is gratefully ac-knowledged, as are the computer resources, techni-cal expertise and assistance provided by the MareNos-trum (BSC/CNS, Spain) and LaPalma (IAC/RES, Spain) supercomputer installations. Support from the NASA/Hinode program and from the Velux foundation is also acknowledged. Hinodeis a Japanese mission devel-oped and launched by ISAS/JAXA, with NAOJ, NASA and STFC as partners, and co-operated with ESA and NSC. SOHO is a project of cooperation between ESA and NASA.
REFERENCES Archontis, V., Moreno-Insertis, F., Galsgaard, K., & Hood, A. 2005,
ApJ, 635, 1299
Archontis, V., Moreno-Insertis, F., Galsgaard, K., Hood, A., & O’Shea, E. 2004, A&A, 426, 1047
Canfield, R. C., Reardon, K. P., Leka, K. D., Shibata, K., Yokoyama, T., & Shimojo, M. 1996, ApJ, 464, 1016
Cirtain, J. W., Golub, L., Lundquist, L., & et al. 2007, Science, in press
Culhane, J. L., Harra, L. K., James, A. M., & et al. 2007, Sol. Phys., 243, 19
Galsgaard, K., Archontis, V., Moreno-Insertis, F., & Hood, A. 2007, ApJ, 666, 516
Golub, L., Deluca, E., Austin, G., & et al. 2007, Sol. Phys., 243, 63
Grevesse, N., Asplund, M., & Sauval, A. J. 2007, Space Science Reviews, 130, 105
Harvey, K. L. & Recely, F. 2002, Sol. Phys., 211, 31
Heyvaerts, J., Priest, E. R., & Rust, D. M. 1977, ApJ, 216, 123
Jiang, Y. C., Chen, H. D., Li, K. J., Shen, Y. D., & Yang, L. H. 2007, A&A, 469, 331
Ko, Y.-K., Raymond, J. C., Gibson, S. E., & et al. 2005, ApJ, 623, 519
Kosugi, T., Matsuzaki, K., Sakao, T., & et al. 2007, Sol. Phys., 243, 3
Landi, E., Del Zanna, G., Young, P. R., Dere, K. P., Mason, H. E., & Landini, M. 2006, ApJS, 162, 261
Mazzotta, P., Mazzitelli, G., Colafrancesco, S., & Vittorio, N. 1998, A&AS, 133, 403
Nordlund, A. & Galsgaard, K. 1997, Tech. Rep., Astron. Observ., Copenhagen Univ.
Pike, C. D. & Harrison, R. A. 1997, Sol. Phys., 175, 457
Savcheva, A., Cirtain, J., DeLuca, E., & et al. 2007, Submitted to PASJ
Scherrer, P. H., Bogart, R. S., Bush, R. I., & et al. 1995, Sol. Phys., 162, 129
Shimojo, M., Hashimoto, S., Shibata, K., Hirayama, T., Hudson, H. S., & Acton, L. W. 1996, PASJ, 48, 123
Ugarte-Urra, I., Warren, H. P., & Winebarger, A. R. 2007, ApJ, 662, 1293
Wilhelm, K. 2006, A&A, 455, 697
Wilhelm, K., Dammasch, I. E., & Hassler, D. M. 2002, Ap&SS, 282, 189
Fig. 1.—Polar coronal jet observed with XRT Al poly/Open filter combination on the South coronal hole on January 20 2007. Color scale is reversed.
Fig. 2.—Coronal jet observed in an equatorial coronal hole on March 10 2007. Top left panel: difference XRT Open/Ti poly image of the jet; the dashed line indicates the EIS slit position. Top right: MDI magnetogram and linear force free magnetic field extrapolation (α=−0.007 Mm−1); the color code is: a) dark blue: field lines near the apparent magnetic null and the separatrices; b) light blue: field
lines with two foot-points in the photosphere; c) red lines: open field lines. Bottom right: side view as indicated by the black arrow in the panel above. Numbers indicate connectivity regions. Bottom left: FeXII195.1 ˚A spectral profile at the jet location (thick line) at 06:21 UT. The thin line corresponds to an average profile elsewhere in the coronal hole.
Fig. 3.—Three-dimensional view of the emerged region, the reconnection site and the jet at the time of peak reconnection activity (top: side view; bottom: view from below). The isosurface ofj/B (in blue) delineates the collapsed current sheet on the side of the emerged volume. The temperature isosurface (T = 6.5×10⁶K; in red) encompasses both the reconnection site and the jet volume. Underlying the
jet and current sheet, a double set of current loops (emerged and reconnected, with field lines in orange and green, respectively) is visible, giving a ’double-chambered’ vault shape to the region below the jet.
Fig. 4.—Vertical cuts at different stages of the evolution. Top: j/Bdistribution and field line projection at an early stage. A thin current sheet is situated to the top-right of the emerged coronal loops. The diffuse, elongated current perturbations to the top and left of the emerged volume correspond to previously reconnected field lines. Center: total velocity map and field line projection at the peak activity phase of the jet, occuring about 7 min later than the top panel. The double-chambered structure below the jet is clearly visible. Bottom: temperature distribution for the same snapshot as the central panel. An inverted-Y structure appears prominently, withT≈3 107