The relative importance of
working capital management and
its components to SMEs’
profitability
Venancio Tauringana and Godfred Adjapong Afrifa
Department of Accounting, Finance and Economics, Bournemouth University,
Bournemouth, UK
Abstract
Purpose– This paper aims to report the results of an investigation of the relative importance of
working capital management, measured by the cash conversion cycle (CCC), and its components (inventory, accounts receivable and accounts payable) to the profitability of SMEs.
Design/methodology/approach– The paper employs panel data regression analysis and a
questionnaire survey on a sample of 133 Alternative Investment Market (AIM) listed SMEs. The panel data analysis utilises financial data for the period 2005 to 2009. The questionnaire survey results are based on 19 SMEs that responded.
Findings– Panel data analysis results show that the management of accounts payable (AP) and
accounts receivable (AR) is important for SMEs profitability. However, AP management is relatively more important than AR management. Inventory (INV) and CCC management is not important for SMEs profitability. Questionnaire results suggest that management of CCC and all its components is perceived as important for SMEs profitability. In terms of relative importance, AR management is most important, followed by AP, INV and CCC respectively.
Research limitations/implications– The sample is limited to AIM listed SMEs, and therefore the
findings cannot be generalised to all companies.
Practical implications– Overall the results imply that the SMEs need to concentrate their limited
resources on managing AR and AP in order to be more profitable.
Originality/value– The study is the first to investigate the relative importance of WCM and its
components to SMEs profitability and use both regression analysis and questionnaire survey.
KeywordsRelative importance, Working capital management, Profitability,
Small to medium-sized enterprises, Working capital, Profit
Paper typeResearch paper
1. Introduction
The focal point of extant research is the importance of working capital management (WCM), measured by cash conversion cycle (CCC), and all its components (inventory, accounts receivables and accounts payables) on the profitability of predominantly large firms (Deloof, 2003; Padachi, 2006; Garcia-Teruel and Martinez-Solano, 2007; Banos-Caballero et al., 2010). Such research has been carried out on the implicit assumption that large firms have the necessary resources (e.g. financial, technology and personnel) to manage all components of working capital. Literature on SMEs, however, suggests that such firms have limited resources compared to their large firm counterparts that may prevent them from managing all components of working capital. For example, research has found that SMEs are poorly managed due to the lack
The current issue and full text archive of this journal is available at
www.emeraldinsight.com/1462-6004.htm
Working capital
management
453
Journal of Small Business and Enterprise Development Vol. 20 No. 3, 2013 pp. 453-469
qEmerald Group Publishing Limited 1462-6004 DOI 10.1108/JSBED-12-2011-0029
of management competence of their owner-managers (Gockel and Akoena, 2002; Pansiri and Temtime, 2008). The Small Business Research Centre (1992) also found management skills to be one of the barriers to SMEs’ growth. The lack of equipment and technology has also been identified as another resource problem faced by SMEs (Abor and Quartey, 2010; Saleh and Ndubisi, 2006; Berisha-Namani, 2009). According to Swierczek and Ha (2003), lack of equipment and outdated technology are among the hindrances to SME development.
The availability of equipment and technology is especially important for the management of working capital and all its components. For example, relevant technology is required to produce reports on the expiry dates of inventory, for analysis of accounts receivable, and sending out of invoices and reminders to customers that do not pay on time. Similarly, relevant equipment and technology is required to keep track of when accounts payable are due, otherwise the firm will miss out on discounts for early settlement, and in some cases incur charges for late payment. Berisha-Namani (2009) emphasised the importance of technology by suggesting that it is difficult for a firm to survive without the help of technology. He argued that the ability of an SME to survive in an increasingly competitive and global environment is largely influenced by their usage of technologies.
In the light of these resource constraints, the central thesis of this paper is that in the context of SMEs, whilst it is important to investigate the importance of WCM and its components to their profitability, it is also equally important to address the question of relative importance(emphasis added). This is based on the reasoning that since many SMEs have limited resources, such as equipment and technology, it is more important for their management to gain an understanding of the relative importance of WCM and its components so that they can prioritise their limited resources for managing those components of working capital that are relatively more important for their profitability.
The objective of this paper is to investigate the relative importance of overall WCM, operationalised by the cash conversion cycle (CCC) and its components (inventory, accounts receivable and accounts payable) to the profitability of AIM listed SMEs using the panel data regression and questionnaire survey methodologies on 133 systematically randomly selected SMEs that met the UK Companies Act 2006 definition of an SME. The panel data regression analysis is based on financial data over a five-year period (665 firm years). The relative importance of WCM and its components is determined by reference tot-values. With the questionnaire survey, a rating on a five-point Likert scale (1¼not important and 5¼very important) was used to establish the importance of WCM and its components and the mean rating was used to determine the relative importance.
Our study contributes to the existing literature in a number of ways. First, the study makes a contribution by reporting the results of the relative importance of WCM and its components to the profitability of AIM listed SMEs companies. Existing literature based on both large firms and SMEs has only documented the importance of WCM and its components to profitability (Deloof, 2003; Garcia-Teruel and Martinez-Solano, 2007; Raheman and Nasr, 2007; Ramachandran and Janakiraman, 2009; Nobanee and Alhajjar, 2009; Rahemanet al., 2010). As already suggested, the relative importance of WCM and its components to profitability is potentially useful for the management of SMEs who have limited resources, including management competency (Small Business
JSBED
20,3
Research Centre, 1992; Gockel and Akoena, 2002; Pansiri and Temtime, 2008) and equipment and technology (Abor and Quartey, 2010; Saleh and Ndubisi, 2006; Berisha-Namani, 2009) and need to prioritise deployment of resources to maximise profitability.
Second, the study is the first to investigate the relative importance of WCM and its components to UK AIM listed SMEs profitability using both secondary financial data and a questionnaire. The simultaneous use of both secondary data and the questionnaire is novel in that the results will show whether the respondents’ views on the importance of WCM components are mirrored in the financial data. Finally, unlike previous studies which have investigated unlisted SMEs, this research examines listed SMEs. To the best of our knowledge there is no existing research that has examined the relationship between WCM components and the profitability of listed SMEs. An investigation of the relationship between WCM and profitability of AIM listed SMEs is particularly interesting given that such firms have a higher investment risk than is associated with established companies (London Stock Exchange, 2010). Consequently, traditional forms of lines of finance are limited as compared to other firms listed on the main London Stock Exchange and the importance of WCM and its components is critical for the survival of SMEs. Moreover, because of their visibility, the AIM listed SMEs are probably under more pressure to report a profit than unlisted ones.
The rest of the paper is organised as follows; section 2 is the literature review and hypotheses development, and section 3 describes the data and variables used for this study. The empirical results of the panel data regression analysis and a questionnaire survey are provided in section 4. Section 5 presents the summary and concluding remarks.
2. Literature review and hypotheses development
The nature of the relationship between WCM and profitability depends on the strategy that the firm decides to pursue (Weinraub and Visscher, 1998; Garcia-Teruel and Martinez-Solano, 2007; Nazir and Afza, 2009). If the firm adopts an aggressive WCM strategy it will result in a reduction in the investment in working capital by minimising the amount of inventory and accounts receivable. By minimising inventory holding costs, including warehouse storage costs, insurance costs will be reduced which will in turn increase the firm’s profitability. Keeping accounts receivable to a minimum will also increase profitability because the funds not tied up in accounts receivable can be left in the bank earning interest or invested elsewhere. However, a reduction in both inventories and receivables may jeopardise the amount of sales, thereby reducing profitability. At the same time an attempt to demand more credit from suppliers may reduce profitability as the firm may lose out on the discounts (Svensson, 1997). Nevertheless, delaying payments to creditors can be an inexpensive and flexible source of financing for a firm (Deloof, 2003).
A firm can also adopt a conservative strategy to WCM which advocates an increase in investment in working capital. This strategy is adopted with the view of stimulating sales by increasing both inventories and receivables in order to increase profitability. An increase in inventories can prevent production disruptions (Garcia-Teruel and Martinez-Solano, 2007), reduce the risk of stock-out (Deloof, 2003), and reduce supply costs and price fluctuations (Blinder and Maccini, 1991). Also an increase in accounts
Working capital
management
receivable can increase sales because it allows customers time to pay (Longet al., 1993; Deloof and Jegers, 1996), reduces the information asymmetry between buyer and seller, and can be an inexpensive source of credit for customers (Peterson and Rajan, 1997; Deloof, 2003). Trade credit can help customers to differentiate between products (Shipley and Davis, 1991; Deloof and Jegers, 1996), can be used as an effective price cut (Brennan et al., 1988; Peterson and Rajan, 1997), and strengthens long-term supplier/customer relationships (Wilner, 2000). However, increasing investment in working capital may result in opportunity cost of cash tied-up in inventory, accounts receivable and increased inventory storage and insurance costs which could reduce the profitability of the firm (Deloof, 2003).
In summary, with the aggressive WCM strategy a negative relationship is expected between overall WCM (measured by CCC), inventory (INV), accounts receivable (AR) and profitability, while a positive relationship between accounts payable (AP) and profitability is expected. With the conservative strategy, a positive relationship should exist between CCC, INV, AR and profitability and a negative relationship between AP and profitability. Empirical evidence of the relationship between CCC and its components (INV, AR and AP) and profitability is, however, mixed. For example, the relationship between WCM measured by the CCC and profitability was found to be negative and significant by Rahemanet al.(2010), Hayajneh and Yassine (2011) and Karadumanet al.(2011), consistent with the aggressive strategy of WCM. However, a positive and significant relationship was reported by Raheman and Nasr (2007), Mathuva (2010), Nobanee and Alhajjar (2009) and Stephen and Elvis (2011), which supports the conservative strategy of WCM.
Similarly, the results in respect of the relationship between components of WCM and profitability are also contradictory. For example, in respect of INV and AR, Raheman and Nasr (2007) and Nobanee (2009) found a positive relationship between profitability and the two components of WCM which is consistent with the conservative strategy of WCM. However, Deloof (2003) and Alipour (2011) both found a significant negative relationship between both INV and AR and profitability in line with the aggressive strategy of WCM. Finally, the existing research is also conflicting in respect of the relationship between AP and profitability. For example, significant positive relationships between AP and profitability consistent with the aggressive strategy are reported by Raheman and Nasr (2007), Tryfonidis and Lazaridis (2006), Alipour (2011) and Mathuva (2010). In contrast, Ramachandran and Janakiraman (2009), Nobanee and Alhajjar (2009), Deloof (2003) and Karaduman et al. (2010) all found a negative relationship consistent with the conservative strategy of WCM. As a result of this review it can be concluded that it is unclear whether aggressive or conservative strategies are positively or negatively associated with profitability.
In the light of the literature review on the importance of WCM and its components on profitability the hypotheses stated below will be tested by this research. No direction is predicted given that existing studies are conflicting on whether the relationship should be positive or negative. The t-values from the results of the hypotheses testing will be used to determine the relative importance of WCM and its components to the profitability of SMEs.
H1. There is a significant relationship between inventory holding period and profitability.
JSBED
20,3
H2. There is a significant relationship between accounts receivable period and profitability.
H3. There is a significant relationship between accounts payable period and profitability.
H4. There is a significant relationship between cash conversion cycle and profitability.
2.1 Control variables
According to Bartovet al.(2000) failure to control for confounding variables could lead to falsely rejecting a hypothesis when in fact it should be accepted. We draw from prior WCM research and control for a number of other variables that are likely to affect firm profitability. Specifically, we control for the ratio of inventory to current assets (INV/CA), the ratio of current assets to total assets (CA/TA), ratio of fixed assets to total assets (FA/TA), the ratio of current assets to total assets (CA_TURN), leverage (LEV) and size measured by log of total assets (TALOG). The control variables were identified on the basis of prior research (Padachi, 2006; Christopher and Kamalavalli, 2009; Banos-Caballeroet al., 2010; Padachiet al., 2010; Raheman et al., 2010; Stephen and Elvis, 2011).
3. Data and variables 3.1 Data
The target population of our study was all the companies listed on the Alternative Investment Market (AIM) which met the definition of an SME, as defined by the UK Companies Act 2006 (Sections 382 and 465). In addition to meeting the SME definition, a company was included in the sample if it had data available for all the five years. Out of the 1,316 companies listed on the AIM on 31 January 2010, 273 met the criterion of an SME as defined by the Companies Act 2006. A decision was then made to target 50 per cent of these SMEs because of the time and cost constrains in collecting five year financial data and questionnaire survey of all SMEs that were eligible. To select the sample for investigation the SMEs were arranged in an alphabetical order and a systematic random sampling procedure employed whereby one in every two companies was selected. This gave us a sample size of 137 companies but a further four financial SMEs were eliminated which meant that our final sample for both the panel data analysis and questionnaire survey was 133. The exclusion of financial institutions is consistent with Deloof (2003). For panel data regression analysis, financial data for a five-year period (2005 to 2009) inclusive was collected, resulting in 665 firm years. In addition to the panel data regression analysis, a questionnaire was sent out by post to the 133 SMEs addressed to the finance director in January 2011. The survey was preceded by a pilot study questionnaire sent to 25 SMEs excluding our target sample of 133 SMEs. The pilot study helped us to assess the validity and understandability of our questionnaire. Based on the suggestions and comments received from the pilot study, the questionnaire was amended. The response rate to the main questionnaire was 14.3 per cent after three follow-up letters. Although the response rate was low, it is comparable to similar studies involving questionnaire survey of SMEs (Sainidiset al., 2001; De Saulles, 2008; Bates, 1995) that reported response rates of 10.6 per cent, 14.4 per cent and 19 per cent respectively.
Working capital
management
3.2 Regression model specification
We specify the following regression analysis model to examine the relationship between WCM and its components and profitability:
ROAit¼b0þb1INVitþb2INV=CAitþb3CA=TAitþb4FA=TAit
þb5CA_TURNitþb6LEVitþb7TALOGitþ1it;
ð1Þ
ROAit¼b0þb1ARitþb2INV=CAitþb3CA=TAitþb4FA=TAit
þb5CA_TURNitþb6LEVitþb7TALOGitþ1it;
ð2Þ
ROAit¼b0þb1APitþb2INV=CAitþb3CA=TAitþb4FA=TAit
þb5CA_TURNitþb6LEVitþb7TALOGitþ1it;
ð3Þ
ROAit¼b0þb1CCCitþb2INV=CAitþb3CA=TAitþb4FA=TAit
þb5CA_TURNitþb6LEVitþb7TALOGitþ1it:
ð4Þ We define all the variables in Table I.
Variable Definition
Profitability measure
ROA Return on assets, measured as profit before interest and tax for the year scaled to the total assets at the end of the financial year
Working capital management variables
INV Inventory holding period calculated by dividing inventory by cost of sales multiplied by 365 days. This represents the average number of days a company is holding the inventory
AR The average number of days the firm takes to collect receivables from customers. This is calculated by dividing accounts receivables by sales multiplied by 365 days
AP The average number of days it takes a firm to pay trade creditors. This is computed by dividing accounts payables by cost of sales multiplied by 365 days
CCC The CCC is calculated as (INVþAR2AP), which represents the average timing difference between when a firm pays for its suppliers and the time it takes to recoup amount invested in debtors and inventory
Control variables
QR Quick ratio is calculated by dividing (current assets2inventory) by current liabilities INV/CA Inventory to current assets calculated by dividing inventory by current assets CA/TA Current asset to total asset is calculated by dividing current assets by total assets FA/TA Fixed assets to total assets is calculated by dividing fixed assets by total assets CA_TURN Current assets turnover is calculated by dividing total assets by turnover LEV Leverage is calculated by dividing total debt by total assets
TALOG Logarithm of total assets is calculated by taking the logarithm of the total assets figure
it The subscriptidenotes thenth company (i¼1;. . .;133), and the subscripttdenotes thetth year (t¼1,. . ., 5)
1it The error term
Table I.
Definition of variables included in the regression models
JSBED
20,3
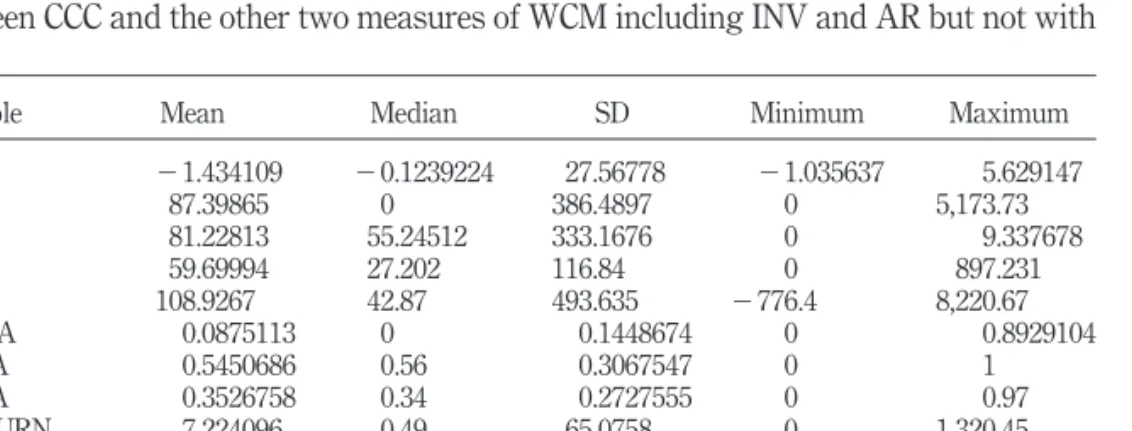
3.3 Descriptive statistics
Table II presents the descriptive statistics of the dependent and independent variables. ROA is on average21.43 per cent, while the median is20.12 per cent. This suggests that at least 50 per cent of the firms in the sample are reporting losses. This is to be expected, as most AIM listed firms are start-ups. It takes on average 87.40 days for firms to turn over their inventory, while the median in days is nil, which suggests that most of the SMEs have no inventory. Table I also reveals that it takes an average of 81.23 days for the SMEs to receive payments (AR). The SMEs take on average 59.7 days to pay their trade creditors, with a median of 27.2 days. The difference in the accounts receivable and payable days means that the SMEs are likely to suffer from cash flow problems, since they pay their creditors in less time than it takes their debtors to pay them. The average CCC of 108.92 days indicates that the SMEs take more than three months from the outlay of cash to buy inventory until they receive payment from their debtors.
The descriptive statistics of the control variables indicate that on average the inventory constitutes 8.75 per cent of the current assets (INV/CA). The average current assets to total assets ratio is 0.55:1. The average fixed assets to total assets ratio is 0.35:1 with a median of 0.35:1, while the current asset turnover (CA_TURN) is 7.22 times. The average leverage (LEV) is 2.23 times, with a median of 0, whilst on average total assets of the sampled SMEs are worth £3,817,222. The median value of the total assets of £3,471,000 suggests that the sampled firms are mostly small.
4. Empirical analysis 4.1 Correlation analysis
The results of the Pearson correlation coefficients are presented in Table III for all variables included, to assess the association between the CCC and its components (INV, AR and AP) and profitability. The correlation results in Table III indicate a significant and negative correlation between profitability and both AR and AP. Based on the correlation coefficient it is evident that AR has a more significant relationship to profitability measured by ROA.
Among the independent variables, there are high and significant correlations between CCC and the other two measures of WCM including INV and AR but not with
Variable Mean Median SD Minimum Maximum ROA 21.434109 20.1239224 27.56778 21.035637 5.629147 INV 87.39865 0 386.4897 0 5,173.73 AR 81.22813 55.24512 333.1676 0 9.337678 AP 59.69994 27.202 116.84 0 897.231 CCC 108.9267 42.87 493.635 2776.4 8,220.67 INV/CA 0.0875113 0 0.1448674 0 0.8929104 CA/TA 0.5450686 0.56 0.3067547 0 1 FA/TA 0.3526758 0.34 0.2727555 0 0.97 CA_TURN 7.224096 0.49 65.0758 0 1,320.45 LEV 2.231049 0 41.1964 0 1,035.04 TA 3,817,222 3,471.00 3,003.359 0 11,358.00
Note:aVariables as defined in Table I
Table II.
Descriptive statisticsa
Working capital
management
RO A IN V AR AP CC C INV/CA CA/TA FA/TA CA_TUR N G R TAL OG ROA 1.0 000 INV 0.0 077 1.0000 AR 2 0.0 848 ** 2 0.0030 1.0000 AP 2 0.2 728 *** 0.2569 ** * 0.0819 ** 1.0 000 CCC 0.0 134 0.7201 ** * 0.6532 *** 0.0 197 1. 0000 INV/C A 0.0 256 0.0558 2 0.0370 2 0.0 521 0. 0311 1.0000 CA/TA 2 0.0 634 0.0860 ** 0.0708 * 0.0 347 0. 1069 ** 0.0842 ** 1.0 000 FA/TA 0.0 518 2 0.0608 2 0.0196 0.0 249 2 0. 0668 * 0.1321 *** 2 0.4 575 *** 1. 0000 CA_TU RN 0.0 031 0.0809 ** 0.0069 0.1 280 *** 0. 0377 2 0.0497 0.0 917 ** 2 0. 0615 1.0000 LEV 2 0.2 185 *** 2 0.0079 0.0113 0.1 001 *** 2 0. 0223 2 0.0299 0.0 756 * 2 0. 0647 * 2 0.0054 1.0000 TA 0.1 201 *** 0.0396 0.0457 2 0.0 002 0. 0619 0.1567 *** 0.4 594 *** 0. 4684 ** * 0.0456 0.0768 ** 1.0000 Notes : aVariables as defined in Ta ble I; *Correlation is signi ficant at th e 0.1 0 level; ** correlation is signi ficant at th e 0.0 5 level (tw o-tailed); *** correlation is signi ficant at th e 0.01 level (two-tailed) Table III. Correlationsa
JSBED
20,3
460
AP. Since the four variables (CCC, INV, AR and AP) all measure WCM, each measure will be entered into a separate model. The correlations among the remainder of the independent variables suggest that multicollinearity should not be a problem in multiple regression analysis since the coefficient values are low. Field (2005) suggested that multicollinearity becomes a problem only when the correlation coefficient exceeds 0.80 or 0.90. The results in Table III show that none of the correlations between independent variables exceeds these threshold values. However, according to Myers (1990), a certain degree of multicollinearity can still exist even when none of the correlation coefficients are very large. Therefore, we also examine the variance inflation factors (VIFs) in our models to further test for multicollinearity. The highest VIFs were well below the threshold value of 10 suggested by Field (2005) indicating that multicollinearity does not pose a problem to the regressions.
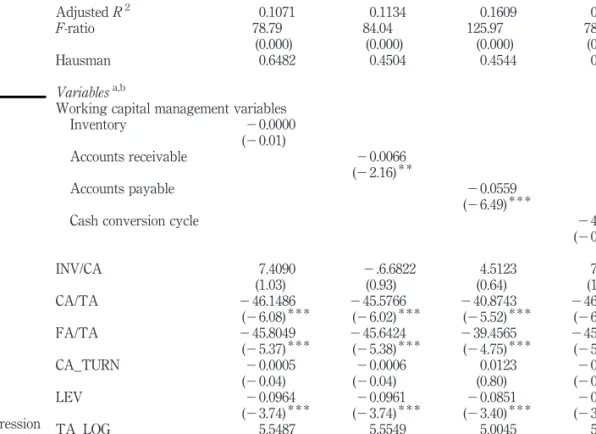
4.2 Regression analysis results and discussion
In this paper, the balanced panel data was preferable compared to the unbalanced panel data. This is because balanced panel data allows for the equal observation for every unit of observation for each time period. On using panel data, one must decide whether to employ a fixed effects model or a random effects model. The random effects model assumes a single common intercept term, and that the intercepts for individual companies vary from this common intercept in a random manner, whilst the fixed effects model assumes different intercept for individual companies. In order to choose the appropriate model, both the fixed effects and random effects estimators were used to estimate the coefficients in models 1 to 4 stated in section 3.2. The Hausman test was then performed which accepted the null hypothesis that the unobserved heterogeneity is uncorrelated with the regressors. This finding means that the random effects is not significantly different from the fixed effects, and therefore the random effects are the most consistent and efficient one to use. The results reported below are therefore based on random effects panel data regression analysis following similar studies (Karadumanet al., 2010, 2011). Regression t-values results are used to rank WCM and its components to establish their relative importance to the profitability of SMEs. The panel data regression results which are presented in Table IV show that INV is negatively associated with ROA but the relationship is not significant (model 1). The model explains 10.71 per cent of the variation in profitability. The results also show that among the control variables, CA/TA, FA/TA, LEV and TA_LOG are significantly associated with profitability at the 1 per cent level. The results of model 2 show that AR is negatively associated with profitability and significant at the 5 per cent level, suggesting that it is important for the profitability of the SMEs. Similarly, CA/TA, FA/TA, LEV and TA_LOG are also significant in explaining the variability in profitability. The model explains 11.34 per cent of the variability in profitability. The results of model 3 also reveal that AP is negatively associated with profitability at the 1 per cent level of significance, which suggest that AP is important for the profitability of SMEs. The model explains 16.09 per cent of the variability in profitability. The control variables of CA/TA, FA/TA, LEV and TA_LOG are also significantly related to profitability at the 1 per cent level. Finally, the results of the effect of CCC (model 4) show that this variable is insignificant and therefore not important for the profitability of the SMEs. However, the four control variables (CA/TA, FA/TA, LEV and TA_LOG) are all significantly associated with profitability.
Working capital
management
Overall the finding that AR is negatively associated with profitability and significant at the 5 per cent level is consistent with the aggressive strategy of WCM whilst a significant negative association between AP and profitability is consistent with the conservative strategy of WCM. The results are consistent with similar previous studies on the importance of management of AR and AP (Deloof, 2003; Padachi, 2006; Garcia-Teruel and Martinez-Solano, 2007). The results in respect of INV and CCC, which suggest an insignificant association with profitability, are contrary to most of the previous findings (Deloof, 2003; Nobanee, 2009; Dong and Su, 2010; Stephen and Elvis, 2011). The finding that CA/TA and FA/TA are negatively and significantly associated with profitability is an indication that SMEs with a higher proportion of current assets to total assets and fixed assets to total assets are less profitable. High leveraged SMEs may be less profitable due to high interest charges they pay on their borrowings as indicated by the significant negative relationship between LEV and profitability. Finally, the results which indicate a positive and significant association between TA_LOG and profitability suggest that larger SMEs tend to be more profitable.
In terms of relative importance, the results in Table IV suggest that the management of AP is the most important to the profitability of SMEs, followed by AR
ROA ROA ROA ROA
AdjustedR2 0.1071 0.1134 0.1609 0.1071
F-ratio 78.79 84.04 125.97 78.79
(0.000) (0.000) (0.000) (0.000)
Hausman 0.6482 0.4504 0.4544 0.6452
Variablesa,b
Working capital management variables Inventory 20.0000 (20.01) Accounts receivable 20.0066 (22.16)* * Accounts payable 20.0559 (26.49)* * *
Cash conversion cycle 24.5700
(20.00) INV/CA 7.4090 2.6.6822 4.5123 7.4040 (1.03) (0.93) (0.64) (1.03) CA/TA 246.1486 245.5766 240.8743 246.1479 (26.08)* * * (26.02)* * * (25.52)* * * (26.08)* * * FA/TA 245.8049 245.6424 239.4565 245.8007 (25.37)* * * (25.38)* * * (24.75)* * * (25.37)* * * CA_TURN 20.0005 20.0006 0.0123 20.0005 (20.04) (20.04) (0.80) (20.04) LEV 20.0964 20.0961 20.0851 20.0964 (23.74)* * * (23.74)* * * (23.40)* * * (23.74)* * * TA_LOG 5.5487 5.5549 5.0045 5.5484 (6.43)* * * (6.47)* * * (5.96)* * * (6.43)* * *
Notes:aAll variables are defined in Table I;bt-statistics are shown in parentheses;*significant at the
0.10 level;* *significant at the 0.05 level; * * *significant at 0.01 level Table IV.
Random effect regression results of the impact of working capital management on profitability
JSBED
20,3
462
based on the regressiont-values. The negativet-values suggest that SMEs that pay the accounts payable and collect their accounts receivable more quickly are more profitable. The relative importance of accounts payable compared to accounts receivable management to the profitability of SMEs means that accounts payable management practices make a more significant difference to the profitability presumably due to the minimising of late payment costs such as late payment penalties, interest charges, and lost prompt-payment discounts. These results mean that SMEs facing resources constraints should prioritise their resources to manage AP and AR in order to maximise their profitability.
4.3 Questionnaire analysis results and discussion
Responses to Section A of the questionnaire (see the Appendix) indicate that 15 of the respondents who completed the questionnaire were finance directors, as well as two accountants, a company secretary and a managing director. As for their experience, the responses showed that 13 of the respondents had been in their current role for up to five years, four between six and ten years, and two respondents had been in their role for over ten years. The results of the questionnaire (see Question 3 of the questionnaire) also suggested that four companies belonged to either manufacturing or construction, whilst seven belonged to the service sector, one from either the agriculture or mining sector, and the remaining seven from other sectors.
In Part B of the questionnaire respondents were asked to indicate the extent of their agreement or disagreement on a five-point Likert scale (1¼strongly disagree and 5¼strongly agree), with each of the statements relating to the importance of INV, AR, AP and CCC in increasing profitability. The descriptive statistics of the responses in Table V (columns 2-6) indicate that working capital management is considered important as indicated by the mean rating of INV (3.63), AR (4.32), AP (3.81), CCC (3.59). In relative importance terms, these survey results suggest that the management of AR (mean rating of 4.32) is considered the most important for the profitability of SMEs. This is followed by AP (3.81), INV (3.63) and finally CCC (3.59). The ranking of accounts receivable as relatively more important than all other components of working capital may be a reflection of the anxiety by SMEs management that if customers are not paying timely, or not paying at all, the SMEs may run out of cash flow they need to pay expenses including employee wages and accounts payable.
Questionnaire results descriptive statistics
Ranking of relative importance of WCM components
Variablea
Number of
observationsb Mean Median Minimum Maximum
Current studyc (questionnaire) Current studyd (panel data analysis) INV 16 3.63 4 1 5 3 4 AR 19 4.32 5 3 5 1 2 AP 19 3.81 3 2 5 2 1 CCC 19 3.59 4 2 5 4 3
Notes:aVariables as defined in Table II;bthree SMEs did not have inventories, and hence the number
of observations is 16;cranking based on the mean;dranking based on thet-values
Table V. Importance of WCM components
Working capital
management
463
A comparison of our survey results of the relative importance of INV, AR, AP and CCC with our panel data regression results are also presented in Table V (columns 7 and 8). The comparison suggests that there is no consensus as to which WCM component is most important. For example, the analysis in Table V indicates that based on our panel data regression analysis AP is relatively the most important followed by AR whilst with our questionnaire survey AR is most important followed by AP. A similar pattern is discernible in respect of the relative importance of INV and CCC whereby with the questionnaire results INV is relatively more important than CCC whilst with the panel data results the opposite is true.
The conflicting findings on the relative importance of AR and AP using panel data regression and questionnaire survey reported in this study could be due to many reasons. One reason could be the perception by SMEs management that managing AR is relatively more important than AP because it makes available funds that are needed to pay expenses necessary to keep the business operational. The other reason could be that SMEs management is unaware of the contribution that the management of AP makes to the overall profitability of the business. It is also possible that the management of AP is perceived as less important than AR because the former is an expense whilst the latter is income. Despite the conflicting findings, the results of the comparison of the relative importance of WCM and its components in Table V suggest that AR and AP are the two most important components of working capital that should be managed to increase profitability as evidenced by these two being ranked either first or second.
Respondents were also asked to give their own opinion and suggestions on the effect of INV, AR, AP and CC on profitability in Questions 8-11 of the questionnaire (the Appendix). In response to Question 8 on whether management of INV affects profitability one respondent, for example, said that:
This is a two-sided issue as there is a desire not to have money tied up in inventory, whilst at the same time ensuring there is sufficient stock to be able to serve orders with minimum of delay, so with this in mind I would definitely say inventory management affects profitability. Similarly, in response to Question 9 on whether the management of accounts receivable affect profitability one finance director had the following to say:
Higher receivables mean you are financing your customers, and cash is tied up and cannot be used elsewhere. If you have an overdraft, you may be paying interest needlessly. You may also require extended credit from your suppliers and may be charged a premium or late payment fees and interest. As a result the extent to which you finance your customers will influence profitability.
On whether the accounts payable affect profitability one responded commented that: Late payments result in damage to a trade relationship or non-shipment of a product which is ultimately damaging. Strong trade relationships based on trust results in stronger sales (product availability) during periods of shortage which result in a more profitable business. Finally, another responded also had the following to say when asked to explain the effect of the cash conversion cycle on the profitability of the company:
The shorter the cash conversion cycle, the more effective the business is managing AR, AP, inventory etc. Consequently, the business as a whole will be more profitable.
JSBED
20,3
Thus, overall these comments tend to be in line with most of the finance literature on the importance of the management of INV, AR, AP and CCC. In particular, the quote relating to AR shows that SMEs management is keen to collect the AR early in order to release funds for use elsewhere. Similarly, the quote relating to AP suggests that SMEs are also keen to pay early their AP in order to maintain good trade relationships. 5. Summary and conclusion
The objective of the study was to investigate the relative importance of WCM, measured by cash conversion cycle (CCC) and its components (INV, AR, AP) to the profitability of AIM listed SMEs. The study was based on a panel data regression analysis of the financial data of 133 SMEs over a five year period (2005-2009) and responses from 19 out of the same 133 AIM listed SMEs which responded to the questionnaire survey. The results from the panel data regression analysis suggest that AP and AR are important for the profitability of SMEs. INV and CCC were found not to be important. The finding that both AP and AR are important for the profitability of the SMEs is consistent with the findings by Garcia-Teruel and Martinez-Solano (2007), Joseet al.(1996), Shin and Soenen (1998), Padachi (2006) and Deloof (2003). In relative terms, AP is more important than AR. On the other hand, the questionnaire survey results indicate that although the management of working capital (CCC) and all its components (INV, AR and AP) is important, the management of AR is relatively more important than AP for the profitability of SMEs.
In interpreting the results, however, some limitations need to be noted. First, our study is limited to 133 AIM listed SMEs, and therefore the findings cannot be generalised to all firms. Second, our questionnaire survey response rate is low at 14.3 per cent although it is comparable to other response rates for SMEs (Sainidiset al., 2001, De Saulles, 2008; Bates, 1995). In spite of the limitations, taken overall, these results have implications for both the SMEs and future research on the relative importance of WCM and its components on profitability. First, the results are the first to document the relative importance of WCM and its components to SMEs profitability. The relative importance of WCM and its components to profitability is potentially useful for the management of SMEs who have limited resources (Small Business Research Centre, 1992; Pansiri and Temtime, 2008; Abor and Quartey, 2010; Berisha-Namani, 2009) and may wish to prioritise the management of those WCM components that are more important to the SMEs profitability. Second, the conflicting findings in respect of the relative importance of AR and AP suggest that there is a need for further research to establish which of the two components is relatively more important for SMEs profitability. Although the results are inconclusive as to whether AR or AP is relatively more important, the findings that both are relatively more important than either INV or CCC leads us to the conclusion that given the SMEs limited resources, they need to prioritise their WCM by focusing on AR and AP to improve profitability.
References
Abor, J. and Quartey, P. (2010), “Issues in SME development in Ghana and South Africa”,
International Research Journal of Finance and Economics, Vol. 39, pp. 218-228.
Alipour, M. (2011), “Working capital management and corporate profitability: evidence from
Iran”,World Applied Sciences Journal, Vol. 12 No. 7, pp. 1093-1099.
Working capital
management
Banos-Caballero, S.B., Garcia-Teruel, P.J. and Martinez-Solano, P.M. (2010), “Working capital
management in SMEs”,Accounting & Finance, Vol. 50 No. 3, pp. 511-527.
Bates, T. (1995), “Analysis of survival rates among franchise and independent small business
startups”,Journal of Small Business Management, Vol. 33 No. 2, pp. 26-36.
Bartov, E., Gul, F.A. and Tsui, J.S.L. (2000), “Discretionary-accruals models and audit
qualifications”,Journal of Accounting and Economics, Vol. 30 No. 3, pp. 421-452.
Berisha-Namani, M. (2009), “The role of information technology in small and medium sized enterprises in Kosova”, paper presented at the Fulbright Academy 2009 Conference: Small Places Can Change the World, available at:
www.fulbrightacademy.org/file_depot/0-10000000/20000-30000/21647/folder/82430/BerishaþPaperþITþinþSMEsþinþKosovo.
pdf (accessed 11 April 2011).
Blinder, A.S. and Maccini, L.J. (1991), “The resurgence of inventory research – what have we
learned?”,Journal of Economic Survey, Vol. 5, pp. 291-328.
Brennan, M., Maksimovic, V. and Zechner, J. (1988), “Vendor financing”, Journal of Finance,
Vol. 43, pp. 1127-1141.
Christopher, B. and Kamalavalli, A.L. (2009), “Sensitivity of profitability to working capital management in Indian corporate hospitals”, working paper, NGM College, Pollachi. Deloof, M. (2003), “Does working capital management affect profitability of Belgian firms?”,
Journal of Business, Finance and Accounting, Vol. 30 Nos 3/4, pp. 573-587.
Deloof, M. and Jegers, M. (1996), “Trade credit, product quality, and intra-group trade. Some
European evidence”,Financial Management, Vol. 25, pp. 33-43.
De Saulles, M. (2008), “SMEs and the web”, available at: www.mdesaulles.net/storage/ SMEWebSurveyJul08%20M%20De%20Saulles.pdf (accessed 29 May 2011).
Dong, H.P. and Su, J. (2010), “The relationship between working capital management and
profitability: a Vietnam case”,International Research Journal of Finance and Economics,
Issue, Vol. 49, pp. 59-67.
Field, A. (2005),Discovering Statistics Using SPSS for Windows, Sage Publications, Thousand
Oaks, CA.
Garcia-Teruel, P.J. and Martinez-Solano, P. (2007), “Effects of working capital management on
SME profitability”,International Journal of Managerial Finance, Vol. 3, pp. 164-177.
Gockel, A.G. and Akoena, S.K. (2002), “Financial intermediation for the poor: credit demand by micro, small and medium scale enterprises in Ghana – a further assignment for financial sector policy?”, IFLIP Research Paper 02-6, International Labor Organization, Geneva. Hayajneh, O.S. and Yassine, F.L.A. (2011), “The impact of working capital efficiency on
profitability - an empirical analysis on Jordanian manufacturing firms”, International
Research Journal of Finance and Economics, Vol. 66, pp. 67-76.
Jose, M.L., Lancaster, C. and Stevens, J.L. (1996), “Corporate returns and cash conversion cycle”,
Journal of Economics and Finance, Vol. 20 No. 1, pp. 33-46.
Karaduman, H.A., Akbas, H.E., Ozsozgun, A. and Durer, S. (2010), “Effect of working capital management on profitability: the case for selected companies in the Istanbul Stock
Exchange (2005-2008)”,International Journal of Economics and Financial Studies, Vol. 2
No. 2, pp. 47-54.
Karaduman, H.A., Akbas, H.E., Caliskan, A.O. and Durer, S. (2011), “The relationship between working capital management and profitability: evidence from an emerging market”,
International Research Journal of Finance and Economics, Vol. 62, pp. 61-67.
London Stock Exchange (2010),A Guide to AIM, London Stock Exchange, London.
JSBED
20,3
Long, M.S., Malitz, I.B. and Ravid, S.A. (1993), “Trade credit, quality guarantees, and product
marketability”,Financial Management, Vol. 22 No. 4, pp. 117-127.
Mathuva, D. (2010), “The influence of working capital management components on corporate
profitability: a survey on Kenyan listed firms”,Research Journal of Business Management,
Vol. 4 No. 1, pp. 1-11.
Myers, R.H. (1990), Classical and Modern Regression Application, 2nd ed., Duxbury Press,
Belmont, CA.
Nobanee, H. and Alhajjar, M. (2009), “A note on working capital management and corporate
profitability of Japanese firms”, available at: http://ssrn.com/abstract¼1433243 (accessed
25 January 2011).
Nobanee, H. (2009), “Working capital management and firm’s profitability: an optimal cash
conversion cycle”, available at: http://ssrn.com/abstract¼1471230 (accessed 21 April
2011).
Nazir, M.S. and Afza, T. (2009), “Impact of aggressive working capital management policy on
firms profitability”,The IUP Journal of Applied Finance, Vol. 15 No. 8, pp. 19-30.
Padachi, K. (2006), “Trends in working capital management and its impact on firms’ performance
- an analysis of Mauritian small manufacturing firms”,International Review of Business
Research Papers, Vol. 2 No. 2, pp. 45-58.
Padachi, K., Howorth, C., Narasimhan, M.S. and Durbarry, R. (2010), “Working capital structure and financing pattern of Mauritian SMEs”, available at: www.gcbe.us/../Kesseven% 20Padachi,%20C.%20Howorth,%20M.%20S.%20Narasmhan,%20R.%20Durbarry.doc (accessed 23 September 2010).
Pansiri, J. and Temtime, Z.T. (2008), “Assessing managerial skills in SMEs for capacity
building”,Journal of Management Development, Vol. 27 No. 2, pp. 251-260.
Peterson, M.A. and Rajan, R.G. (1997), “Trade credit – theories and evidence”,Review of Financial
Studies, Vol. 10 No. 3, pp. 661-691.
Raheman, A. and Nasr, M. (2007), “Working capital management and profitability – case of
Pakistani firms”, International Review of Business Research Papers, Vol. 3 No. 1,
pp. 279-300.
Raheman, A., Afza, T., Qayyum, A. and Bodla, M.A. (2010), “Working capital management and
corporate performance of manufacturing sector in Pakistan”, International Research
Journal of Finance and Economics, Vol. 47, pp. 151-163.
Ramachandran, A. and Janakiraman, M. (2009), “The relationship between working capital
management efficiency and EBIT”,Managing Global Transitions, Vol. 7 No. 1, pp. 61-74.
Sainidis, F., Gill, R.E. and White, A. (2001), “Emergent strategies in SMEs”, paper presented at the 4th SME International Conference, Allborg, Denmark, pp. 242-247.
Saleh, A.S. and Ndubisi, N.O. (2006), “An evaluation of SME development in Malas”,
International Review of Business Research Papers, Vol. 2 No. 1, pp. 1-14.
Shin, H.H. and Soenen, L. (1998), “Efficiency of working capital and corporate profitability”,
Financial Practice and Education, Vol. 8 No. 2, pp. 37-45.
Shipley, D. and Davis, L. (1991), “The role and burden-allocation of credit in distribution
channels”,Journal of Marketing Channels, Vol. 1, pp. 3-22.
Small Business Research Centre (1992), “The state of British enterprise: growth, innovation and competitive advantage in small and medium-sized firms”, Small Business Research Centre, University of Cambridge, Cambridge.
Working capital
management
Stephen, M. and Elvis, K. (2011), “Influence of working capital management on firms
profitability: a case study of SMEs in Kenya”,International Business Management, Vol. 5,
pp. 279-286.
Svensson, K. (1997), “Trade credits in Europe today: credit cultures, payment morality and legal systems”, working paper, Lund University, Lund.
Swierczek, F.W. and Ha, T.T. (2003), “Entrepreneurial orientation, uncertainty avoidance and
firm performance: an analysis of Thai and Vietnamese SMEs”,International Journal of
Entrepreneurship and Innovation, Vol. 4 No. 1, pp. 46-58.
Tryfonidis, D. and Lazaridis, I. (2006), “Relationship between working capital management and
profitability of listed companies in the Athens Stock Exchange”, Journal of Financial
Management and Analysis, Vol. 19 No. 1, pp. 26-35.
Weinraub, H.J. and Visscher, S. (1998), “Industry practice relating to aggressive conservative
working capital policies”, Journal of Financial and Strategic Decision, Vol. 11 No. 2,
pp. 11-18.
Wilner, B. (2000), “The exploitation of relationships in financial distress – the case of trade
credit”,The Journal of Finance, Vol. 55 No. 1, pp. 153-178.
Further reading
Hausman, J.A. (1978), “Specification tests in econometrics”,Econometrica, Vol. 46, pp. 1251-1271.
Corresponding author
Venancio Tauringana can be contacted at: [email protected]
JSBED
20,3
Appendix. Working capital management practices Figure A1. Working capital management practices