Commodities Sectors And The Business Cycle
Geetesh Bhardwaj and Adam Dunsby
Commodities In A Portfolio
Sal Gilbertie
Keeping Current With Commodities
Featuring Jim Rogers, Victor Sperandeo, Shonda Warner, Jodie Gunzberg and more
Better Beta In Commodities Indexing
Jonathan Guyer
Plus Mulvey on managed commodities futures, Kaplan on capturing long/short strategies,
Commodities In A Portfolio
What do they bring to the table?
T
he concept of adding commodities exposure as a way of reducing portfolio volatility may seem counterintuitive, but the main drivers of com-modities prices often vary from those of other asset classes, particularly bonds and securities. This makes commodities important as both diversifiers and volatil-ity reducers in a well-designed, risk-adjusted portfolio. Advisors and investors can turn to the commodities sec-tor as a potentially effective means of achieving higher risk-adjusted returns in a portfolio.Beta Vs. Alpha
The principles of “beta”1 and “alpha”2 have been much discussed in the world of modern portfolio theory, partic-ularly by academics and statisticians. Fortunately, these concepts are widely understood and can often be utilized by professional money managers and ordinary inves-tors alike as a method to potentially achieve improved risk-adjusted returns in almost any-sized portfolio. For purposes of this discussion, we will generally use the term “beta” to refer to the volatility of an investment in rela-tion to the broader market, and we will generally refer to “alpha” as outperformance versus a comparable bench-mark representing the broader bench-market.
This article will not only explore the basic concepts of why and how commodities can be beneficial to a port-folio’s risk (beta) profile, but also explore certain easily
implemented beta optimization (alpha) strategies that may be able to improve results over time.
Why Commodities Work In A Portfolio
Why are commodities so popular? The answer is sim-ple: Adding commodities “beta” in a portfolio can, over time, actually reduce overall portfolio volatility and even have a slight positive effect on overall absolute returns.
In the Morningstar study cited in Figure 1,by using a 28 percent exposure to a broad commodities basket in a 40 percent bond, 32 percent stock and 28 percent commod-ities-weighted portfolio, the volatility of the portfolio was reduced by 24 percent, from 11.6 percent to 8.8 percent. In this example, absolute returns actually increased slightly by 2.3 percent, from 8.7 percent to 8.9 percent (per year for the 20-year time period tested). Given this analysis, it is understandable why institutional investors have effective-ly utilized commodities in their risk-adjusted portfolios. Large institutions and managers can achieve this exposure through direct investments in physical commodities and
through the retention of professional futures traders. Fortunately for professional advisors and investors, the recent growth of the commodities-based ETP sector pro-vides simplified access to a wide variety of commodities.
There are several broad-based commodities ETPs offering access to baskets of up to two dozen (or more) different com-modities, and there are single-commodity ETPs (excluding ETNs, which are backed by credit, not real assets) that rep-resent 13 different commodities as of this writing.
Simply put, today’s investors and asset allocators have a wide variety of commodities-based ETPs from which to choose when determining their investment objectives; all can be accessed directly through a normal securities account on major trading exchanges with no need for a futures account or external futures manager.
Investors face some basic choices when adding com-modities-based beta to their portfolio. Primary among considerations should be the type of commodities expo-sure one wishes to achieve. One must ask if a broad-based, multicommodity basket is most suitable, or might exposure to a smaller, core group of commodities about which the investor has some knowledge be best?
Most important for investors to remember when choos-ing a commodities-based ETP is that no two benchmarks
Potential Benefits Of Including Commodities In A Portfolio
Lower Risk And Higher Return, 1991-2010
Figure 1
Source: Morningstar3
About the data: Stocks in this example are represented by the Standard & Poor’s 500. Bonds are represented by the 5-year U.S. government bond. Commodities are represented by the Morningstar Long-Only Commodity Index. An investment cannot be made directly in an index.
Domestic Portfolio Domestic Portfolio
with Commodities 60% 40% 40% 28% 32% ■ Stocks ■ Bonds ■ Commodities Return 8.7%
Risk 11.6% Return 8.9%Risk 8.8%
Why are commodities so popular? The answer is simple:
Adding commodities “beta” in a portfolio can, over time,
actually reduce overall portfolio volatility and even have a slight
are alike; each has its own unique design and results will vary accordingly. Spend some time looking into the design of the ETPs in the commodities sector to find the one that best suits your investment needs.
Some multicommodity funds give investors equal weighting among a wide variety of commodities; others assign weightings to commodities according to their scale of global production or consumption rates. Many of the most popular of these indexes are heavily weighted in favor of a particular sector, such as the S&P GSCI, with its fairly strong concentration in energy. These funds allow immediate, generalized exposure to commodities and offer a convenient way for investors not currently familiar with commodities to gain initial core portfolio exposure.
In the single-commodity ETP sector, more narrowly focused products give investors the ability to custom-design or supplement their commodities exposure. These funds often appeal to investors wishing to overweight or underweight a core commodities holding, especially those investors familiar with specific commodities or sectors such as energy, precious metals or agriculture. Some of these funds are designed to efficiently capture short-term movements in the price of an individual underlying com-modity; others may be designed for longer-term asset allo-cation exposure rather than for short-term trading results. Benchmark Design And The Futures Curve:
Contango And Backwardation
When first developed and introduced in the 1990s, multicommodity indexes/funds became popular (and remain so today). This is due mainly to their ability to
give nonfutures investors direct exposure to commodities through indirect futures holdings via an index or fund.
These funds are sometimes referred to as “first genera-tion” funds due to their concentration of holdings in the very front of the futures curve. This is because their focus is generally more on achieving direct exposure to the commodities and less on how efficiently the benchmark might perform over time versus a given investor’s time horizon and expectations.
These funds can be affected by issues unique to futures pricing called contango4 and backwardation,5 which can have unpredictable effects on investor returns over time. Contango and backwardation are generally more of a concern in the energy, agricultural and industrial metals sectors than they are in precious metals. The latter cate-gory has minimal storage and carrying charge costs asso-ciated with it compared with other commodities, where storage, processing, spoilage and other costs affecting contango and backwardation can be substantial.
As the issues of contango and backwardation have come to the fore of the collective thinking of the investor community in first-generation funds, a number of “next generation” funds and ETP products have been intro-duced. These ETPs have benchmark holdings or trading methodologies specifically designed to mitigate (as much as possible) the potential effects of contango and back-wardation. However, bear in mind the fact that contango and backwardation can never be fully eliminated. Both are a fundamental element of commodities trading and are an important factor when choosing a commodities-based ETP design that is right for one’s needs.
Figure 2
Correlation Of 13 Commodities To The S&P 500, 12/31/91–12/30/11
Sources: Teucrium Trading LLC and Bloomberg Professional, 4/27/2012 Note: Commodities values are from futures (generic first) spot continuation charts.
S&P 500 Index taken from Bloomberg: SPX Index - This is for illustrative purposes only and not indicative of any investment. An investment cannot be made directly in an index. Stocks in this example are represented by the Standard & Poor’s 500.
0.00 0.10 0.20 0.30 0.40 0.50 Correlation Value 0.60 0.70 0.80 0.90 1.0 Commodities 0.08161 0.19350 0.20215 0.20370 0.28931 0.38945 0.43763 0.53612 0.53875 0.54157 0.54768 0.58546 0.68363 Sugar No. 11 (ICE)
Wheat No. 2 Soft Red WInter (CBOT) Soybean No. 2 Yellow (CBOT) Corn No. 2 Yellow (CBOT) Gold (COMEX) Silver (COMEX) Copper (COMEX)
Heating Oil No. 2 - Fuel Oil (NYMEX) Brent Crude Oil (ICE)
Platinum (NYMEX) WTI Crude Oil (NYMEX) Natural Gas Henry Hub (NYMEX) Palladium (NYMEX) S&P 500 Index
Generally speaking, investors and asset allocators who want to add beta to their portfolio using commodities will be buying and holding their selected commodities exposure long term. This means that a next-generation commodities ETP, designed to mitigate contango and backwardation, may be a more appropriate choice than a (possibly more widely recognized) first-generation ETP. Conversely, an investor looking at shorter-term exposure to a commodities sector (or sectors) may be better served by a first-generation ETP. Your investment’s time horizon is particularly important when implementing beta opti-mization (alpha) strategies through ETPs.
Any combination of ETP choices can be effective, but in all cases, the benchmark design and holdings of the ETP are what will drive returns more than any other factor. Choosing Commodities Exposure
For Beta Diversification
How might an investor go about choosing exactly what type of commodities exposure to include in the beta por-tion of a portfolio? A good place to begin might be with some basic statistical analysis. Generally speaking, corre-lation, when used in conjunction with portfolio analysis, determines if the prices of assets included in the analysis move in the same direction, whereas regression6 analysis examines if the movements of one asset can be explained by the movements in another asset.
Many professional investors are well aware that price movements in precious metals are generally not well corre-lated with the performance of stocks and bonds. However, it often comes as a surprise to investors that many commodi-ties in the agricultural sector have price movements that are less correlated with stocks and bonds than do other well-known commodities. Figure 2 illustrates the 20-year price correlation of 13 major commodities to the S&P 500.7
Precious metals and energies can be effective
beta-enhancing components in a diversified portfolio, and the popularity and presence of these two commodities sectors in many portfolios is widely known. But analysis shows that over time, the price movements of energies seem to be more closely correlated with stocks and bonds than are the price movements of agricultures and precious metals. Regression analysis, which relates to correlation by show-ing how much the movement of somethshow-ing (in this case, specific commodities) is directly affected by the move-ments in a comparable benchmark (in this case, the S&P 500) can often explain correlation patterns. In fact, longer-term regression analysis of 13 major commodities consis-tently shows gold, sugar, soybeans and corn as the least directly affected by the performance of the S&P 500 Index.
Specifically, when one performs a regression analysis of the S&P 500 Index over five-, 10- and 20-year periods8 against the 13 commodities available in the single-ETP format, those that are the least tied to the S&P 500 are consistently precious metals and agricultural commodi-ties. (See Figure 3.) In fact, sugar is historically less tied than gold over the last 10 years, and soybeans are less tied than gold over the past five years.
As previously discussed, investors seeking exposure to commodities have easy access to a variety of commodi-ties-based ETP products. They can choose among several multicommodity ETPs or they can customize their expo-sure using single-commodity funds. Again, be certain to study the underlying benchmark of your ETP choices, because benchmark design more than any other factor will be the true source of your expected performance. Optimizing Commodities-Based
Beta Through Seasonality
Seasonal patterns in many commodities—especially within the agricultural sector—are often (but not always) used by investors to optimize the beta component of their
Source: Teucrium Trading LLC Figure 3
R2 Of These Specific Commodities
Against The S&P 500 Index: 5-Yr (12/29/2006–12/30/2011)8
R2 Of These Specific Commodities
Against The S&P 500 Index: 10-Yr (12/31/2001–12/30/2011)8
R2 Of These Specific Commodities
Against The S&P 500 Index: 20-Yr (12/31/1991–12/30/2011)8 Soybeans 0.00787 Gold 0.01923 Silver 0.02420 Sugar 0.03180 Corn 0.06018 Palladium 0.12419 Platinum 0.19198 Wheat 0.20052 Brent Crude Oil 0.21206 Heating Oil 0.22431 WTI Crude Oil 0.23147 Natural Gas Henry Hub 0.24232 Copper 0.44488 Sugar 0.03003 Gold 0.04720 Soybeans 0.05833 Corn 0.10166 Silver 0.12291 Palladium 0.14766 Wheat 0.18795
Natural Gas Henry Hub 0.19481
Platinum 0.27988 Brent Crude Oil 0.31286 Heating Oil 0.32547 WTI Crude Oil 0.33039 Copper 0.42742 Sugar 0.00666 Wheat 0.03744 Soybeans 0.04087 Corn 0.04149 Gold 0.08370 Silver 0.15167 Copper 0.19152 Heating Oil 0.28743 Brent Crude Oil 0.29025 Platinum 0.29330 WTI Crude Oil 0.29995 Natural Gas Henry Hub 0.34276 Palladium 0.46735
portfolio. The basic patterns and cycles of life on planet Earth, primarily those based upon growing seasons and usage patterns, can be employed effectively to optimize the timing of when investors increase or decrease beta exposure to certain commodities. These patterns are lit-erally cosmic in nature; the positioning of planet Earth at times of solstice and equinox is ultimately what affects growing seasons and usage patterns. These cannot be affected by investors, but they can be used effectively by investors seeking beta-enhancing strategies.
Absolute-Price Patterns And Variance From Annual Average Prices
There are two important considerations when trad-ing commodities for beta optimization (alpha), especially those commodities most affected by fundamental seasonal patterns. Most commonly utilized by investors (especially those exclusively seeking alpha) is the concept that a com-modity or market can create relatively predictable seasonal patterns of absolute-low and absolute-high prices. Less commonly utilized, but of immense importance to asset allocators and/or investors seeking long-term beta expo-sure, is the concept of variance from annual average prices.
For an asset allocator who wants to initiate (or increase) beta exposure in a given commodity, the concept of vari-ance from annual average prices is important. Investors seeking to achieve long-term exposure to a given sec-tor (beta) are perhaps less interested in entering at the absolute-price low than they might be in simply maxi-mizing the efficiency of their exposure to that particular commodity or sector. Seasonal variance from the annual average is therefore an important factor when initiating or adding to a long-term beta exposure position.
On the other hand, an alpha investor is probably more interested in picking an absolute-price top or bottom. That investor’s interest will lie therefore in the seasonal patterns supporting absolute-pricing patterns rather than in the divergence from the average that is of critical interest to a beta investor.
Sugar, the agricultural commodity that has both the lowest correlation and the lowest regression value in the above-referenced study, offers a good example of how investors might use both seasonal absolute-pricing patterns and seasonal divergence from aver-age annual pricing patterns to optimize beta and/or achieve alpha in their portfolios.
Figure 4 Figure 5
■ 1996/97-2010/11 ■ 2006/07-2010/11
Sugar #11 Seasonal
Sugar #11 Seasonal—Variance From Year’s Average Sugar Futures Prices
■ 1996/97-2010/11 ■ 2006/07-2010/11 20% 15% 10% 5% 0% -5% -10% -15% -20% -25%
Oct Nov Dec Jan Feb Mar Apr May Jun July Aug Sep
Sources: CQG and Newedge Coffee Group 2100 1900 1700 1500 1300 1100 900
Oct Nov Dec Jan Feb Mar Apr May Jun July Aug Sep
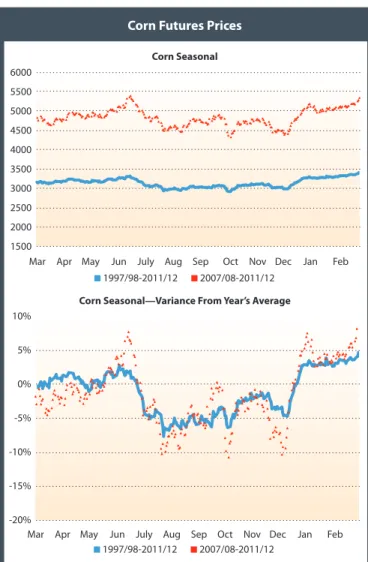
Corn Seasonal
Corn Seasonal—Variance From Year’s Average Corn Futures Prices
Sources: CQG and Newedge Coffee Group
■ 1997/98-2011/12 ■ 2007/08-2011/12 6000 5500 5000 4500 4000 3500 3000 2500 2000 1500
Oct Nov Dec Jan Feb Mar Apr May Jun July Aug Sep
■ 1997/98-2011/12 ■ 2007/08-2011/12 10% 5% 0% -5% -10% -15% -20%
Oct Nov Dec Jan Feb Mar Apr May Jun July Aug Sep
Due to the fundamental factors of weather and harvest cycles, as illustrated in Figure 4,9 the price of sugar as repre-sented by front-month futures—in both absolute terms and in terms of its relative negative divergence from the annual aver-age prices—often reaches its maximum low point between April and June. This coincides with peak harvest time in Brazil, the world’s largest exporter of sugar and sugar cane.
Investors aware of this fundamental characteristic of the sugar markets can use this historical seasonal pattern in three ways. First, investors building their own basket of commodities-based beta exposure can add sugar at these times. Second, investors already holding a basket of com-modities that contains sugar, but perhaps in an amount or weighting that is not sufficient for their beta diversification needs, can add even more sugar to their portfolio at these times. Third, investors seeking alpha, i.e., those trading to increase the absolute returns of their portfolio component to achieve higher performance using sugar, might also use these opportunities to buy or overweight sugar.
Conversely, sugar often (but not always) reaches both its absolute-price high and its widest positive diver-gence from annual average prices around February or September. These might be opportunities for those with
an overweighted sugar beta component to reduce some of their holdings; the same timing might allow an alpha trader to exit long positions initiated earlier.
These macro-patterns are also often found in the corn and soybean markets. Like sugar, corn and soybeans tend to bottom or negatively diverge from the 12-month average price at harvest time, as illustrated Figures 5 and 6. For corn and soybeans, the most significant global harvest occurs between October and December, coincident with peak har-vest time in the Northern Hemisphere. Seasonal patterns establishing absolute-price tops and positive variance from average annual prices tend to be more difficult to identify in the corn and soybean markets, but they generally occur between March and July.
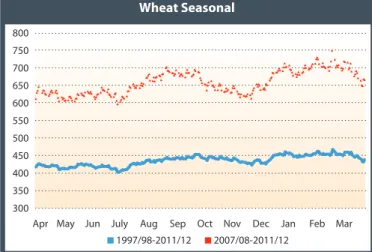
Wheat markets have significant seasonality also, with dual peaks in late summer and midwinter, and dual lows in late spring and late autumn. Wheat is harvested mul-tiple times a year: Winter wheat is harvested in late spring, while other varieties are harvested in summer and into autumn, illustrated in Figure 7.
Seasonality in the core agricultural commodities of corn, soybeans, wheat and sugar may be more supply driven than demand driven. This could be due to the fact that agricultural commodities have a relatively inelas-tic demand pattern, driven by a wide variety of uses including food, animal feed, fuel and various industrial products. But other important commodities, like oil and copper, have different seasonal tendencies that may be influenced more by usage patterns than by supply pat-terns. For instance, construction activity is often more intense in warmer months; hence copper’s seasonal pat-tern of often establishing price/variance from average lows during the Northern Hemisphere’s winter months and price/variance from average highs in the summer months, as shown in Figure 8.
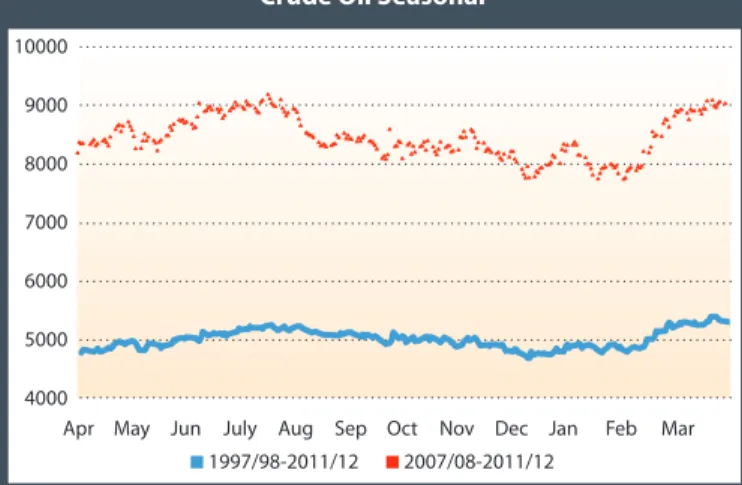
Motor fuel usage—and therefore refinery utiliza-tion—also tends to be higher during the Northern Hemisphere’s summer season, perhaps influencing crude oil’s seasonal tendencies of midwinter lows and midsummer highs, as illustrated in Figure 9.
Figure 6 Figure 7
Soybean Seasonal
Soybean Seasonal—Variance From Year’s Average Soybean Futures Prices
Sources: CQG and Newedge Coffee Group
■ 1997/98-2011/12 ■ 2007/08-2011/12 13000 12000 11000 10000 9000 8000 7000 6000 ■ 1997/98-2011/12 ■ 2007/08-2011/12 8% 6% 4% 2% 0% -2% -4% -6% -8% -10% -12%
Oct Nov Dec Jan Feb Mar Apr May Jun July Aug Sep
Oct Nov Dec Jan
Feb Mar Apr May Jun July Aug Sep ■ 1997/98-2011/12 ■ 2007/08-2011/12
Wheat Seasonal 800 750 700 650 600 550 500 450 400 350 300
Oct Nov Dec Jan Feb Mar Apr May Jun July Aug Sep
Matching Investment Objectives To ETP Design The wide variety of benchmark designs within the com-modities ETP sector can be a benefit to investors, but only if each investor chooses the proper benchmark according to his or her own investment needs. Investors need to understand the benchmark design of the ETP considered, including the holdings and the benchmark objective.
For instance, if all an investor wants is to have immediate, short-term exposure to a given commodity or sector in order to trade alpha, then a benchmark that concentrates its posi-tions in the front of the futures curve may be best suited to that particular investment objective. Such a design will likely capture the short-term price movements of the commodity, allowing the capture of alpha in the investment.
If one wants to have long-term exposure to a particular sector or commodity to achieve beta, then a benchmark
design that mitigates contango and backwardation con-cerns within the futures curve might be a better selection. Efficient long-term exposure to the commodity through mitigation of potentially negative impacts of contango and backwardation is a more important consideration for a beta trader than that of capturing near-term price movements.
The objective and term of an investor’s investment holdings are of critical importance when selecting the appropriate commodities-based ETP. Financial advisors as well as the sponsors of ETPs themselves are good sources of information when researching which invest-ment selections might be most appropriate.
Conclusion
Commodities are being used very effectively as beta diver-sifiers in many portfolios. As addressed in the Morningstar study cited above, the inclusion of commodities in a portfolio can reduce volatility over time without negatively impacting overall returns. Investors now have access through a wide variety of ETP products to a range of principal commodities. These ETPs can differ significantly in benchmark design, which is the main driver of returns to the investor. Of the major commodities represented by single-commodity ETPs, long-term time horizon snapshots of correlation and regres-sion studies show agricultural (specifically corn, soybeans and sugar) and precious metals (specifically gold and silver) as the two commodities sectors having the lowest relation-ship with the S&P 500. Additionally, investors with basic knowledge of fundamental seasonal patterns within the commodities sector can often optimize their beta exposure and/or capture alpha by using an appropriately chosen commodities-based exchange-traded product.
Figure 8 Figure 9
Copper Seasonal
Copper Seasonal—Variance From Year’s Average Copper Futures Prices
Sources: CQG and Newedge Coffee Group
■ 1996/97-2010/11 ■ 2006/07-2010/11 40000 35000 30000 25000 20000 15000 10000
Oct Nov Dec Jan Feb Mar Apr May Jun July Aug Sep ■ 1996/97-2010/11 ■ 2006/07-2010/11 15% 10% 5% 0% -5% -10% -15% -20%
Oct Nov Dec Jan Feb Mar Apr May Jun July Aug Sep
■ 1997/98-2011/12 ■ 2007/08-2011/12
Crude Oil Seasonal 10000 9000 8000 7000 6000 5000 4000
Oct Nov Dec Jan Feb Mar Apr May Jun July Aug Sep
Sources: CQG and Newedge Coffee Group
Endnotes
1 Beta is calculated using regression analysis, and you can think of beta as the tendency of an investment’s returns to respond to swings in the market. Source: http://www.
investopedia.com/terms/b/beta.asp#axzz1tWSehkhK.
2 Alpha is a measure of performance on a risk-adjusted basis. Alpha takes the volatility (price risk) of an investment and compares its risk-adjusted performance to a
benchmark index. The excess return of the investment relative to the return of the benchmark index is the investment’s alpha. Source: http://www.investopedia.com/ terms/a/alpha.asp#axzz1tWSehkhK
3 Morningstar, “Benefits of Including Commodities in a Portfolio – Lower risk and higher return 1991-2010.” Originally published on 3/1/2011.
4 Contango: A condition in which distant delivery prices for futures exceed spot prices, often due to the costs of storing and insuring the underlying commodity; opposite
of backwardation.
5 Backwardation: A market condition in which a futures price is lower in the distant delivery months than in the near delivery months.
6 Regression: A statistical measure that attempts to determine the strength of the relationship between one dependent variable (usually denoted by Y) and a series of other
changing variables (known as independent variables). Source: http://www.investopedia.com/terms/r/regression.asp#ixzz1tXVbXPIy
7 For this purpose, the correlation analysis for each specific commodity is spot continuation (generic futures contracts) as defined by and sourced on Bloomberg: “Generic
contracts, such as US1, US2, US3, ..., are constructed by pasting together “rolling” contracts, according to the pre-selected roll types on the commodity default page. The generic contract uses the value of a particular contract month until it “rolls” to the next month in the series. You can access a generic contract by replacing the month/ year code with the number 1, i.e. A 1<CMDTY>. Replacing the month/year code with the letter A will yield the active contract.” Daily data was used in the analysis for the correlation information included herein. Charts prepared by Teucrium Trading LLC as of April 27, 2012. Gasoline was not included due to the fact there was a material specification change for the specific commodity during the study period.
8 For this purpose, the regression for each specific commodity is spot continuation (generic futures contracts) as defined by and sourced on Bloomberg: “Generic
con-tracts, such as US1, US2, US3, ..., are constructed by pasting together “rolling” concon-tracts, according to the pre-selected roll types on the commodity default page. The generic contract uses the value of a particular contract month until it “rolls” to the next month in the series. You can access a generic contract by replacing the month/ year code with the number 1, i.e. A 1<CMDTY>. Replacing the month/year code with the letter A will yield the active contract.” Daily data was used in the analysis for the regression charts included herein. Charts prepared by Teucrium Trading LLC as of April 27, 2012. Gasoline was not included due to the fact there was a material specification change for the specific commodity during the study period.
9 Seasonal commodity graphs are included with the permission of John Bernardi/Newedge USA. Graphs and underlying data prepared by John Bernardi/Newedge USA
as of April 2012.
Krein/Prestbo continued from page 15
wide economic growth, for instance—they generally follow their own tune: Agriculture, and to a lesser extent livestock, depends heavily on local weather. Energy is affected by regional conflict and supply chains. Precious metals are swayed by geopolitics and economic policies, and so on.
But in a postfinancial-crisis world, the realized corre-lation has started to climb and now stands at about 0.45. While this reading is not the highest it ever has been, the trend in recent years is clearly upward.
Conclusion
In just four years, commodity markets have changed
in terms of their relationship both to other assets class-es as well as to each other. Performance has lagged. And investors have begun to question their original buy-in decision as they decide on their next move.
Although much has changed, commodities still under-lie global economic growth, and commodities futures contracts retain their unique structural characteristics. Investors seem to be shifting their attention to innovative products, such as dynamic contract-selection indexes in an effort to mitigate the contango effect, as they grapple with current challenges and position their portfolios to best capture commodities’ next moves.
Dow Jones-UBS Commodity Index, One-Year Realized Correlation Over Time 1.000 0.800 0.600 0.400 0.200 0.000 -0.200 -0.600 -0.400
Source: Dow Jones Indexes Research
12/11 6/11 12/10 6/10 12/09 6/09 12/08 6/08 12/07 6/07 12/06 6/06 12/05 6/05 12/04 6/04 12/03 6/03 12/02 6/02 12/01 6/01 12/00 6/00 12/99 6/99 12/98 6/98 12/97 6/97 12/96 6/96 12/95 6/95 12/94 6/94 12/93 6/93 12/92 6/92 12/91 6/91
■ Dow Jones-UBS Commodity Index
1-Year Realized Index C
orrelation
• • • •
www.teucrium.com
Source: faostat3.fao.orgGlobal Population Growth and the Demand for Grains
Sources:
¹Teucrium Trading, LLC
²U.S. Census Bureau, World POPClock Projection http://www.census.gov/population/popclockworld.html
³As reported per the USDA on the Nov 9, 2012 World Agriculture Supply and Demand Report
4USDA. GOV - http://www.usda.gov/oce/commodity/archive_projections/USDAAgriculturalProjections2021.pdf³
Approximately 13.5 million additional acres would need to be cultivated (about twice the size of Massachusetts) producing a combined 722 million bushels of corn, soybeans and wheat just to supply the global population growth estimated for a full year¹.
The global population increases by about 2.37 persons every second, 142 people per minute and,
based on this estimate, about 75 million people per year²
Based upon the USDA estimates for 2012–2013, current annual demand per person is approximately 4.77 bushels of corn, 1.36 bushels of soybeans and 3.52 bushels of wheat for every man, woman and child on earth³
At current yield per acre and demand levels, this results in the need for about 26 total acres every minute
in additional arable land for these three grains alone - 9 acres for corn production, 6 for soybeans and 11
for wheat¹
As incomes in developing countries rise, consumers tend to diversify their diets and increase consumption
Backwardation: A market condition in which a futures price is lower in the distant delivery months than in the near delivery months. Contango: A condition in which distant delivery prices for futures exceed spot prices, often due to the costs of storing and insuring the
underlying commodity. Opposite of backwardation.
Roll: When an investor replaces an existing futures position with a new one having a later expiration date. Spot Month: The nearest expiration and delivery month for futures contracts.
¹http://www.oecdobserver.org/news/fullstory.php/aid/3681/An_emerging_middle_class.html
Contract Months: March, May, July, September & December
Contract Months: January, March, May, July & November
Contract Months: March, May, July September & December
Contract Months: March, May, July & October The
third-to-expire CBOT Corn Futures Contract, weighted 30% The CBOT Corn Futures Contract expiring in the December following the expiration month of the third-to-expire contract, weighted 35% Second-to-expire CBOT Soybean Futures Contract, weighted 35% The second to
expire CBOT Corn Futures Contract, weighted 35%
The Teucrium Funds provide investors direct exposure to basic agricultural and energy commodities without the
need for a futures account. Teucrium is an issuer of single-commodity-focused next generation Exchange Traded Products ("ETP"). The Teucrium family of funds are all traded on the NYSE Arca.
With its substantial experience in commodity futures trading, the Teucrium team has the ability to:
The investment objective of each of the Teucrium Funds (NYSE: CORN, SOYB, WEAT, CANE, NAGS, CRUD,
TAGS) is to have the daily changes in percentage terms of the Shares’ Net Asset Value (“NAV”) reflect the daily
changes in percentage terms of a weighted average of the closing settlement prices for the fund-specific bench-mark futures contracts for the Fund (described below).
Deliver ETPs in an equity format for investing without the use of leverage.
Design fund structures to mitigate the impacts of contango, backwardation and the cost of portfolio turnover by investing in multiple contract months specifically tailored to the seasonality of each commodity, rather than only in the front month as do many first generation funds.
Focused the funds on the largest food and energy sources required to serve a growing global population, including an expanding middle class, which is projected to reach 4.9 billion by the year 2030.¹ The third-to-expire CBOT Soybean Futures Contract, weighted 30% The CBOT Soybean Futures Contract expiring in the November following the expiration month of the third-to-expire contract, weighted 35% The second-to-expire CBOT Wheat Futures Contract, weighted 35% The third-to-expire CBOT Wheat Futures Contract, weighted 30% The CBOT Wheat Futures Contract expiring in the December following the expiration month of the third-to-expire contract, weighted 35% The second-to-expire Sugar No. 11 Futures Contract, weighted 35%
Will be rebalanced regularly to maintain the approximate 25% Dollar Weighted Average allocation to each Underlying Fund (CORN, SOYB, WEAT, CANE)
The nearest to spot month March, April, October and November Henry Hub Natural Gas Futures Contracts traded on the NYMEX, weighted 25% equally in each contract month
The nearest to spot June or December Oil Futures Contract, weighted 35% The June or December Oil Futures Contract following the aforementioned, weighted 30%
The next December Oil Futures Contract that immediately follows the aforemen-tioned (2), weighted 35%
The third-to-expire Sugar No. 11 Futures Contract, weighted 30% The Sugar No. 11 Futures Contract expiring in the March following the expiration month of the third-to-expire contract, weighted 35%
CORN
SOYB
WEAT
CANE
TAGS
NAGS
CRUD
• •
The views in this article were those of Teucrium Trading, LLC as of January 1, 2013 and may not reflect the views of the Company on the date the material is first published or any time thereafter. These views are intended to assist the readers in understanding commodities and do not constitute investment advice. This should not be considered as an offer to see or a solicitation of an offer to buy any securities mentioned herein.
The Teucrium Funds have a limited operating history, meaning there is little performance history that might serve as a basis to evaluate an investment in the Trust. Investing in a Fund subjects an investor to the risks of the applicable commodity market, which investment could result in substantial fluctuations in the price of Fund shares. Unlike mutual funds, the Funds generally will not distribute dividends to shareholders. The Sponsor has limited experience operating commodity pools; a commodity pool is defined as an enterprise in which several individuals contribute funds in order to trade futures or futures options collectively. Investors may choose to use a Fund as a vehicle to hedge against the risk of loss and there are risks involved in hedging activities.
Commodities and futures generally are volatile and are not suitable for all investors. The Funds are not mutual funds or any other type of investment company within the meaning of the Investment Company Act of 1940, as amended, and are not subject to regulation thereunder. Because the Funds will invest primarily in commodity futures contracts and other derivative instruments based on the price of underlying commodity, an investment in the Funds will subject the investor to the risks of that market, and this could result in substantial fluctuations in the price of the shares of each Fund. Shares of the Funds are not insured by the Federal Deposit Insurance Corporation (“FDIC”), may lose value, and
have no bank guarantee. For a complete description of the risks associated with the Funds, please refer to the applicable
prospectus.
Shares of the Funds are not FDIC insured, may lose value and have no bank guarantee. Foreside Fund Services, LLC is the distributor for the Teucrium Funds.
The Teucrium Funds have a patent pending on the methodology employed by the Funds.
A copy of the prospectus for each Fund may be accessed at the links below: SOYB: http://www.teucriumsoybfund.com/pdfs/soyb-prospectus.pdf CANE: http://www.teucriumcanefund.com/pdfs/cane-prospectus.pdf WEAT: http://www.teucriumweatfund.com/pdfs/weat-prospectus.pdf CORN: http://www.teucriumcornfund.com/pdfs/corn-prospectus.pdf NAGS: http://www.teucriumnagsfund.com/pdfs/nags-prospectus.pdf CRUD: http://www.teucriumcrudfund.com/pdfs/crud-prospectus.pdf TAGS: http://www.teucriumtagsfund.com/pdfs/tags-prospectus.pdf