Introduction
While migration is an important livelihood strategy adopted by individuals and households to improve living standards (Awumbila et al., 2014), there are contesting views on its effects on the welfare of the migrant households in migrant sending areas and socioeconomic development in migrant sending areas (Mendola, 2011). Despite the recognition that migration can contribute to improved livelihoods and socioeconomic development, there is a general
paucity of data on migration patterns and the relationship between migration and the wellbeing of migrants’ households. In Africa, most of the earlier studies on migration patterns and effects have focused on international migration, even though internal migration is more pervasive in the region. While a few researchers have examined the welfare impacts of internal migration in some African countries, these assessments are largely based on cross-sectional data. Relying on panel data generated as part of the Migrating out of Poverty (MOOP)
Changing Patterns of
Migration and Remittances
in Rural Ghana
Key lessons
•
While Western media images and political narratives tend to suggest an exodus of Africans
to Europe, the majority of migrants from Ghana moved to destinations within Ghana.
•
Spatial inequalities in development is the most important driver of migration from rural
Ghana.
•
Annual real cash remittances received by migrant households significantly increased
between 2015 and 2018.
•
Migration from rural areas must not be always portrayed as detrimental to the welfare
of origin households, as many migrants are contributing to poverty reduction and
socioeconomic development in their areas of origin.
•
There is a need for policymakers to develop programmes to leverage remittances for
development in migrants’ sending areas.
research project, this Policy Brief examines changes in migration and remittance patterns of households interviewed in rural Ghana in 2015 and 2018.
Methods
This Policy Brief draws largely on longitudinal household survey data generated in 2015 and 2018 in the Northern, Upper East, Upper West, Brong Ahafo, and Volta regions of Ghana. Our earlier MOOP data consist of two waves of panel data (2013 and 2015), with 1,412 households in the 2013 survey round and 1,114 households surveyed in 2015. In the 2018 study, we did not simply re-survey the 1,114 households. Rather, we employed some strategies to address attrition and increase the sample size back to the 2013 figure. In each enumeration area, we made efforts to randomly select replacement households with similar characteristics to the households who had dropped out since the 2015 survey. We also made efforts to increase the number of international migrant households by selecting three additional households with international migrants, in each enumeration area.
What we found
Changes in the migration status of
household members
The findings show that most of the household members had the same migration status in 2018 as they did in 2015. In 2018, the migration status of only 15 per cent of the 4,298 persons categorised as non-migrants in 2015 had changed. While 85 per cent of people interviewed in 2015 were still non-migrants, 12.8 per cent were internal migrants by 2018. In addition, 7.6 per cent of the 446 persons listed as internal migrants in 2015 had returned by 2018. Only 2.9 per cent of the 34 international migrants in 2015 had returned by 2018. This implies that international migrants are less likely to return to their area of origin. The study also shows that
about 21.2 per cent of the internal return migrants and 25 per cent of international return migrants in 2015 had re-migrated internally as of 2018. The findings show that re-migration is quite common among both internal and international return migrants. Re-migrations also imply that migrants’ re-integration processes are not quite effective.
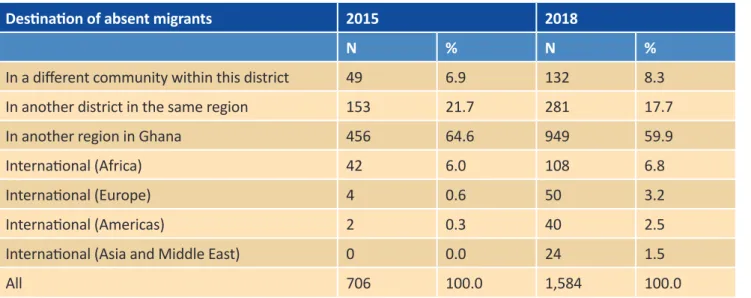
Destinations of migrants
As shown in Table 1, in both 2015 and 2018, over 80 per cent of the current (absent) migrants moved to another community within Ghana, with a majority of them (65 per cent in 2015 and 60 per cent in 2018) moving across regions in Ghana. Migration within the same region was also quite high for both years, with nearly 22 per cent of migrants in 2015 and 18 per cent of migrants in 2018 moving to another district in the same region. The proportion of migrants that moved across international boundaries was very low in both waves. A significant proportion of the international migrants were in destinations within Africa. In 2018, only 7.2 per cent of the migrants from the five regions were living at destinations outside Africa.
There is, however, a significant relationship between region of origin and destination of migrants. The proportion of migrants that travelled to destinations outside Ghana was highest in Brong Ahafo Region, which is the most resource-endowed region among the five regions studied. The proportion of migrants moving across regions tend to be consistently highest in the Upper East and Upper West regions, both of which are relatively poorer than the other regions. Consistent with the Mobility Transition Theory, our findings suggest that poorer regions (e.g. Upper East and Upper West regions) tend to produce more internal migrants, while resource-rich regions (e.g. Brong Ahafo) tend to produce international migrants. Urban areas in southern Ghana were the most popular destinations of a majority of the migrants. We observed a high
incidence of cross-regional migration. We found that 50 per cent of migrants in a different community within the same district in 2015 have now moved to another region in Ghana. This suggests that step migration is a common type of movement.
Drivers and mode of financing migration
Consistent with earlier findings (see Awumbila et al., 2014), spatial inequality in job opportunities still largely accounts for migration in Ghana. Economic factors (e.g. the need to seek work or better jobs) were cited as the main reasons for migration in both 2015 and 2018. Social networks were an important factor that facilitated migration in both 2015 and 2018, measured by the number of migrants from the district having a contact at their destination. In both waves, the proportion of migrants that had a contact at their destination prior to migration was higher among women than men, but the gap was wider in 2018. The results suggest that more males than females are taking risks in terms of migrating without a contact person. Also, migrants from the three northern regions are less likely to rely on social networks for migration. With regard to the mode of financing migration, our findings suggest that increasingly, self-reliance is becoming a key mechanism of financing migration.A majority of migrants (75.3 per cent in 2018 and 50 per cent in 2015) depended on their personal savings for migration. The proportion of migrants funding trips through loans from family and friends also increased between 2015 and 2018.
Remittances and wellbeing of migrant
households
The average annual cash remittance sent by migrants to their households of origin in Ghana within the 12 months prior to the research has increased significantly in the last three years. As shown in Table 2, the average annual amount sent by both males and females increased between 2015 and 2018. Male migrants sent more remittances, on average, than female migrants in both 2015 and 2018, and this may be explained by lower wages for women in the informal sector, meaning that they can only send smaller amounts (Teye et al., 2017). However, the percentage increase in the mean amount of remittances sent between 2015 and 2018 was almost the same (27 per cent for men and 28 per cent for women). International absent migrants sent more on average than internal absent migrants, as expected due to wages being on average relatively higher for international migrants than for internal migrants.
Destination of absent migrants 2015 2018
N % N %
In a different community within this district 49 6.9 132 8.3
In another district in the same region 153 21.7 281 17.7
In another region in Ghana 456 64.6 949 59.9
International (Africa) 42 6.0 108 6.8
International (Europe) 4 0.6 50 3.2
International (Americas) 2 0.3 40 2.5
International (Asia and Middle East) 0 0.0 24 1.5
All 706 100.0 1,584 100.0
Source: Authors’ own
As shown in Figure 1, the mean real cash remittances (received from all absent migrants) increased between 2015 and 2018 for most categories of households (i.e. those with
international migrants only, and households with both internal and international migrants), but
there is a slight fall for households with internal migrants. These observations suggest that the overall increase in households’ mean cash remittance receipts between 2015 and 2018 is driven mainly by increases in international migrant remittances.
Destination of
sender MaleMean Median Std N FemaleMean Median Std N AllMean
2015 Internal migrant 886 420 1,208 150 689 436 797 60 830 International migrant 2,415 1,474 2,852 21 1,777 1,777 458 2 2,360 All 1,074 442 1,578 171 725 472 809 62 981 2018 Internal migrant 974 500 1,326 379 579 375 638 176 849 International migrant 2,945 2,000 2,322 92 2,202 1,650 2,050 48 2,690 All 1,359 600 1,752 471 926 500 1,285 224 1,220
Table 2 Average annual amount of real cash remittances received from migrants within the last 12 months by wave, gender, and destination of the sender
Source: MOOP Income and Remittances Survey (2018).
Figure 1 Households’ real mean cash remittances received, by household’s migration status (2018 prices)
2015 2018
Only internal Only international Both internal and
international Total 3,000 2,500 2,000 1,500 1,000 500 0 2,460.6 829.1 840.1 2,829.3 1,375.6 1,935.5 1,297.2 995.4
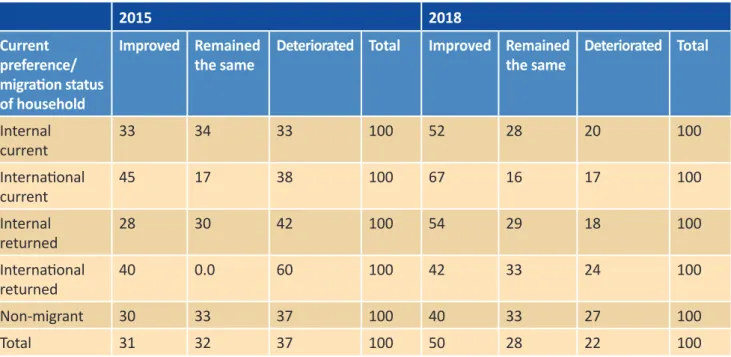
Our assessment of the effects of migration on the subjective wellbeing of households indicates that irrespective of their migration status, the proportion of households that subjectively reported an improved financial situation within the five years prior to the research was higher in 2018 than in 2015. In both 2015 and 2018, however, the proportion of households that reported their financial situation
having improved within the five years prior to the studies was highest among households with international migrants (see Table 3). Using the two waves of the survey data, our results confirm the findings in the literature that households with migrants, particularly with international migrants, tend to have enhanced household welfare compared to households with internal migrants (Adams, 2007).
2015 2018 Current preference/ migration status of household Improved Remained
the same Deteriorated Total Improved Remained the same Deteriorated Total Internal current 33 34 33 100 52 28 20 100 International current 45 17 38 100 67 16 17 100 Internal returned 28 30 42 100 54 29 18 100 International returned 40 0.0 60 100 42 33 24 100 Non-migrant 30 33 37 100 40 33 27 100 Total 31 32 37 100 50 28 22 100
Table 3 Subjective perception of change in financial situation in the past five years by migrant type
The way forward
The findings presented in this Policy Brief indicate that migration patterns in rural Ghana have not changed much within the last three years. Internal migration is still a dominant form of migration in Ghana. The policy implications of this finding are that migration management programmes should not only focus on international migration. There is a need to develop programmes to harness the benefits of internal migration. Based on our finding that spatial inequality in job opportunities is the main driver of internal migration in the country, we draw the attention of policymakers to the fact that policies seeking to discourage people from migrating are bound to fail unless the current spatial
inequalities in development are reduced. In line with the finding that migrants from the three northern regions are less likely to rely on social networks for migration, we recommend more sensitisation and migration facilitation interventions in those regions to help curb high migration risk-taking. This is important to help address the exploitation of young migrants in large cities in southern Ghana. The finding that the average amount of remittances sent by migrants has increased shows that many migrants are contributing towards poverty reduction and socioeconomic development in their areas of origin. The findings suggest the need for policymakers to develop programmes to leverage remittances for poverty reduction and socioeconomic development in migrants’ sending areas.
Acknowledgements
This Policy Brief is based on DFID/UK aid-funded research that underpins the Working Paper: Teye, J.K.; Boakye-Yiadom, L.; Asiedu, E.; Awumbila, M. and Appiah Kubi, J. (forthcoming). Changing Patterns of Migration and Remittances: A Case Study of Rural Ghana, Migrating out of Poverty Working Paper. Brighton: School of Global Studies, University of Sussex.
This is an output from a project funded by UK aid from the UK government. The views expressed do not necessarily reflect the UK government’s official policies.
© University of Sussex, School of Global Studies, 2019
This is an Open Access Policy Brief distributed under the terms of the Creative Commons Attribution 4.0 International licence (CC BY), which permits unrestricted use, distribution, and reproduction in any medium, provided the original authors and source are credited and any modifications or adaptations are indicated. http://creativecommons.org/licenses/by/4.0/legalcode
Migrating out of Poverty
University of Sussex • Arts B365 • Brighton BN1 9QN • United Kingdom
Tel +44 1273 873 535 Email [email protected] Website http://migratingoutofpoverty.dfid.gov.uk/
https://twitter.com/MigrationRPC www.facebook.com/migratingoutofpoverty http://migratingoutofpoverty.blogspot.com/
Further reading
Adams, R.H.J. (2007) International Remittances and the Household: Analysis and Review of Global Evidence. Washington DC: World Bank.
Awumbila, M.; Owusu, G. and Teye, J.K. (2014). Can Rural–Urban Migration into Slums Reduce Poverty? Evidence from Ghana, Migrating out of Poverty Working Paper 13. Brighton: School of Global Studies, University of Sussex.
Mendola, M. (2011). Rural Out-migration and Economic Development at Origin: A Review of the Evidence 24, pp. 102–122. Available at: https://doi.org/10.1002/jid.1684 (Accessed 30 July 2019).
Teye, J.K.; Awumbila, M.A. and Darkwa, A. (2017). Gendered Dynamics of Remitting and Remittance Use in Northern Ghana, Migrating out of Poverty Working Paper 48. Brighton: School of Global Studies, University of Sussex.
Teye, J.K.; Boakye-Yiadom, L.; Asiedu, E.; Awumbila, M. and Appiah Kubi, J. (forthcoming). Changing Patterns of Migration and Remittances: A Case Study of Rural Ghana, Migrating out of Poverty Working Paper. Brighton: School of Global Studies, University of Sussex.