Method for Risk Analysis in regard
of different types of projects
Alex Maj Bangsgaard
Master thesis
Academic advisor:
Jørgen Lægaard
MSc in Management Accounting & Control
Aarhus School of Business, University of Aarhus
2010
2
Contents
Figure and table index ... 5
1. Introduction and purpose ... 6
1.2 Research questions ... 6
1.3 Methodology ... 6
1.4 Delimitation ... 7
1.5 Construction of the thesis ... 8
2. Projects definitions ... 9
2.1 Project life cycles ... 11
2.2 Types of projects ... 12
2.2.1 Industrial projects ... 16
2.2.2 Manufacturing projects ... 17
2.2.3 Management projects ... 17
2.2.4 Scientific research projects ... 18
2.3 Project risk ... 18
2.3.1 Industrial projects risks ... 19
2.3.2 Manufacturing projects risks ... 20
2.3.3 Management project risks ... 20
2.3.4 Scientific research project risks ... 21
3. Project risk management... 22
3.1 Define objectives ... 23
3.1.1 Feasibility study ... 23
3.1.2 Work Breakdown Structure ... 24
3.1.3 Critical Path Method ... 26
3.1.4 Budget... 27
3
3.1.6 Communication plan ... 28
3.1.7 Procurement Plan ... 28
3.2 Risk identification ... 29
3.2.1 Identification by risk analyst ... 30
3.2.2 Risk identification by work group ... 30
3.2.2.1 Brainstorming ... 31
3.2.2.2 Nominal group technique ... 31
3.2.2.3 Delphi Technique ... 32
3.2.2.4 Brainstorm, NGT and Delphi technique ... 33
3.2.3 Cause-and-effect diagrams ... 33
3.2.4 Risk breakdown structure ... 34
3.2.5 Risk register ... 35
3.3 Qualitative and quantitative risk analysis ... 36
3.3.1 Qualitative risk analysis methods ... 36
3.3.1.1 Probability and impact matrix ... 37
3.3.2 Quantitative risk analysing method... 38
3.3.2.1 Quality risk quantification ... 38
3.3.2.2 Quantify safety risk ... 40
3.3.2.3 Estimation, probability and expected value ... 41
3.3.2.4 Simulation Modelling ... 42
3.4 Risk assessment ... 43
3.4.1 Scope Expected Deviation ... 44
3.5 Risk response action ... 45
3.5.1 Types of risk responses ... 46
3.5.2 Decision tree ... 50
3.6 Monitoring and controlling the risks ... 51
4. Generic model ... 53
4
4.2 M2 Risk identification ... 55
4.3 M3 Quantify the risk ... 56
4.4 M4 Risk assessment ... 56
4.5 M5 Risk response action ... 57
4.6 M6 Implement, monitor and control ... 57
4.7 Discussion of the model ... 58
4.8 Industrial projects ... 59 4.9 Manufacturing projects ... 61 4.10 Management projects ... 63 4.11 Scientific projects ... 64 5. Conclusion ... 65 6. References ... 68 6.1 Primary literature ... 68 6.2 Secondary literature ... 71
5
Figure and table index
Figure 1 – The project triangle ... 9
Figure 2 – 5x5 model ... 10
Figure 3 – Project life cycle example of development in risk and cost of change ... 12
Figure 4 – NCTP model ... 14
Figure 5 – Model for risk analysis ... 22
Figure 6 – Example of Work Breakdown Structure and Organisational Breakdown structure ... 25
Figure 7 – Example of cause-and-effect diagram ... 34
Figure 8 - Example of risk breakdown structure ... 35
Figure 9 – Tye-Persons’ principle... 40
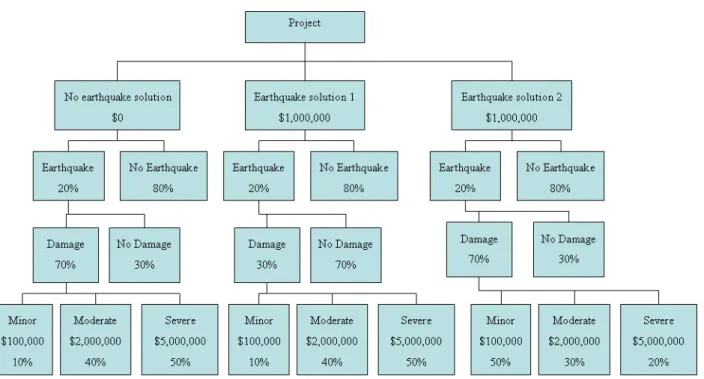
Figure 10 – Example of decision tree ... 50
Figure 11 – Generic model ... 53
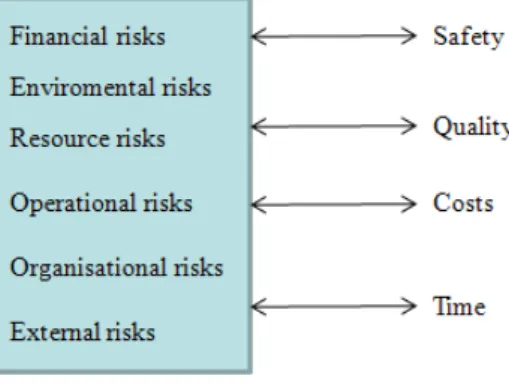
Figure 12 – Interaction between risks and the objectives ... 65
Table 1 – Probability and impact matrix... 37
Table 2 – Responses for different types of risk ... 49
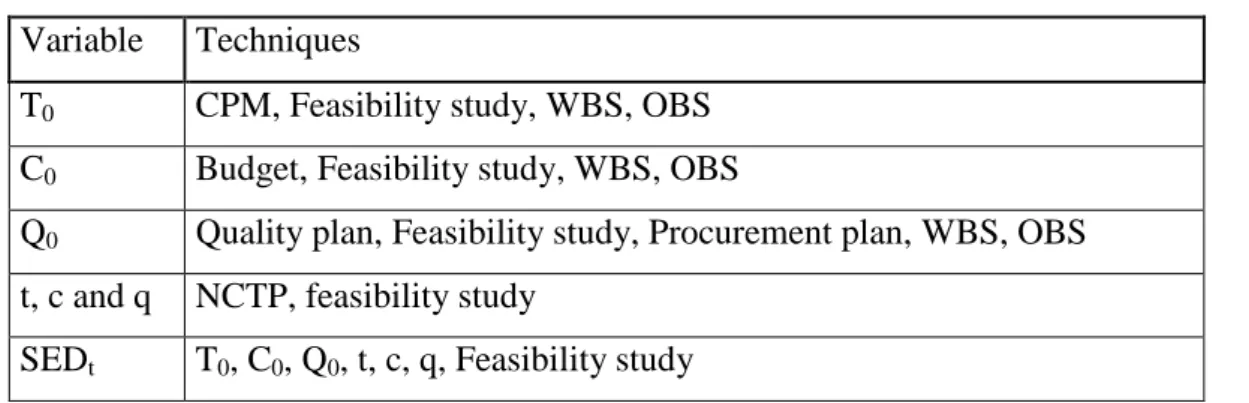
Table 3 – Techniques used for determining variables ... 54
6
1. Introduction and purpose
For every opportunity there will be risk involved so for projects that opens up opportunities there will naturally be risks. To be able to make the project as predictable as possible you will have to understand the project and the risks through risk analysis so the risks can be prevented.
There are different kinds of projects that can be defined in a number of ways and for each project type there are different types of risks. So before you identify the risks you will have to know what type of project you are dealing with. With identified risks there are ways to quantify them so the necessary decisions can be made for the identified risks.
The purpose of this thesis is to find out what kind of risks that are associated with different types of projects and to determine the best different ways to make risk analysis and the different types of project, if there is any difference.
1.2 Research questions
Primary:
• What is the best method for analysing the risks for different types of projects?
Secondary:
• What kind of project exists and how do you define them?
• What kind of different risks are there in different types of projects and how do you define them?
• How do you analyse the risks in the different types of projects? • What can you use the analysed risks for?
1.3 Methodology
Ontology is about how the word or reality is perceived, and therefore how you see the world where the knowledge is obtained. The objectivist, or realist, sees the world as objective and independent from the observer. It is made of concrete, tangible, and relatively stable structures and it is possible
7 to find absolute truths about it.
On the other hand we got the subjectivist that sees the world is a product of the mind of the person who observes it. There are no real structures that exist in the world outside individuals, so the research is dependent of the researcher’s opinion of the observed individuals.
The epistemology, that concern what knowledge is and how you obtain it, is closely related with the ontology, where you got two extreme points. The objectivist (or positivist) where the reality can be studied by rational inquiry and the knowledge can be communicated in tangible form. On the other hand the subjectivist, where the reality is socially constructed, the world is relativistic and the knowledge can only be understood by the point of view of the researcher.
This thesis will be made in mostly in an objective approach, since I believe that the reality is objective. It exists independently whether it is experienced or not, but observations will be
individually interpreted subjectively to some extent. With that thinking this thesis will be made with the approach called the critical realism.
Critical realism uses retroduction that is about collecting data and knowledge about the subject that can explain the phenomenon in this thesis, to find knowledge about assessment of risk in projects and then a quantitative way explain what differs from types of projects and risks, which in the end should give a complete method for risk assessment in a given project.
1.4 Delimitation
The purpose of this thesis is to form a method for assessing projects sole by their risks and so does not include other areas of project management that might be used for assessing projects.
Furthermore, the assessing methods will be a generalised method for the different categorised projects types because of the limited time and space for the thesis. So the major diversity that may exist in the categorised project types will only be taken in minor account.
Some projects are so small, uncomplexed or inexpensive that excessive risk assessment will not make sense, so this method is directed to the big, complex and expensive projects where it is difficult to get the big picture and where you got lots of money invested so you want to have more reassurance.
8 Risks are in risk management not only the threats that can affect the project, but it also involves the opportunities. This thesis will though only concentrate on the threats.
1.5 Construction of the thesis
The thesis will be built in steps to answer the research questions. First step will provide the basic definitions of project, project types, risk and categorisation of different risks. Next the techniques for risk analysis will be explained along with how they are interacting. That will culminate to a generic model for risk analysis that will be explained along with the difference between the identified types of projects.
Reference for the literature will be in the footnotes with reference to the last name of the author of the literature that is listed first in the reference list, further there will be a reference to the page in the books of the referred literature.
9
2. Projects definitions
The definition of a project is a temporary endeavour to with purpose of making a unique product, service or result, which mean that the project must have a specific start and ending. A product can be considered to be a component of another item or an item itself. A result indicates an outcome or document (e.g. a research project can have a knowledge outcome).1
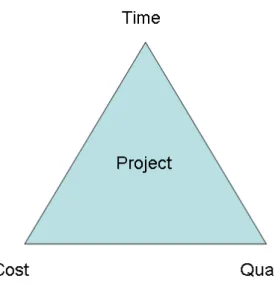
Furthermore a project has to meet some objectives and these objectives are most common illustrated in the project triangle which can be seen in figure 1.
Figure 1 – The project triangle
As seen on figure 1 the objectives for a project to stay within is: • Time: the project must be completed on time.
• Budget: the project must be accomplished within the budgeted costs.
• Quality: the project must the completed within the specified quality requirements.
Every project will have these criteria though projects can have a priority in one of the objectives. If it is time-bound the project must be completed on time even if it means that it will have higher costs or the quality will be poorer, e.g. if the project must be done for a certain event. And the same goes
1
10 for cost- and quality-bound projects also. So the three objectives are connected to each other, which is why none of them can be ignored.
Some project managers do also include a fourth dimension, which is the criteria of safety, while others argue that it is already in the three dimensional model, and that safety is so basic that budget, time and quality should be reached within safety.2
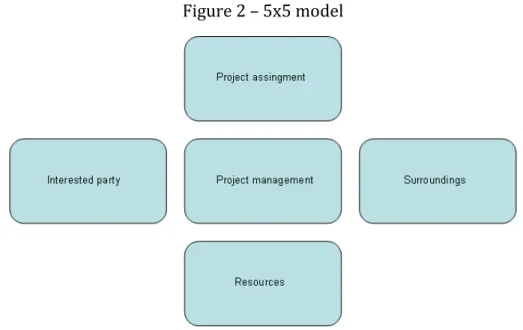
Another way to make an overview of a project is with the 5x5 model which is illustrated below in figure 23
Figure 2 – 5x5 model
Project management: is the central part of this model and is involving the ability to plan and structure a project, and make sure that the project is carried out the best way to give the best final end result.
Project assignment: it is the reason for the project. It included a definition of what the end result should be, the project frames (e.g. time, budget and quality) and how it will be carried out.
Interested parties: are different groups or organisations that are either working for or against the project. So it is important to make sure you have the right acceptance to carry the project through.
2 Lester p. 2-3 3
11
Surroundings: are the surroundings the project and the end result of the project have to interact with. Such as technology, rules, demand, competition etc.
Resources: is the material, equipment etc and the knowhow to use it. And then it also includes money, the project has to be financed.
2.1 Project life cycles
As stated a project has definite beginning and end the processes in between can wary depending on e.g. the organisation, industry, technology, which will determine how the project life cycles will be shaped. The life cycle often provides the basic framework for managing the project.
A project life cycle can be mapped in different ways. The most typical is how the cost and staffing levels will behave through the project, to show for the upper management. But most every element in a project can through time be mapped to define the project. Depending on the projects
complexity and need of control it can be beneficial to divide the project into different phases4, and
the most common phases for a project life cycles are: 5
• Concept: The desire for a product, facility or service develops into a need, and different options for the project are evaluated.
• Design: Guidelines for the project are made and its objectives are defined.
• Implementation: The processes for making the end result of the project, and this will be the phase of the project that is the longest.
• Commissioning and hand over: The end result is inspected and approved, and will be handed over to the customer.
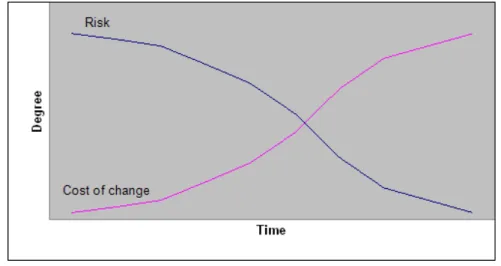
In figure 3 an example can be seen of how risk and cost of change varies through the time of a project.
4 PMBOK p. 16-17 5
12
Figure 3 – Project life cycle example of development in risk and cost of change
Figure 3 shows how it typically will be in a project. The closer you get to the end of the project the less risk is associated with it, but at the same time it gets more difficult to make alterations in the project so the cost of change goes up with it.
2.2 Types of projects
As stated earlier a project is defined by having a definite start and end, but a project is not just a project, there are many different types of projects. Every project is different and projects can be categorized in numerous ways and levels, even if a project is repeated some aspect of it will be different. Even though, it is possible to classify projects in four different general types after the nature of the product or service the project deals with.6
The four general project types:
1. Industrial projects 2. Manufacturing projects 3. Management projects 4. Scientific research projects
Industrial projects: has been named so just to give it a common title and because these kinds of
6
13 projects most often are associated with industrial projects, but not limited to though. It is projects of civil engineering, construction, petrochemical, mining and quarrying. A common characteristic is that the concrete work that makes the product/service is must be performed on a location which is exposed to the elements and which are often not near the head office.
These projects often requires large amounts of capital and the huge projects are often carried out by different specialist or contractors, and perhaps there are a main actor or actors working through a consortium or a joint venture.
Examples of industrial project involve building, construction, mining, quarrying, earth moving and land reclamation.7
Manufacturing projects: are projects that results in a production of an item. The product may be custom built for a single customer, but these types of projects can also be the internal research and development of products.
The manufacturing projects are often conducted in a home base where the environments are more controllable, but sometimes it may also involve performing activities on customers ground like installing a produced piece of equipment. More difficult can it be with very complex projects where parts of the final product are produced on several different locations and then collected to be
assembled in one place.
Manufacturing projects can involve research and development of a new product, equipment manufacture, ship- and aircraft building, food and drink and pharmaceutical.8
Management projects: are projects that involves IT projects and projects that conducts change in the management. These kinds of projects is often internal in the company and are for the own interest of the company. This type of projects does not usually give a visible or tangible product, but if the project is not performed with success it can have big problems and consequences for the performance part of the entire company.
Management projects may be associated or based on industrial or manufacturing projects, since a company can be required to make changes in order to able to carry out another type of projects. Other examples of management projects can be to relocate the headquarter, develop and introduce a new computer system, launch a new marketing campaign, restructure the organisation or prepare a
7 Lock (PM) p. 6 8
14 stage show.9
Scientific research project: is a special type of project. These projects is trying to extent the current human knowledge on a matter and by that it has the potential to very profitable but at the same time it may just consume a lot of money over a lot of years without any useable outcome. It is the uncertainty of the outcome that makes this type of projects unique since you can not totally predict the result of the project.
The result of the scientific research project can have the potential to give birth to projects from the three other types or on some way improve other projects, all depending on what the scientific research is about and what the result is.10
Besides of the above mentioned four types to categorise projects in there are numerous ways to further sort the projects. E.g. by size, tangible/intangible, complexity etc. and they can all define the project in some way and, among other things, help determine what the risks are and how critical they are. In figure 4 is the NCTP model that can be used to map the project further so you can get a better understanding of the project.11
Figure 4 – NCTP model 9 Lock (PM) p. 6 - 7 10 Lock (PM) p. 7 11 Dvir
15
Complexity: how complex is the product.
• Assembly: Subsystem, performing a single function. • System: Collection of subsystems, multiple functions.
• Array: Collection of many different systems with a common task.
Novelty: how new is the product to the marked.
• Devirative: Improvement of an existing product
• Platform: A new generation of an existing product line. • Breakthrough: A product that has not been seen before.
Technology: the extent of new technology used by the project. • Low-tech: No new technology used.
16 • High-tech: All or almost all new, but still existing technology.
• Super high-tech: The necessary technology does not exist at the beginning of the project.
Pace: how urgent the project is and what the available timeframe is. • Regular: Delays are not critical.
• Fast-competitive: It is important for the business when the product gets to the marked. • Time-critical: The time of completion is essential for success.
• Blitz: Crisis project, an immediate solution is vital.
For all the above four dimension the rule is that the higher complexity, pace, technology and novelty there is the higher the uncertainty and risk of the project will be.
2.2.1 Industrial projects
To understand the industrial projects it will be further defined with use of the NCTP model.
Complexity: The complexity will normally not exceed the system level. The most complex industrial project type will probably be the engineering of a large building that has different qualities and that requires different specialists or contractors.
Novelty: Since industrial projects mostly are done by craftsmanship, work that has fundamentally been done before, the novelty is relatively low. But of course there can be platform projects in this kind of projects as well again the large, complex building can be put out as an example.
Technology: As stated before the industrial projects craft work projects, so the technology for these projects will most often be low-tech since the basic work have been done before with the same kind of equipment.
Pace: The pace of an industrial project can vary a lot depending what the project is. For example if a new stadium has to be completed for the opening of the world cup it would be a time critical level. But many of these types of projects will probably be regular pace levelled because the quality often
17 are more important than the time, and there have to be many safety regulations that needs to be respected and cannot be rushed.
2.2.2 Manufacturing projects
Complexity: The complexity of these kinds of projects is difficult to generalize, it all depends on the product, but many of the projects, such as ship and aircraft building, are fairly complex, so would be levelled as system.
Novelty: Since the manufacturing projects often are customised orders the novelty will be
categorised as devirative. The projects that involve research and development of a new product are of course platform or perhaps even breakthrough in its novelty.
Technology: Again these types of projects are difficult to categorise their technology usage, but most of the manufacturing projects probably use low- or medium-tech, because the manufactures do create products in their industry speciality.
Pace: Customised orders and research and development products need to get out relatively fast if there are competitors, which most branches got, so the pace level will at least be fast/competitive.
2.2.3 Management projects
Complexity: The complexity of the management projects depends on the level of the change that is being made or the IT implementation/creation that is made. Many of these projects often goes up on the array level of complexity, because an internal management style has many ‘subsystems’ that will have to work together to make an effective company.
Novelty: These kinds of projects are mostly internal therefore it is often an improvement on how things already are done, so the novelty level will mostly be devirative or platform.
18 will not be higher than low-tech, since the need for that kind of projects is not technology. But if it is an IT project, then it more like can go up to be using high-tech.
Pace: Mostly the pace requirement for these types of projects is regular, because it is done internal and the necessity for it to be done right is greater than for it to be done quickly. But the projects, like the one mentioned before, where you have to prepare a stage show, the pace level will instead be time critical.
2.2.4 Scientific research projects
As mentioned before the pure scientific research project is a special case of projects. The only dimension you are certain to map a scientific research project in the NCTP model is in the novelty, where it will be breakthrough, since it is projects that try to expand the human knowledge as it is known.
Since these kinds of projects will always be breakthrough at its novelty there is no tailored way to do it, so the other three dimensions (complexity, technology and pace) can vary through all the levels there are, all depending on what the research is about and who is conducting them.
2.3 Project risk
Project risk has its birth in the uncertainty that is in all projects. Project risk is an uncertain occasion or condition that has an effect on at least one of the project objectives if it occurs. Objectives can be defined as the three project objectives in figure 112 time, budget and quality. Project risks are always in the future, can occur at any stage in the project life cycle and may manifest it selves without warning. It may have more than one reason for occurring and if it does it may have more than one impact on the project.13
Project risks can be classified, like the classifying of project types, in many different ways, all depending how specific you want the definition to be. It can be categorised by which of the project
12 Page 9 13
19 objections (time, budget and quality) it has an impact on, the reason that there are a risk, if the risk occurs how severe the impact is and etc.
For helping to understand what kinds of risks that can be associated with project, and to help identifying the risk for a certain project the categories of risk are defined as below.14
• External risks: risk that is associated outside of the organisation. It involves laws, cultural difference, customers and competitors.
• Financial risks: monetary risks. Risk about inflation, costs, income, budget and currency exchange rate.
• Environmental risks: concerning risks about the weather, nature disasters and, if the project must be conducted a certain location, the conditions of that location.
• Organizational risks: related to the management of the organisation. It involves risk about communication, leadership, the structure of the organisation.
• Resource risks: risks concerning the capacity of the company. It involves the employees and their competences, material, equipment and facilities and the quality of it.
• Operational risks: risk from the plan and execution of the project. It can be about breakdown of key equipment or change in the work requirement and specification.
All risk, if they occur, will have an effect on the objectives of the project, i.e. time, budget and quality, in some way.
2.3.1 Industrial projects risks
The industrial project is fairly easy to plan because it is craftsmanship and fundamentally the same work that is being done in every project, a certain firm is planning and executing. That also means that the risks involved in industrial projects are easier to predict and then plan for than many other projects. But since the project work often are being done with heavy machinery or high above the ground the risk can, if they occur be severe. Those kinds of risks that threaten the safety of the employees will always be most important to plan for avoidance, if you can not guarantee for the safety of the employees, the project should not be initiated.
20 Other more uncertain risks can be bad weather or even natural disasters, depending on where the project is being performed, material shortage, labour disputes or design errors.15
2.3.2 Manufacturing projects risks
The risk in the manufacturing projects may also have large risk for the safety of the employees since they may also require some big machinery. Otherwise the projects with the system or array complexity will have many organisational or operational risks because when many subsystems will have to work together on a project and if there are many, more or less independent, divisions in a organisation that are involved in the project the possibility of error are greater.
When doing a research and development project they are initiated because there is an opportunity but where there are opportunities there will also be risk, and when you are exploring relatively new and unknown territory there will often be more risks. Furthermore can the time frame be important in the research and development projects because of the risk that a competitor will develop a similar product.
2.3.3 Management project risks
If a there is a project involving management change or implementing a new IT system in a company it can easily affect the entire company and therefore also have a potential effect on every action the company takes. So the type of risks can range from most of the categorised risks mentioned, but the most common will probably be the organisation risk as it is related to the management style of the company.
If it is an internal project, e.g. implementing a new and better IT system, the time may not be the big concern since the organisation already have an IT system they are using, so they can take their time and do it so they may avoid some risks.
IT projects are somewhat especially difficult to stay within the budget. Some records are: 50% overrun their budget, only 18% of software projects are completed within budget and 30% are so
15
21 expensive that are abandoned before they are completed.16
2.3.4 Scientific research project risks
Scientific research projects are the type of projects that has the most uncertainty in it because you do not know exactly what the end result will be. Therefore the number of risk will be more
numerous than in other types of projects, and furthermore the risk will be more difficult to predict. These kinds of projects are very difficult to plan and are the kind of projects where the objectives of time, budget and quality is the vaguest.
16
22
3. Project risk management
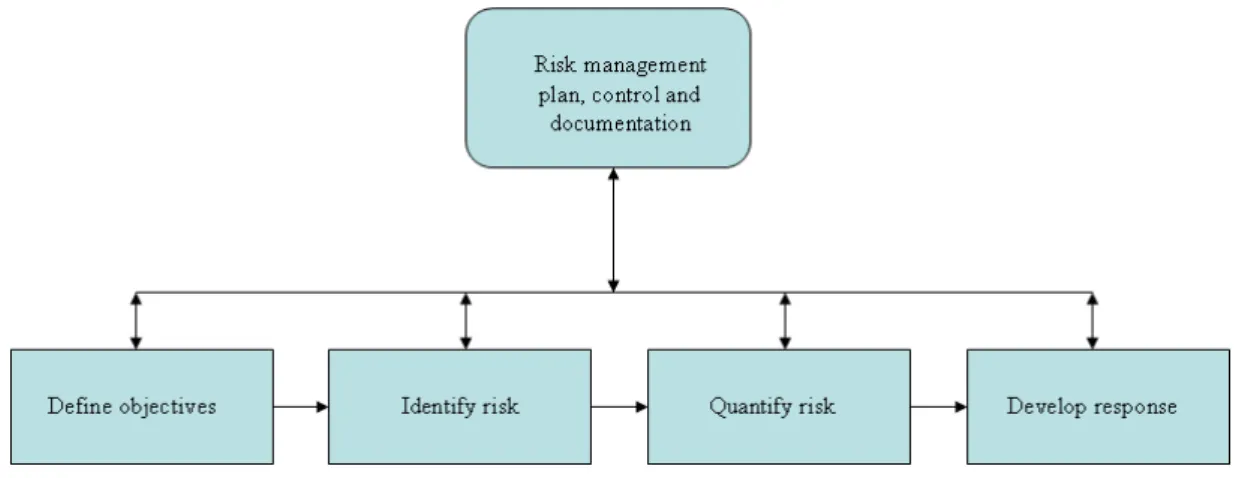
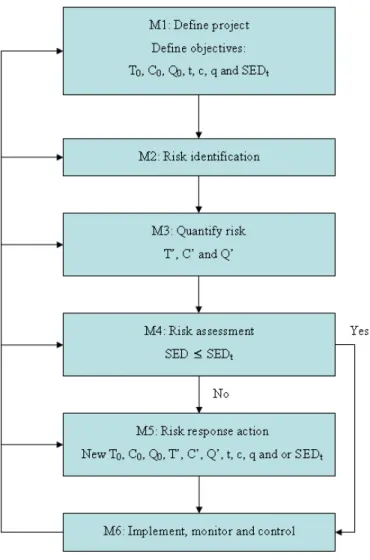
It has been established that there will be risk in a project that will need attention, and it is done by risk management. There are many ways to confront the risks, but one of the more generally accepted structured risk management model, is the one that is pictured in the figure 5.17
Figure 5 – Model for risk analysis
Risk management plan: It is a formal approach for a systematic process of identifying, analysing and responding to project risks. So the risk management plan will document how you suggest dealing with the risk on your project.
Risk control is a part of the risk management plan. Since the risk and work environment may constantly change it is important that you continually monitor and review the level of risk and the capability to effectively respond to the risk. That makes the risk management plan an ongoing process that can be subdivided as listed below.
1. Define objectives: Define the context of the work and the plan for success. This defines what will have to be achieved and establishes a basis for what will have to be done for dealing with the risks. The elements in this part of the plan are basically the context of the 5x5 model in figure 2.18
2. Identify risk: Identify areas of risk, uncertainty and constraints that may affect your project
17
Burke p. 252-269
23 and limit or prevent you for achieving your objectives.
3. Assess risk: Evaluate the identified risks and prioritise the level risk and uncertainty and then quantify the rate of occurrence and impact.
4. Develop response: Define what the responses to the identified and assessed risk are going to be.
3.1 Define objectives
As risk may be defined as any event or constraint that can prevent you from the projects goal and objectives, there is a need to define these goals and objectives in details and make and make them transparent as the first step of risk management for later to be able to identify the risks.
Most obvious is it to define the end result you are going for, what service or product is it you are providing through the project. Next is to define what will make the project a success, here will be natural to include the objectives, and define what the success rate is when looking on the quality, costs and time. To get a more complete overview of the organisation and project objectives you can subdivide different areas of the project and organisation where you will be able to define more specifically by using different techniques.
3.1.1 Feasibility study
A feasibility study should be made which is an initial to determine whether the project is feasible and making sure the company’s resources are used in the best way. The feasibility study is to be treated as a pre-project and should at least include19:
• Stakeholder analysis: People and organisations that in some way are involved in the project or can affect the outcome, e.g. customers, project team, legal requirements and sub-contractors.
• Define the client’s needs: The goal of the project needs to be defined properly, so the product or service is what the customer has requested. It also involves aiding the client
19
24 with the viability of the proposal, so that the end result will be satisfactory.
• Evaluate constraints: The constraints that may be at the project. E.g. is the product possible to make, does the company have the technology, and does the company have the economic to take on the project?
• Cost-benefit analysis: To determine if the project is profitable by weighting the costs and benefits in money terms.
3.1.2 Work Breakdown Structure
The work breakdown structure (WBS) is basically a product oriented family tree, from the final product or system at the top level through subsystems, components, hardware, data and services that are used to produce the end product. Therefore the WBS has the advantage of identifying every part used in all the subsystems. The WBS is an important element since it is providing a general
framework for the entire planning of the project and thus for the risk management. 20
The WBS is typically divided into 5 levels21:
1. Is the entire project and what the end product will be.
2. Consists of sub-projects, that combined gives the end product 3. Are the tasks that the sub-projects can be broken in to.
4. The tasks can further be broken in to sub-tasks.
5. The sub-tasks are consisting of low-level tasks, which are called work-packages.
20 Lanford 21
25
Figure 6 – Example of Work Breakdown Structure and Organisational Breakdown structure
In figure 6 is an example of a part of a work breakdown structure. The top three levels are called the managerial levels and are normally customer specified understood in that way that it is constructed after what the customer wants. The top three levels are also useful for e.g. for budgeting and schedule making.
The level 5 work packages are a term that is used to identify discrete tasks that have a definable end result. It describes the work that has to be accomplished, and are used for monitoring and reporting progress of the work. As it is seen in figure 6 the work packages are linked with a part of the functional organisations where it is being carried out, also called a organizational breakdown structure (OBS), which means that the actual management may be performed by line managers which further means that the communication in the organisation needs to function so reporting to manger of the higher level of WBS will be provided. The OBS is a hierarchically organisation illustration made so you can relate the work packages to a part of the organisation. That way it can make a base to define the responsibilities, cost reporting, billing, budget and project control.
26
3.1.3 Critical Path Method
When it comes to the time objective it is important to schedule all the work, and a tool to help doing that is the critical path method (CPM). The critical path is the longest path of activities planned in a project, and further it calculates what the earliest and latest every activity can start and finish, within the time of the critical path and without the project being delayed. So with the CPM you determine what activities that is critical and which that can be delayed without making the project longer and you find out what the shortest time possible is for the project. Any delay on an activity in the critical path will give a delay on the overall project so you will have to pay extra attention on those activities, but still you cannot just neglect the other activities. It can be paths that run parallel to the critical path that has the potential to be longer due to delays. 22
A technique for CPM is to list all the activities required to complete the project, the time duration it takes to complete each activity and how the activities are dependent of each other. For that purpose is the WBS great for.
A CPM schedule needs to be updated continually according with start and end dates and percentage of process completion, reflecting to delays, order change, etc.23
To use the CPM and schedule bar charts prober you need to have some estimated times that you can follow, and the formula below is for that.
That can be helped with be schedule bar chart (or the Gantt chart) where you give each activity a bar on a chart with a timeline on it when it starts and ends, and so you can follow it progress and constantly updating it.
( 4)
6
p o ml
T T T
T = + + ×
T = The estimated time
Tml = Most likely estimate: The time you would you would estimate it would take knowing what
you know at the time.
To = Optimistic estimate: The time it would take if everything went right.
Tp = Pessimistic estimate: The time it would take if everything went wrong.
22
Wallwork
27 Of course the time estimation can change after you have made risk assessment, to again make it clear that it is a constant process.24
3.1.4 Budget
To be able to control the costs of a project, a budget will need to be made. The first step is to divide the project in to cost relevant tasks, which already is the case if a WBS has been made, that is the work packages. The work packages are connected to cost accounts where direct labour, material and other direct costs are compared with the actual work performed for management control purposes. There may be several work packages grouped together for a cost account for cost purposes, e.g. if the same resource is used in different work packages.25
The next step is to calculate the cost for each level on the WBS, where the duration of the task is taken in account, with start and end date, the cost the task will consume and how it is calculated, so there will be an budget estimation all the way up to the total project, that way you can have an overview of the entire project costs in every level, and that is flexible to schedule changes. To do this historical data, cash-flow statement, forecasting and CPM with bar chart schedule can be used.26
3.1.5 Quality plan and control
Good quality is defined by the customer and may not be a constant measurement, and mostly quality improvement is a constant process, where you aim to be better. Planning quality for a project is a process of identifying quality requirements and standards for the product and project and document how it will be done.
To plan the good quality you make a cost-benefit analysis, where you compare the cost of the
24 McGhee p. 145 - 146 25 Kerzner p. 806 26
28 quality to the benefit. There you can look at the cost of quality where you distinguish between cost of conformance, which is money spend during the project to avoid failures, and cost of
non-conformance, which is money spend during and after the project because of failures.
Other tools for planning good quality could e.g. be benchmarking or control charts (like 6-sigma), but it can be difficult if it is a unique project that does not have some comparable standards.27
In the end it should give a quality plan that has objective which is implementable, understandable, with defined goals and deadlines. The control also need to be defined, as what needs to be
controlled, what the standards for correction is , what measurement methods that is used and make sure that the actual results are compared with the quality standards. In all the quality plan will identify all of the organisations external and internal suppliers, design processes after the what the customer wants of the product, be able to response to customer needs and aspire to reach the goals.28
3.1.6 Communication plan
Communication is important for a project to function. Bad communication can lead to problem as delay on messages, sensitive information leaked to the wrong people or lack of information to those who need it. Effective communication means that the information is given to the right people, at the right time, with the right format and with the right impact.
To help make a communication plan the WBS and OBS can be used to identify the channels and how many that is involved in the project, and define the responsibility of the organisation. Further find out what is needed for the internal communication (e.g. across the organisation) and for the external communication (e.g. media, contractor or the public).29
3.1.7 Procurement Plan 27 PMBOK p. 196 - 198 28 Kerzner p. 1052 - 1054 29 PMBOK p. 243, 252 - 256
29 There might need to be purchased products or services from outside to complete the project, so there need to be a clear plan to do that. The plan involves selecting a seller, place responsibility of purchasing and making of a contract, that include administrating the obligations and eventual requirement of change.
When selecting a seller a make-or-buy analysis has to be made, to determine whether or not it can be made in the project, if not it further has to be decided if it should/can be purchased in another part of the organisation.
Other things to help make the procurement plan is, cost estimation, budget, requirement plan of the project, project schedule etc.30
3.2 Risk identification
The risk identification establishes which risks might affect the project and register what their characteristics are and in what way they might affect the project. The risk identification might be the most important step in the project risk analysis, meant in that way that if the risk is not identified you will not be prepared should it occur. So a risk response can only be planned if the risk is known. That is also the reason for the importance of doing the preliminary work properly, in form of defining the objectives, so it is possible to identify the risks and how and where they will occur in the project. The risk identification is a repeated process since risks may evolve or be discovered through the life cycle of the project. In the next step it is the identified risk that will be used to the risk assessment.
There are a lot of techniques to identify risks, but there is not a recognised best method and none of the techniques are perfect, and an appropriate mix of the techniques will have to be used depending of the project. The risk identification techniques include historical data, brainstorming, workshops, checklists, nominal group technique, Delphi technique, cause-effect-diagrams.31
30 PMBOK p. 315 - 321 31
30
3.2.1 Identification by risk analyst
Risk identification by the risk analyst is where the identification is solely done by the risk analyst, or a small risk analysing team and it is done by what ever information the risk analyst can gather by him selves and those techniques he got.
Experience from other projects where the same risk has occurred or otherwise had been assessed is a great way to identify risks. Especially if the project is similar to the current project then there will be an even better opportunity to manage the risks, through experience of previous successes and mistakes. There is a good opportunity to improve through each project completed.32
When risks are identified they should be placed in the project risk register which is a document of risks that might occur. The risk register should include a list of defined binary events, which will or will not occur with a disadvantage for the project, and also the affect of the event will have to be documented there. Further it also includes what actions there will be made to prevent the risk from occurring, this will of course happen after the identified risks have been analysed.
But if it should be the case that the organisation has made risk registers from previous projects it is a great tool for collecting data for the risk identification of a current and future projects.33
Another technique, related to the risk register, is the checklists where you structured work through all of your processes to identify any risk that might occur. For this it is especially important that the ground work for defining the objectives has been done thorough. With proper WBS, OBS, budgets etc. this method is effective for risk identification through the entire project.34
3.2.2 Risk identification by work group
A work group for identifying risks is led by a responsible risk analyst and is aid to identify risks with supplementary tools and techniques.
You can get information from many different people such as the project manager, different
32 Flouris p. 54 - 55 33 Williams
34
31 appropriate project team members, risk management team, experts of project risk management, which may or may not be involved in the project, customers or the end users.35
Some of the above mentioned people, such as end users, project team members and customers, can provide their information through structured questionnaires or structured interviews, which can be processed to identify risks.
3.2.2.1 Brainstorming
Brainstorming is an effective technique to identify risks, where a select group is getting the freedom of imagination to come up with every likely (or maybe even unlikely) risk they can think of. The ideas will then have to be sorted or review for further development. The identified risk will have to be described with course of impact and the affect on the project, so it later will be able to be
documented in the risk register.36
The brainstorming is based on that there will be a synergy effect, where group thinking is more productive than individual thinking, where ideas can be combined or further build by others. The brainstorming is also based on that avoidance of criticism improves the production of ideas, whereas more ideas gives a higher chance of being useful ones and with no criticism people are encouraged to think more out of the box, which may give new discoveries.37
A SWOT analysis is a good way to identify the internal weaknesses and external threats of the organisation that can lead to risks for the project, and may well be combined with a brainstorming group.
3.2.2.2 Nominal group technique
The nominal group technique (NGT) could be classified as a kind of brainstorming technique,
35 Mojtahedi 36 Flouris p. 55 37
32 where people in an assembled group individually in silence write down what they see as potential risks. After that each person briefly presents in turn their ideas until none in the group has any more ideas. After that each potential risk will be discussed and all the group members rank the risks, which in the end will give an aggregated risk evaluation.
In comparison to brainstorming the NGT is more structured and does not have the risk of be dominated by few individuals and therefore there is an opportunity that the number of ideas, numbers of unique ideas and the quality of ideas is to be better.38
3.2.2.3 Delphi Technique
The Delphi technique is a method for systematic collection and collation of judgement from
isolated suitable individuals on a specific topic. It is done through carefully designed questionnaires with sections for summaries and feedback from earlier responses. The Delphi technique is done over at least two rounds where the participants get the chance to revise their opinion, through the answers from the earlier questionnaire. After each round the estimates for the variables are collected and summarised along with reason for the estimation. The rounds continue until the estimates stabilises.39
Before risks can get estimated values, there need to be some risks to value. One way is to conduct an initial risk identification and bring those risks in the questionnaires, or you can through the first round have the participants discover the risk factors themselves, and maybe supplement with own identified risks. After the first round the risk factors are being summarised with description and participants comments for the second round, where the participants will evaluate the risk factors of importance. The next rounds are the rounds to validate the evaluated risks of comments and average ratings from the second round of questionnaires which in the end should give a stable result.40
The advantage of the Delphi technique is that you are able to use external expert in any location and
38 Chapman, Robert J 39 Chapman, Robert J 40
33 like NGT no one will dominate the discussion or be bullied. The downside on the other side is the lack of opportunity to clarification on the feedback and there can be conflicting or incompatible ideas from the feedback.
3.2.2.4 Brainstorm, NGT and Delphi technique
What to choose of the three group techniques are depending on the organisation structure and the nature of the project. The brainstorming is probably the most used of the three, but does lack the benefits from a more structured method, regarding giving space to every aspect of project. The NGT will be the best structured method, and has the best opportunities for discussion to get every aspect of the risks. If the risk identification and assessment process needs external experts the necessity will be for the Delphi technique.
3.2.3 Cause-and-effect diagrams
The cause-and-effect diagram is a good technique to identify the source of the risks which later can be used to determine what and where your response should be conducted. And it is especially good for making an overview for risk which can be triggered by more than one cause.
The technique is done by working backwards from the risk. The first step is to decide the risk that you want to control or otherwise do something about. The second step is to identify the main factors which might make the risk occur. The next step is to identify more detailed from the main factors what could be regarded as the cause for the risk, and if possible continue to the next step to make the cause even more detailed, and go on until the cause is as detailed as possible.
When illustrated it is drawn as a diagram of branches as in the figure 7, where the risk is that a staff member might leave, the main factors could be satisfaction, remuneration, environment or career prospects. The diagram then gets more branches until the causes are detailed satisfactory.41
41
34
Figure 7 – Example of cause-and-effect diagram
Another way to use the cause-and-effect diagram is to identify the risks and causes for the risks through the entire project process, where you will identify risks and causes according to which process stage it might occur in. That way it gives an understanding of when and where the risk might occur.
A further way to use the cause-and-effect diagram is to determine risk correlation. It can be that different risks might occur at the same time and even produce a synergy effect or one risk might give birth to another risk if it occurred. The cause-and-effect diagram can then clarify what connection there might be between risks.
3.2.4 Risk breakdown structure
The risk breakdown structure (RBS) is a hierarchically organized depiction of the identified project risks arranged by category and a way to provide risk data in structured and organised way to help understanding, communication and management. In figure 8 is a small example of RBS where the top level represents the total risk exposed to the project, level 1 divides the risks in to the
categorised risk defined in chapter 2.342, and each descending level represents an increasingly described definition of source of risk to the project.43
42
Page 19
35
Figure 8 - Example of risk breakdown structure
The RBS can be used for risk identification as a helping tool for some of the other techniques mentioned before so all risk areas will be covered.
For the NGT, Delphi technique and brainstorming the RBS can be used to give a structured encouragement for the participants to identify risk under the different areas of the RBS. The same way it can be used for structuring interviews and questionnaires by providing an agenda for discussion and questions. Further it can be used for creating a risk identification checklist with some generic risks from the lowest levels of the RBS based on previous experiences.
The above techniques and people that should be involved can be mixed in different ways, and it depends on the composure of the organisation and project, and what type of product and project that is involved.
3.2.5 Risk register
Risk registers from earlier projects has already been mentioned to be helpful when identifying risks in new projects. When the risks have been recognised it will be documented in the risk register where it is described as detailed as reasonable with what the nature of the risk are and what the event of the risk might be. When the analysis is progressing the risk register will be updated until it is completed with impact: which objectives, time, budget or quality, the risk will affect on
occurrence and severity of the impact. Responses: which actions that can be taken to reduce the probability of the risk occurring, which actions that must be taken, should the risk occur and
36 possibly the degree of risk that can be transferred.
The risk register has two main functions. First it is a collection of knowledge that should give a good overview of the risks. Second it is to initiate the further analysis, assessing and planning through the data from the risk register.44
3.3 Qualitative and quantitative risk analysis
For filling the information on impact in the risk register the risk will be analysed by qualification and quantification.
Qualitative risk analysis is the process of prioritising the risks by assessing the probability of occurrence and impact.
The quantitative risk analysis is the process of numerically analysing the effect of the identified risks on the projects objectives.45
3.3.1 Qualitative risk analysis methods
The risk probability assessment is the investigation on the likelihood that each risk will occur and the risk impact assessment is the investigation of the effect from each risk on the objectives or the safety.
The risk probability of each risk will be assessed by the historical data or otherwise experts on the field and in the same way the risk impact will be assessed by expert on the field through meetings and interviews where explanatory details and justification assumed for the assessment also will be recorded.46
The project risks can be divided to recurring risks and non-recurring risks. The recurring risks are risks that recur on regular basis, so there might be statistical data available, e.g. how big the
44 Williams 45 PMBOK p. 54 46
37 probability for bad weather is and how many days will be lost because of the bad weather. With the recurring risks a more objective analysis can be made, where the non-recurring risks will need a more subjective analysis, because there will be no historical data to back it up.47
3.3.1.1 Probability and impact matrix
The priority of the identified risks can be determined by combining the probability of risk and the impact on the risk.
Risk rating = risk probability * risk impact
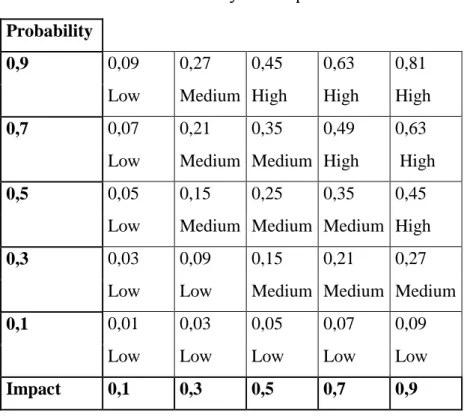
Table 1 – Probability and impact matrix
Probability
0,9 0,09 0,27 0,45 0,63 0,81
Low Medium High High High
0,7 0,07 0,21 0,35 0,49 0,63
Low Medium Medium High High
0,5 0,05 0,15 0,25 0,35 0,45
Low Medium Medium Medium High
0,3 0,03 0,09 0,15 0,21 0,27
Low Low Medium Medium Medium
0,1 0,01 0,03 0,05 0,07 0,09
Low Low Low Low Low
Impact 0,1 0,3 0,5 0,7 0,9
With the risk rating a probability and impact matrix, like the example on table 1, can be made to determine the importance of the rated risks, so the risk will get the ranking of low, medium or high
47
38 importance and priority.
The risk ranking helps when further analysing and responses has to be made, to determine that the high ranked risks requires priority action and aggressive responses, whereas the medium and low ranked risks might be put at a monitoring list. That a risk is ranked as low does not necessarily mean that no action will be made towards it. If the probability for the risk to occur is small but the impact is high (or the other way around) the need for response can be there. For instance if a project is done close to a volcano, there is only a small risk that the volcano will erupt, but if it does the consequences will be severe, so a response plan has to be made ready, if it should occur.48
3.3.2 Quantitative risk analysing method
The quantitative risk analysing is performed on the risks that are prioritised from the qualitative risk analysis and is the process that analyse the numerically effect of the identified risks impact on the overall objectives. The numerically effect could be measured in monetary value, for the effect on the cost objectives, and with time (hours, days, weeks etc.). What is more difficult is to quantify quality, since quality is more relative and subjective. Some risk might also correlate on the impact on the objectives, if the time schedule is exceeded then it might cost more, and if a quality control is not accepted it might take longer and cost more to fix it, etc., so one risk might affect all of the objectives.
3.3.2.1 Quality risk quantification
A quality measurement will have to be agreed upon, and the most naturally is to take the customers product demand as a basis, which again makes it important that you get a detailed description of all of the customer’s demands for the product. In addition the organisation can have its own quality policy, which it is branding it selves on, that needs to be taken in consideration, e.g. some design requirements or that the product has to be co2 neutral. The last comparison option for the quality measurement is the historical data from earlier quality measurements done in similar project, or where similar resources had been used.
48
39 The resources, components used in the project, or the entire end product of the project can be
measured on the durability, e.g. how many miles can the tire go before it is worn down, how many tons can the material hold or the top speed of a vehicle. The quality may also be binary, like either there is used child labour or there are not. The risk impact on the quality measurement will be relatively compared to the customers demand, organisational standards and the historical data. The quality is the objective that is most difficult to slack on, because the company needs to provide a product in terms of the contract and further it will put the company in a bad light if it is
compromising on it values.
To assess all risks impact on the objective of quality the quantity value needs to be the same for all of the risks, so incompatible values are not used to determine the same objective. So the first step is to determine what the value for measurement should be, it could be monetary where the quality gets a monetary value and the risk impact will do a change in the value should it occur. The quantified value will be more subjectively than the impact on cost and time, but I should still take into consideration that the customer would think the value of the quality is and second what the organisation think the value of the quality is.
Some have defines quality as a ratio based on W. Edward Demings philosophy of quality in the following equation:
Result of work efforts Quality
Total costs =
Based on the ratio above the idea is that when focusing primarily on quality the costs decline and the quality will improve over time, otherwise if the focus is primarily on the costs, the costs tends to rise and the quality declines over time.
Statistics can be used for the quality control, where the output and controllable input of processes are being measured, evaluated, monitored and controlled for the purpose of improving.49
49
Montgomery p. 11
Six sigma is a statistical way of ensure constancy of the quality. The purpose of six sigma is to reduce the
40 variance of the processes and in that way give a steady production. When a company is six sigma capable it means that probability of falling within +/- 6 standard deviations of the mean of the measurement is 0.9999966.50
3.3.2.2 Quantify safety risk
The risks that threaten the safety of an employee should have the most attention and highest priority. Even though there can be done a lot to prevent the accident there will always be a risk of accidents, especially at the industrial projects. The Tye-Pearson’s principle says that accidents can be categorised in fatal/serious injury, minor injury, first aid treatment injury, property damage injury and near misses (non injury/damage incidents), with a respectively distribution of 1, 3, 50, 80 and 400, 51 as it is also illustrated in figure 9.
Figure 9 – Tye-Persons’ principle
But as such accident is not fixed the risks that threaten peoples safety should still be identified and quantified for the purpose of reducing them. To quantify the safety risks the risks must have a relative numeric value that represent the seriousness of the occurrences of the risk.
50 Yang p. 21-22 51
41
3.3.2.3 Estimation, probability and expected value
The impact of a risk can be estimated similar to the way the time estimation was made in chapter 3.1.352, where the impact will range between pessimistic, most likely and optimistic, that will give an expected value for the risk impacts. The estimation can be made from historical data, experience and interviewing experts in the matter and can additionally be integrated in the budget and the scheduling.53
With further using the probability of occurrence and the impact estimation a proper distribution, with the relative likelihood of the risk and the value of time or cost, can be applied to each risk and through modelling or simulation measured in time or money an aggregated estimation of the risk impacts can be made. If historical data is available a fitting distribution system is possible, where a distribution that best fits the existing data are made. Otherwise a distribution will subjectively be made after what characterises the risk variables.54 Risk distributions can be:
• Normal distribution: Is a distribution that can describe many natural phenomena and is important because it is the distribution that a Monte Carlo simulation55
• Binomial distribution: Either the risk occurs or it does not, and if it does it has a fixed impact.
will approximate. The mean is the most likely value, and the distribution is symmetrically around the mean, so the probability of the value being higher is the same as being lower, and the variable has a higher probability of being in the vicinity of the mean than further away.
• Lognormal distribution: Is a distribution that is positively skewed, that can mean that the probability of the risk impact are smaller the higher the impact might be. The uncertain values can increase without limits but can not fall below zero which is what makes it good for simulating risks.
• Uniform distribution: The probability for each outcome between a maximum and minimum of impact are the same, so risk occurrence with different impact has the same 52 Page 26 53 PMBOK p. 296 54 Mun p.108 - 128
42 likelihood of happening.
• Triangular distribution: Is a distribution where the minimum, maximum and the most likely value to occur is known. It is like the optimistic, pessimistic and most likely value of impact that is used for estimation.
• Hypergeometric distribution: Is for risk that might occur more times during performance of a certain event the project. The risk will change the probability of occurring during the performance of the certain event, depending on what the last outcome was. If the risk occurred during the last performed event, then the probability of it occurring in the next will be lower, but not impossible.
• Poisson distribution: Describes the number of times the risk occur in a given interval, could be a process or the entire project, the impact must of course be fixed per occurrence, so it can be implemented in the model.
• Beta distribution: Is very flexible and often used as distributing risks. It is used to represent the uncertainty in the probability of occurrence of the risk and further used to predict
random behaviour. More important it is used as a conjugate distribution for the binary distribution.
• Extreme value distribution: Is used to describe the largest value of response over a period of time, e.g. rainfall or earthquake.
3.3.2.4 Simulation Modelling
When using an iterative simulation it is often the Monte Carlo technique that is used with a software programme. The simulation is done by a model where the input is the possible risks with an
appropriate distribution. The model random generate a value for the risk and aggregate them if more than one risk is included in the model, the simulation is computed many times, so it is a
deterministic, and the output is then a distribution of the total cost, time or what measurement is used for quality or safety of the risk(s).
The output distribution can be used to supplement the budget and the schedule durations, so there will be a higher probability of staying within the project objectives.
43 deviation etc. are assessed. The simulation can provide a forecast chart with a histogram, with the output illustrated with probability or likelihood of different outcomes, it can be used to make confidence intervals, where you determine the probability is that the project will be to stay within the objectives and what the time schedule or the budgeted cost should be to have a certain
likelihood to stay within the objectives.
Another output from the simulation is the sensitivity analysis. The sensitivity analysis shows the relative relationship with of an output of the forecast and the variation of the input of the model. It helps to see which risk has the most impact on the project, by examining the element affect on the objective that is being measured, while the other elements are being held steady. This helps identify the key sources of variations and what the variations might do.56
The strength of the Monte Carlo method is that all kinds of probability of distribution can be used and that complex systems with some extend of correlations can be modelled. Also there are many types of software to compute Monte Carlo simulations, so it is relatively easy to implement. The weaknesses of the Monte Carlo method is that the output from the simulation is not stronger than the input, so if the data used are poor then will the analysis to be poor. That is why the needs for high data availability is great, so the data can be as complete as possible and that is why there has to be an expert judgement to avoid misguiding observations or errors. 57
3.4 Risk assessment
The risk assessment is making a decision of what to do with the risk and the project. The decision can be that the current level of risk are so small that no further actions are necessary to make the project work, the decision could be to develop responses to the risks and the last and most extreme decision could be to stop the project because the risks are too great.
If risk responses have been developed, the risks should again be qualified, quantified and assessed, and risks responses should at least be performed once before the final decision, on whether to carry out the project or stop it, are made.
56 Emmet 57
44
3.4.1 Scope Expected Deviation
The scope expected deviation (SED) is an index to measure the deviation caused by the quantified risks on the planned costs, time and quality.58
The SED can be done individually on the three objectives or it can be done for the entire project scope:
SEDTime = 100 * 0 T' T SEDQuality = 100 * 0 Q' Q SEDCost = 100 * 0 C' C
T0 = The project aim on time
T’ = The additional project time from risk Q0 = The target quality for the project output
Q’ = The quality deterioration causes by risk (will have to be quantified as a positive value) C0 = The approved budgeted cost of the project
C’ = The additional cost from risk
The SED for each of the objectives is basically for seeing how many percent the objective are exceeded by because of the identified risks.
SEDProject = 100 * 0 0 0 T' Q' C' t * q * c * T Q C + + Where t + q + c = 1:
t = The weighted coefficient of the project time q = The weighted coefficient of the project quality
58
45 c = The weighted coefficient of the project cost
The parameters c, q and t are subjectively decided depending on the objectives importance for the project. The guidance for the deciding the coefficients can be done with pairwise comparison, which is done by taking two of the objectives at a time and weighing them against each other to decide which is the most important. So whether the project is time, cost or quality bound it can determine the how the coefficients are weighted.
The SED can be made on the different levels of the WBS, from the entire project down to each work packages, depending on how the organisation structure is and the complexity of the project. The SED provides an index for measurement of deviation, and decision concerning the next step of action for the project, and can be made by comparing the actual SED, by the desired SED that in advance has been made for an accepted deviation.
Further the SED can be used for evaluate the project after it is finished, by seeing how well the objectives have been fulfilled.
3.5 Risk response action
The risk response action is the step in the process that concern searching and classifying the responses for each identified source of risk. Identifying a response to a risk may very well be a simple task, but the most easily and logically identifiably responses are not necessarily also the most effective responses against a risk. To get the best response for a risk, examination of several possible responses will have to be made.59
Events that have a risk on employee’s safety will always need a respond, because the safety of people will always be the most important, so any respond that can improve the safety should be conducted.
The identification and assessment for responses can be conducted in a similar way as the identification and assessment for risks, where experts and teams will identify possible responses for each risk, possibly through TNG, brainstorming and Delphi technique. The assessment for the responses will be done quantitative where a new SED with responses are made and compared with the previous SED.
59