Research Article
ISSN 2277 - 4106
© 2013 INPRESSCO. All Rights Reserved. Available at http://inpressco.com/category/ijcet
Design a Distributed Data Warehousing based ROLAP with Materialized Views
Akeela M. Al-AtroshiȦ* and Fared Mahmood AbdullahḂȦ
Department of Computer Science, Faculty of Science, University of Dohuk
Ḃ
Department of Computer Science, Institute of Science Dohuk Accepted 25 November 2013, Available online 01 December 2013, Vol.3, No.5 (December 2013)
Abstract
In today’s highly competitive business, data became strategic resources. Business companies dealing with a huge and growing amounts of data in different database formats. whether these companies need to understand the effectiveness of their marketing efforts and quickly maintain the large volumes of data created each day. These challenges require a well-defined database system and data warehouse that can bring together disparate data with different dimensionality and granularity. The aim of this study is to design distributed data warehouse based on relational OLAP with materialize views for the purposes of analysis. In order to achieve this objective, the current study adopted a case study approach, including the application of the proposed system in General Company for the pharmaceutical industry. The study came out a set of conclusions of the most important is Data warehouse considered the most suited approach of Information Integration to build a Decision Support System for the business intelligence scenario. The implementation shows that the system proposed provides the effective tools to retrieve data through the: generate reports or query the data on line, and building data cube.
Keywords: Distributed data warehouse, Materialize views , ROLAP, Rollup and Drill down, Slice and Dice operations.
1. Introduction
1 A data warehouse is a large repository of historical data
that can be integrated for decision support. The use of a data warehouse is markedly different from the use of operational systems. Operational database contain the data required for the day-to-day operations of an organization. This operational data tends to change quickly and constantly. The table sizes in operational systems are kept manageably small by periodically purging old data. The data warehouse, by contrast, periodically receives historical data in batches, and grows over time [Griesemer,2009; Malinowski,2008].
OLAP is a term that describes a technology that uses a multi-dimensional view of aggregate data to provide quick access to strategic information for the purposes of advanced analysis . OLAP supports queries and data analysis on aggregated databases built in data warehouses. It is a system for collecting, managing, processing and presenting multidimensional data for analysis and management purposes. There are two main implementation methods to support OLAP applications: relational OLAP(ROLAP) and multidimensional OLAP (MOLAP) [Wang,2006;Hwan,2007].
When a Business is distributed geographically or over multiple differing product lines, information is needed at the level of corporate management are met by a central
* Corresponding author: Prof. Dr.Akeela M. Al-Atroshi
data warehouse where information is gathered. But there is also a need for data at each location of the organization or need a separate data warehouse . For that, a distributed data warehouse is required at the level of the factory [Inmon,2005].
In the same context, the main problem of the current research revolves around the absence of application of information technology represented by the operational databases and data warehouses as well as to retain the data for long times in industry. Also, its well-known among software engineers that MOLAP applications require a lot of memory as the cube size increases, such as increasing in the number of dimensions, or increasing in the cardinality of the dimensions, or increasing in the amount of data or a combination of some or all these aspects. Therefore the study adopted ROLAP with materialized views to query the relational database especially that the applied environment of this study deals with large-scale database.
Similarly, That for, the Main objective of this research is to design a Distributed data warehouse based on relational OLAP with materialized views. So, in order to achieve the main objective, there are some sub objective which have to be done:
o Designing an operational database to store data for all the daily activities of the company and become the most important internal sources for the data warehouse.
o Using ROLAP with materialized view to speed up data retrieval and making the time of query close to the (Near real time) .
o Reducing storage space, using (Views in the stage area) instead of storing data in tables.
2. Distributed data warehouse concepts
The cornerstone of all Enterprise activities is information processing. This includes data collection, storage, transportation, manipulation, and retrieval. The importance of good information can be thought of as the difference in value between right decisions and wrong decisions, where decisions are based on that information. The larger the difference between right and wrong decisions, the greater the importance of having good information [ Thomsen,2002]. Since the early 1990s, the data warehouse has become the foundation of advanced decision support applications. Using sophisticated online analytical processing (OLAP) and data mining tools, some corporations are able to exploit insights gained from their data warehouse to significantly increase sales, reduce costs, and offer new and better products or services [Hwan ,2007; Oracle,2009].
A. OLAP approaches
OLAP performs multidimensional analysis of enterprise data and provides the capabilities for complex calculations, trend analysis and very sophisticated data modeling. In addition, OLAP enables end-users to perform ad hoc analysis of data in multiple dimensions, thereby providing the insight and understanding they need for better decision making. An OLAP structure created from the operational data is called an OLAP cube . OLAP cubes are data processing units consisting of the fact and the dimensions from the database[ Noaman ,2000 ]. MOLAP is a multidimensional data storage format that provides a high performance. The data feeding the cubes is kept with MOLAP on the OLAP server as a multidimensional database. MOLAP is a specifically optimized solution for multidimensional data queries and due to this cause-and-effect it gives the best overall query performance. MOLAP is so convenient for small to medium-sized data sets. MOLAP needs copying all data and converts its format conveniently to fit the multidimensional data store. [Shiao,2006].
The ROLAP provides OLAP functionality by using relational databases approach provides the full analytical functionality of OLAP while maintaining openness and scalability .It can handle large amounts of data since no preconsolidation is done. Of course, query performance in ROLAP systems may not be as efficient as in MDDB systems since computation of aggregates from the base data has to be done at query time. But performance can be improved by selectively precomputing certain aggregations and storing them in the warehouse using materialized views. Indexes can be built on these materialized views to improve query performance [ Ault , 2003, Wang, 2006].
B. Data Staging area (ETL)
The extracted data coming from several disparate sources needs to be changed, converted, and made ready in a format that is suitable to be stored for querying and analysis. Three major functions need to be performed for getting the data ready. These three major functions of extraction, transformation, and preparation for loading take place in a staging area [Ponniah , 2007].
Data is extracted from the operational systems by extraction routines. The extracted data is then converted into an intermediate schema and placed in a staging area. The source data accumulated in the staging area is subjected to data cleansing, transformation to the intermediate schema, and data aggregation and finally loaded into fact tables in the data warehouse [ Bhansali , 2010; Kimball , 2004].
Transform application performs all data modifications to the Source Data necessary to conform it to the rules, layout, and format of a data warehouse. The transformed data is also captured on a platform that is controlled by the ETL application. The post-transform data is also captured on a Staging Platform or Staging Environment. In this post-transform state, however, the staged data is called Load Data. A Load application bridges the gap between the ETL and Staging Platforms and the data warehouse platform. A Load application reads the Load Data and performs the necessary inserts, updates, and deletes to a data warehouse. When the Load application has finished, the ETL application has completed. The mission of the ETL team at the highest level is to build the back room of the data warehouse [Kimball, 2004; Silvers ,2008].
C. Distributed Data Warehouses
A distributed database system is one in which data is stored at multiple nodes but all data is accessible to any authorized user. The three types of DDW are as follows: [Inmon ,2005].
o Business is distributed geographically or over multiple, differing product lines. In this case, there is what can be called a local data warehouse and a global data warehouse. The local data warehouse represents data and processing at a remote site, and the global data warehouse represents that part of the business that is integrated across the business.
o The data warehouse environment will hold a lot of data, and the volume of data will be distributed over multiple processors. Logically there is a single data warehouse, but physically there are many data warehouses that are all tightly related but reside on separate processors. This configuration can be called the technologically distributed data warehouse. o The data warehouse environment grows up in an
uncoordinated manner first one data warehouse appears, then another. The lack of coordination of the growth of the different data warehouses is usually a result of political and organizational differences. This case can be called the independently evolving distributed data warehouse.
3. Conceptual Design of Proposed System
The Architecture of proposed system is designed based on three complementary parts of physical design as illustrated in figure (1), . This study has focused on the state company for drug industries and medical appliances in
Ninavah/Iraq as a field for applying the proposed
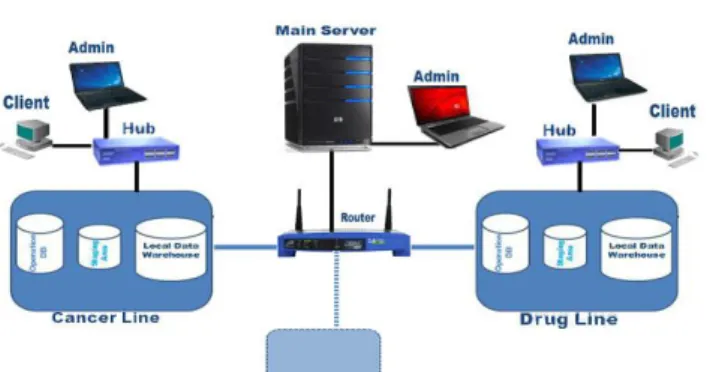
system(2).For that and based on the Inmon strategies, proposed system is designed so that it includes a data warehouse on two levels for each factory(Sub), the other at the firm level includes information on all company units(Main).
The key components of the designed system that deals with homogeneous databases, so all computers that are connected to the network use the same copy of the operating system . The proposed system has a great ability to execute transactions in local sites and globally within the network:
o Local transaction to transform data from operational database to Local Data warehouse .
o Global transaction to transform data from Local Data
warehouse to global data warehouse.
Figure1 Conceptual structure of proposed system
Figure 2 Components of proposed system at level of each side
Moreover, the figure (2) indicates that there is a type of flexibility in adding the sites to the network and the computers to the sites linked to Main Server through the HUB because the system is applied to the LAN network. Therefore, the designed system consists of two separated systems linked through a network, the first level is specified for sites while the second one is specified for main server. It should be noted that the process of
2 Researcher conducted interviews with manager and related engineers of the state
company for drug industries and medical appliances in Ninavah / Iraq
collecting systems that operates in a factory that has single data warehouse and make them deal with a single data warehouse called Bottom Up Design, which the design begins with base and ends with top.
1. Building Operational Database
Database in data warehouse represents a critical part in the architecture of the proposed system in which it is specialized to store large quantities of data up to (Terabyte) and for long periods of time which may exceed 10 years[ Lane,2005].
The operational database are designed according to the rules of the three forms of normalization to eliminate duplicative columns using Oracle 11gR2 , JDeveloper 11g to execute SQL and to create tables, procedures, functions and triggers and (PHP) to design web page and connect with Oracle.
2. Building Local Data Warehouse
The logical design process begins with the analysis of the data source in the warehouse in order to identify clearly the dimensions and the facts contained in the star schema as data model for data warehouse, it is based on this analysis and according to the nature of the supported data the researcher uses one fact table and (7) dimension tables figure(3) explain Star schema of Local site as follows:
Figure 3 Star schema of Local site
A. Fact table : Represents the axis of the star schema, it‟s one of the main tables in the database, this table includes three types of columns, the first type is a foreign key that is used to connect the fact table with the seven dimension tables, by using (THR_ID, SALES_ID) to reset (Two Views), and the others are specialized (sales price and quantity, product cost and quantity) that represent as measures.
B. Dimension tables: often composed of one or more hierarchies that categorize data, the proposed system deals with the seven dimensions connected with the fact table through the foreign keys. These tables include data of the products that the company produced hierarchies are logical
structures which use the ordered levels as a mean of organizing data. A hierarchy can be used to define the data aggregation. For example, a hierarchy of Dates_Dim will aggregate data from the month level to the quarter level and to the year level. A hierarchy can also be used to define a navigational drill path and to establish a family structure. Determining the hierarchical sequence helps to show a gradual vision and an analysis of the data from several perspectives, and a comparison between the different levels.
C. Designing the staging area contents (ETL) : the ETL system is the essential part of the data warehouse the staging area is the interim location for the data between the source system and the target database structure. The staging area will hold the data extracted directly from the operational database, which will determine the physical structure of staging area [Malinowski,2008 ].
In the context of the current thesis, the researcher writes a set of (Procedures, Functions and Cursores), using (PL/SQL), implementation of these processes, are as follows
1. Extraction
Create two views in staging area, the first (Salescollect) is specified to extract the data from five tables (Sales_tbl, Sales_details_tbl, PRODUCT_TBL, QUALITY_TBL, customers_tbl) that relevant with sales. While the second (Throughputcollect) is specified to extract data from tables
(THROUGHPUT, THROUGHPUT_DETAILS and
PRODUCT_TBL, QUALITY_TBL, customers_tbl). The main reason of using views instead of the tables is to reduce the space and do not need to full scan of the table to validate what data still not extract.
2. Transformation and Loading
This process is performed to transfer data from both views (Throughputcollect and Salescollect) in the same way to the star schema in a data warehouse by using the procedure (DateIdExist) to extract the date of the sale and production into the units (day, week, month, quarter, year) as follows:
Extract(day from dt) , to_char(to_date(dt),‟W‟) Extract(month from dt) , to_char(dt,‟MON‟) To_char(dt_‟Q1‟) , Extract(year from dt)
To obtain the transformation and Loading operation effectively, the researcher uses the explicit and implicit cursors within the set of procedures and functions as follows:
o Extract data from the views and stores in the cursors. o The two main procedures (CollectingdatafromSales,
CollectingdatafromThroughput) call a set of sub procedures to test the related dimension tables, if the data extract from the view presented in each dimension table. If the data is not existent, then a set of functions will call to fetch each row to the related dimension tables for the sales and production.
4. The Implementation of the Proposed System
In general, the proposed system has been used as decision support system, helps the users at the both structure levels to build his SQL as follow:
A. On the level of each plant (Ninewa drugs Factory ) : Users can querying the database for each plant and the Star schema using three tools :
o Querying Star schema using SQL to present a comparison of sales quantity of product ( Flu-out) in January of (2010,2012)
SELECT DATES_DIM.YEAR, DATES_DIM.QUARTER,
CUSTOMERS_DIM.SECTOR, PRODUCTS_DIM.CATEGORY_NAME, SUM(SALES_QTY) SALES_QTY FROM
THR_SALES_FACT_TBL,DATES_DIM,CUSTOMERS_DIM,PRODUCTS_DIM WHERE THR_SALES_FACT_TBL.DATE_ID = DATES_DIM.DATE_ID AND
THR_SALES_FACT_TBL.CUST_ID=CUSTOMERS_DIM.CUSTOMER_ID AND THR_SALES_FACT_TBL.PROD_ID=PRODUCTS_DIM.PRODUCT_ID AND DATES_DIM.YEAR = 2010 AND DATES_DIM.QUARTER =1 AND CUSTOMERS_DIM.SECTOR = 'Private'
AND PRODUCTS_DIM.CATEGORY_NAME = 'Ampoules' GROUP BY(DATES_DIM.YEAR, DATES_DIM.QUARTER, CUSTOMERS_DIM.SECTOR,PRODUCTS_DIM.CATEGORY_NAME)
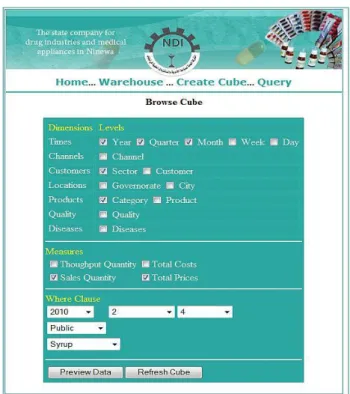
o Using Form : Select dimensions and Measures then click „Preview Data‟ button as shown in the figure (5)
Figure 5 Browsing Cube The result
o Using Analytical Workspace Manager(AWM)
Rollup and Drill_down operations : Using SQL Rollup
SELECT DISTINCT D7_YEAR_A1 , D5_CATEGORY_NAME , SUM(SUM_SALES_QTY) SALES_QTY
FROM NDI_CUBE
WHERE D7_YEAR_A1 = '2010' AND CHANNELS_D1 LIKE 'ALL%' AND CUSTOMERS_D2 LIKE 'ALL%' AND LOCATION_D4 LIKE 'ALL%'
AND D5_CATEGORY_NAME LIKE 'Ointments'
AND QUALITIES_D6 LIKE 'ALL%' AND DISEASES_D3 LIKE 'ALL%'
GROUP BY (sys_gid, D7_YEAR_A1 , CHANNELS_D1 , CUSTOMERS_D2 , LOCATION_D4 , D5_CATEGORY_NAME , QUALITIES_D6 , DISEASES_D3)
SELECT DISTINCT D7_YEAR_A1 , D5_CATEGORY_NAME , D5_PRODUCT_NAME, SUM(SUM_SALES_QTY) SALES_QTY FROM NDI_CUBE
WHERE D7_YEAR_A1 = '2010' AND CHANNELS_D1 LIKE 'ALL%' AND CUSTOMERS_D2 LIKE 'ALL%' AND LOCATION_D4 LIKE 'ALL%'
AND D5_CATEGORY_NAME LIKE 'Ointments'
AND D5_PRODUCT_NAME != ' ' AND QUALITIES_D6 LIKE 'ALL%'
AND DISEASES_D3 LIKE 'ALL%'
GROUP BY (sys_gid, D7_YEAR_A1 , CHANNELS_D1 , CUSTOMERS_D2 , LOCATION_D4 , D5_CATEGORY_NAME , QUALITIES_D6 , DISEASES_D3)
Figure 6 Slice on Diseases.type_of_diseases
Slice and Dice operations: For slicing on Diseases dimension, in “Browse Cube” form check Diseases level of diseases dimension and the measure “Sales Quantity” then click “Preview Data” button, as shown in figure(6 ).
For dicing on Diseases.Type_Of_Diseases and Customers.Sector, in “Browse Cube” form check Diseases level of diseases dimension, Sector level of customers dimension and the measure “Sales Quantity” then click “Preview Data” button, as shown in figure(7 ).
Figure 7 Dice on Customers.Sector and Diseases.type_of_diseases
A. On Main server :The study provide two approach to create global cube :
First, create materialized view
CREATE MATERIALIZED VIEW new_cube NOCACHE
NOPARALLEL BUILD IMMEDIATE USING NO INDEX REFRESH ON DEMAND COMPLETE ENABLE QUERY REWRITE AS SELECT DATES_DIM.YEAR,DATES_DIM.QUARTER,DATES_DIM.MONTH ,DATES_DIM.DAY, PRODUCTS_DIM.CATEGORY_NAME,PRODUCTS_DIM.PRODUC T_NAME, CUSTOMERS_DIM.SECTOR,CUSTOMERS_DIM.CUSTOMER_NA ME, SUM(SALES_QTY) SALES_QTY FROM
DATES_DIM,PRODUCTS_DIM,CUSTOMERS_DIM
,THR_SALES_FACT_TBL WHERE YEAR = 2011 AND MONTH = 1 AND SECTOR = 'Private' AND CATEGORY_NAME = 'Vials' AND DATES_DIM.DATE_ID = THR_SALES_FACT_TBL.DATE_ID AND PRODUCTS_DIM.PRODUCT_ID = THR_SALES_FACT_TBL.PROD_ID AND CUSTOMERS_DIM.CUSTOMER_ID = THR_SALES_FACT_TBL.CUST_ID GROUP BY ( DATES_DIM.YEAR,DATES_DIM.QUARTER,DATES_DIM.MONTH ,DATES_DIM.DAY, PRODUCTS_DIM.CATEGORY_NAME,PRODUCTS_DIM.PRODUC T_NAME, CUSTOMERS_DIM.SECTOR,CUSTOMERS_DIM.CUSTOMER_NA ME)
Second : create cube using the following PL/SQL code
set serveroutput on; declare
begin
MyCube :=dbms_cube.create_mview('admin','new_cube', 'build=immediate' ); end;
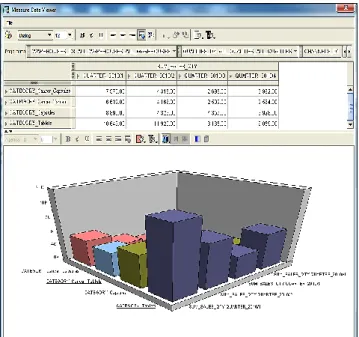
Rollup and Drill down global cube using AWM Sum of sales quantity at the year 2010 for categories (Cancer_Capsules, Cancer_Tablets, Capsules, Tablets) in figures(8,9).
Figure 8 ( Rollup)
Decision maker noted that the amount of sales for the department of tablets more than the amount of sales in the rest of the categories. Sum of sales quantity at the year 2010 for categories (Cancer_Capsules, Cancer_Tablets, Capsules, Tablets) and drill_down year 2010 to “Quarters”.0
Figure 9 Rollup and Drill down ( Drill down )
Conclusion
Data warehouse considered the most suited approach of Information Integration to build a Decision Support System for the business intelligence scenario. Users able to see trends and patterns through measures from different perspectives, that can help to make better strategic decisions. The implementation shows that the system proposed provides the effective tools to retrieve data through the: generate reports or query the data on line, and building cube. Also the results concludes that using views instead of tables in staging area reduce the transfer time and memory space when the view size equals to zero after loading the data. This embodies one of the sub objectives of current thesis to make the time of transfer to near Real time, substantially reduce the response time of a query. That for, the proposed system is characterized by high flexibility in terms of the ability to add other dimensions to star schema and add other measures to the fact table.
References
Ault M. (2003), Oracle Data Warehouse Management, Rampant Techpress.
Bhansali N. (2010), Strategic data warehousing: Achieving Alignment with Business.
Griesemer, B. (2009), Oracle Warehouse Builder 11g Getting Started, Packt Publishing,
Kimball R. and Caserta J (2004)., The Data Warehouse ETL Toolkit: Practica Techniques for Extracting, Cleaning, Conforming, and Delivering Data, Wiley Publishing, Inc. Canada.
Lane P. (2005), Oracle Database Data Warehousing Guide, 10g Release 2 (10.2).
Malinowski E. and Zim´anyi E. (2008), Advanced Data Warehouse Design From Conventional to Spatial and Temporal Applications, Springer-Verlag Berlin Heidelberg. Oracle Warehouse Builder Data Modeling, ETL, and Data
Quality Guide, 11g Release 2 (11.2), 2009
Ponniah P. (2007), Data Modeling Fundamentals a Practical Guide for IT Professionals, John Wiley & Sons.
Silvers F. (2008), Building and Maintaining a Data Warehouse, CRC Press.
Thomsen (2002), E, OLAP Solutions: Building Multidimensional Information Systems, Second Edition, John Wiley & Sons, Inc., New York
W. H. Inmon (2005), Building the Data Warehouse, Fourth Edition, John Wiley & Sons, Inc., New York.
Wang, J. (2006), Encyclopedia of Data Warehousing and Mining, IDEA Group Reference, London.
Hwan, M.I., and Hongjiang, X. (2007), The Effect of Implementation Factors on Data Warehousing Success: An Exploratory Study, Journal of Information, Information Technology, and Organizations Volume 2.
Noaman A. Y. (2000), Distributed Data Warehouse: Architecture and Design, Doctor of Philosophy in Computer Science, University Manitoba, Manitoba, Canada.
Shiao, G. C. (2006), Design and Implementation of Data Analysis Components, University of Akron, Master thesis.