Vol. 18, No. 3, June 2020, pp. 1376~1381
ISSN: 1693-6930, accredited First Grade by Kemenristekdikti, Decree No: 21/E/KPT/2018
DOI: 10.12928/TELKOMNIKA.v18i3.14840 1376
Convolutional neural network
for maize leaf disease image classification
Mohammad Syarief, Wahyudi Setiawan
Informatics Department, University of Trunojoyo Madura, Indonesia
Article Info ABSTRACT
Article history: Received Aug 17, 2019 Revised Jan 4, 2020 Accepted Feb 26, 2020
This article discusses the maize leaf disease image classification. The experimental images consist of 200 images with 4 classes: healthy, cercospora, common rust and northern leaf blight. There are 2 steps: feature extraction and classification. Feature extraction obtains features automatically using convolutional neural network (CNN). Seven CNN models were tested i.e AlexNet, virtual geometry group (VGG) 16, VGG19, GoogleNet, Inception-V3, residual network 50 (ResNet50) and ResNet101. While the classification using machine learning methods include k-Nearest neighbor, decision tree and support vector machine. Based on the testing results, the best classification was AlexNet and support vector machine with accuracy, sensitivity, specificity of 93.5%, 95.08%, and 93%, respectively. Keywords:
AlexNet Classification
Convolutional neural network k-nearest neighbor
Maize leaf image This is an open access article under the CC BY-SA license.
Corresponding Author: Wahyudi Setiawan, Informatics Department, University of Trunojoyo Madura,
Raya Telang St., Perumahan Telang Inda, Telang, Kamal, Bangkalan, Jawa Timur 69162, Indonesia. Email: [email protected]
1. INTRODUCTION
Convolutional neural network (CNN) is a development of the artificial neural network that consists of tens to hundreds of layers [1]. CNN is a method in deep learning that can perform various tasks such as image classification [2, 3], segmentation [4, 5], recognition [6, 7], and objects detection [8, 9]. CNN technology has grown widely including fields of medical image [10, 11], autonomous drivers [12, 13], robotics [14, 15], and agricultural image [16]. Many image studies have been carried out, such as disease classification in 15 food crops using 5 convolutional layers [17], classification of diseases in 9 class plant images using googleNet [18]. Mohanty et al. classified 14 types of food crops, including maize. There was 26 class of diseases. The testing used images in vast numbers, i.e 54,306 images. Deep learning conventional neural network with two architecture (AlexNet and GoogleNet) was used for classification. The classification results showed an accuracy of 31.4% [19].
In this study, classification was carried out to detect diseases in maize leave images using CNN. One of the previous studies that carried out diseases classification of maize leaves using CNN was Sibiya & Sumbwanyambe [20]. They using 3 classes of disease classification: northern leaf blight, common rust, and cercospora. CNN architecture used was not explained in detail, but it only mentioned using 50 hidden layers consisting of convolution layers with filter kernels that have a median of 24, rectified linear units (ReLU) and pooling layers. One hundred images per class was used with a ratio of 70% for training and 30% for testing. The testing results showed an accuracy of 92.85% [20]
Zhang classified 8 diseases in maize leaf images: southern leaf blight, brown spot, curvularia leaf spot, rust, dwarf mosaic, gray leaf spot, round spot, and northern leaf blight [18]. CNN architecture used was googleNet or Inception-V1. The experiments were conducted using 3,672 images, 80% for training and 20% for testing. Classification results showed an accuracy of 98.9% [18]. Hidayat classified three diseases in maize leaf images: common rust, cercospora, and northern leaf blight [21]. The experiments used 300 maize leaf images. Average accuracy result was 93.67% [21].
Both types of research, Sibiya & Sumbwanyambe [20] and Hidayat et al. [21], only explained the type of CNN layers, but the number of each layer type and detailed parameters were not explained, while Zhang’s [18] used existing CNN architecture, i.e GoogleNet that consists of 177 layers. There was a novelty in this study. First, use of 7 CNN architectures: AlexNet [22], VGG16, VGG19 [23], GoogleLet [23], Inception-V3 [24], ResNet50 and ResNet101 [25] and machine learning classification method (kNN, decision tree, SVM) to classify maize leaf diseases. Second, the percentage of accuracy increased while compared to the previous study.
2. RESEARCH METHOD
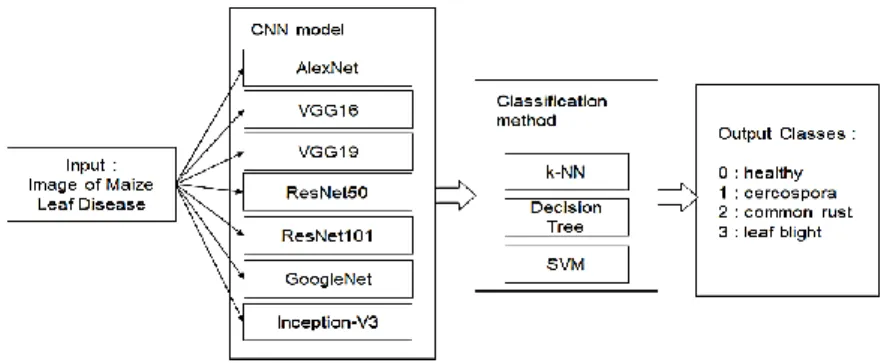
The steps for classification process using CNN are shown in Figure 1. Maize leaf images as data are divided into 2 parts: training and testing data. Furthermore, CNN is applied, the function of CNN as a feature extraction process without determining type of feature extraction as in conventional machine learning. The next process is classification using k-Nearest Neighbor, support machine and decision tree.
Figure 1. The research method of maize leaf disease image classification 2.1. Maize leaf image
Image data used maize leaves that size of 256x256 pixels. Data consists of 200 images which are divided into 4 classes, 50 images per class. Experiment data obtained from Mohanty plant village [19]. Examples of image data on maize leaves are shown in Figure 2. When training and testing using CNN, image size is adjusted to default size of each CNN architecture. Table 1 show the default input size of CNN model.
Table 1. Default input size of CNN CNN Default Input Size AlexNet 227×227 VGG16 224×224 VGG19 224×224 GoogleNet 224×224 Inception-V3 299×299 ResNet50 224×224 ResNet101 224×224
2.2. Convolutional neural network
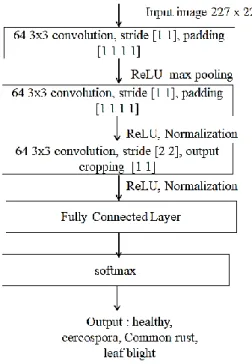
CNN consists of 2 main parts: feature extraction and classification. The feature extraction section includes input layer, convolutional layer with stride and padding, rectified linear unit (ReLU), pooling, and batch normalization layer. While the classification part consists of fully connected layer, softmax dan output layer. CNN architecture can have more than one type of layer [26]. CNN architectures analyzed in this paper were AlexNet, VGG16, VGG19, GoogleNet, Inception-V3, ResNet50, and ResNet101. Those architectures have 25, 41, 177 and 144 layers, respectively. Figure 3 shows a simple CNN model that has 13 layers: 1 input layer, 3 convolutional layers with stride and padding, 3 ReLU layers, pooling layer, 2 normalization layer, FCL, softmax, and output layer.
Figure 3. Simple CNN model
AlexNet architecture has twenty-five layers [22]: Input layer, 5 convolutional layers, first convolutional layer has a 11×11 filter, second layer has a 5×5 filter, and third, to fifth layer have 3×3 filters. Furthermore, 7 ReLU layers, 2 normalization layers, 3 max-pooling layers, 3 fully connected layer, 2 dropouts 0.5, Softmax and output layer. Visual Geometry Group (VGG) from Oxford University creates a VGG16 network architecture with 41 layers. VGG simplifies the processes by creating a 3×3 filter for each layer. Equivalent and smaller filter size used in VGG can produce more complex features and lower computing than AlexNet’s. VGG16 architecture consists of [23]: the input layer size is 224×224 pixels. 13 convolutional layers. First and second convolutional layers have filter size of 64 pixels, third and fourth have filter size of 128 pixels, fifth to seventh have filter size of 256 pixels and eight to thirteenth have filter size of 512. Fifteen ReLU. 5 max-pooling, 3 fully connected layers. Two dropout 0.5, Softmax and output layer
While VGG19 architecture consists of [23]: input layer is 224×224 pixels. Sixteen convolutional layers. First and second convolutional layers have filter size of 64 pixels, third and fourth have filter size of
128 pixels, 5 to 8 have filter size of 256 pixels and the 9 to 16 have filter size of 512 pixels, 18 ReLU, 5 max-pooling, 3 fully connected layers, 2 dropouts of 0.5 Softmax and output layer. ResNet50 dan ResNet101 increasing number of layers is directly proportional to the increase in learning, but it can lead to learning more and more difficult and accuracy decreases. Residual learning provides solutions to these problems. Residual Network (ResNet) is a CNN network architecture for residual learning. Residual learning skips layer connection. ResNet50 architecture has 177 layers, while ResNet101 has 347 layers [26].
GoogLeNet (Inception-V1) is a CNN architecture that has 144 layers. GoogLeNet corrects deficiencies in VGG that require high computing, both memory and time. The working principle of Inception is that the network will automatically choose the best convolution results using a certain size. Filter size used in this architecture is 1×1 pixels, 3×3 pixels, 5×5 pixels and max-pooling 3×3 pixels. Another variant used in this study was Inception-V3. Inception-V3 architecture consists of 316 layers [27-29]
2.3. Classification methods
In this study, we used three classification methods for testing: support vector machine [30], k-Nearest Neighbor [31] and decision tree [32]. For each testing, we configure the network layer, extract the features, and make classification using each method above.
3. RESULT AND DISCUSSION
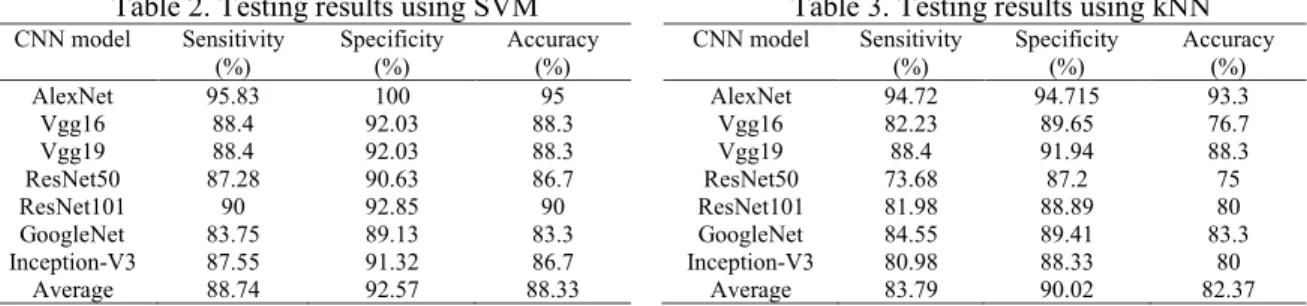
The experiment divided into 3 scenarios, output of 7 CNN models classified with SVM, kNN and Decision Tree. Testing results using the CNN architecture were found in Table 2 to Table 4. Table 2 represented classification testing using the SVM method, while Table 3 and Table 4 for classification using k-Nearest Neighbor and decision tree methods, respectively.
Table 2. Testing results using SVM CNN model Sensitivity (%) Specificity (%) Accuracy (%) AlexNet 95.83 100 95 Vgg16 88.4 92.03 88.3 Vgg19 88.4 92.03 88.3 ResNet50 87.28 90.63 86.7 ResNet101 90 92.85 90 GoogleNet 83.75 89.13 83.3 Inception-V3 87.55 91.32 86.7 Average 88.74 92.57 88.33
Table 3. Testing results using kNN CNN model Sensitivity (%) Specificity (%) Accuracy (%) AlexNet 94.72 94.715 93.3 Vgg16 82.23 89.65 76.7 Vgg19 88.4 91.94 88.3 ResNet50 73.68 87.2 75 ResNet101 81.98 88.89 80 GoogleNet 84.55 89.41 83.3 Inception-V3 80.98 88.33 80 Average 83.79 90.02 82.37
Table 4. Testing results using decision tree CNN model Sensitivity (%) Specificity (%) Accuracy (%)
AlexNet 74.33 84.19 73.3 Vgg16 77.73 84.58 75 Vgg19 76.93 86.89 76.7 ResNet50 83.58 88.22 83.3 ResNet101 76 83.7 73.3 GoogleNet 73.85 85.61 75 Inception-V3 66.53 79.93 65 Average 75.56 84.73 74.51
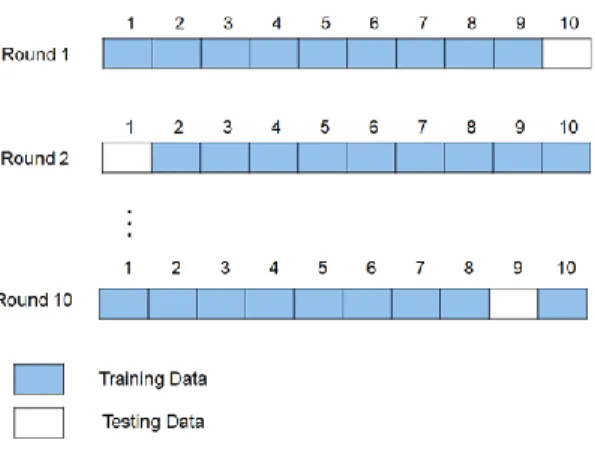
Based on the testing results above, the best classification was produced by AlexNet architecture with Support Vector Machine classification. It showed the best performance measures based on sensitivity, specificity, and accuracy of 95.83%, 100%, and 95%, respectively. Best average accuracy of 88.33% using SVM. Furthermore, to do validation used 10-fold cross-validation. This method will divide data into 10 equal parts. The complete stages are as follows:
a) First, 9 data sections are used for training, one final data section is used for testing.
b) Second, the data section until the data is used for training, the first data section is used for testing, and so on.
c) And so on until the data part 1 to 8 and 10 are used as training data, while data section 9 is used as testing data.
d) Find the average value of all rounds. For more details, an illustration of 10-fold cross-validation is shown in Figure 4.
The results of 10-fold cross-validation are shown in Table 5. It using AlexNet and SVM as classification. In the final section, the results of 10 k cross-validation were compared with previous studies. Table 6 represents a comparison between this study and previous studies using maize leaf images for
disease classification.
Figure 4. 10-fold cross-validation
Table 5. Performance measure of 10-fold cross-validation Round Sensitivity (%) Specificity (%) Accuracy (%)
1 95.83 95.83 95 2 90 92.86 90 3 100 100 100 4 87.5 88.69 85 5 100 100 100 6 95.83 95.83 95 7 100 100 100 8 80 88.89 80 9 90 92.86 90 10 95.83 95.83 95 Average 93.5 95.08 93
Table 6. Results comparison of maize leaf classification
Authors Number of classes Sensitivity (%) Specificity (%) Accuracy (%) Sibiya & Sumbwanyambe [20] 3 - - 92.85
Zhang et al. [18] 8 - - 98.9 Hidayat et al. [21] 3 - - 93.67
Proposed method 4 93.5 95.08 93
4. CONCLUSION
This study analyzed maize leaf image classification using 7 CNN architectures (AlexNet, VGG16, VGG19, ResNet50, ResNet110. GoogleNet, and Inception-V3) and the classification methods (SVM, kNN, and Decision Tree). The best classification was generated by AlexNet architecture with SVM. This showed that AlexNet and SVM methods were best suited for feature extraction and image classification of maize leaves disease. Furthermore, we could increase the percentage of accuracy by adding optimization methods in CNN architectures.
REFERENCES
[1] C. Steger, M. Ulrich, and C. Wiedemann, "Machine Vision Algorithms and Applications," 1st Edition. Weinheim:
Wiley-VCH, 2007.
[2] D. Hana, Q. Liu, and W. Fan, “A new image classification method using CNN transfer learning and web data
augmentation,” Expert Syst. Appl., vol. 95, pp. 43-56, 2018.
[3] C. Zhang et al., “A hybrid MLP-CNN classifier for very fine resolution remotely sensed image classification,”
[4] W. Setiawan, M. I. Utoyo, and R. Rulaningtyas, “Vessels semantic segmentation with gradient descent
optimization,” International Academic Journals., vol. 7, no. 4, pp. 4062-4067, 2018.
[5] W. Setiawan, M. I. Utoyo, and R. Rulaningtyas, “Semantic segmentation of artery-venous retinal vessel using
simple convolutional neural network,” IOP Conference Series : Earth and Environmental Science, vol. 243, no. 1,
pp. 1-10, 2019.
[6] Y. Li, J. Zeng, and S. Shan, “Occlusion aware facial expression recognition using CNN with attention mechanism,”
IEEE Trans. Image Process., vol. 28, no. 5, pp. 2439-2450, 2018.
[7] Y. X, Yang, et al.,“Face recognition using the SR-CNN Model,” Sensors, vol. 18, no. 12, 2018. [8] Y. Chen, et al., “Domain adaptive faster R-CNN for object detection in the wild,” pp. 3339-3348, 2018.
[9] H. Gao, et al., “Object classification using CNN-based fusion of vision and LIDAR in autonomous vehicle
environment,” IEEE Trans. Ind. Informatics, vol. 14, no. 9, pp. 4224-4231, 2018.
[10] A. Khatami, et al.,“A sequential search-space shrinking using CNN transfer learning and a Radon projection pool
for medical image retrieval,” Expert Syst. Appl., vol. 100, pp. 224-233, 2018.
[11] M. Frid-adar, et al.,“GAN-based synthetic medical image augmentation for increased CNN performance in liver lesion classification,” Neurocomputing, vol. 321, pp. 321-331, 2018.
[12] S. O. A. Chishti, et al., “Self-driving cars using CNN and Q-learning,” IEEE 21st International Multi-Topic
Conference (INMIC), pp. 1-7, 2018.
[13] A. Dhall, D. Dai, and L. Van Gool, “Real-time 3D Traffic cone detection for autonomous driving,” pp. 494-501, 2019. [14] K. Mott, “State classification of cooking objects using a VGG CNN,” arXiv preprint arXiv:1904.12613, 2018. [15] A. Milioto and C. Stachniss, “Bonnet : An open-source training and deployment framework for semantic
segmentation in robotics using CNNs,” International Conference on Robotics and Automation,pp. 7094-7100, 2019. [16] A. Kamilaris and F. X. Prenafeta-Boldu, “A review of the use of convolutional neural networks in agriculture,”
J. Agric. Sci., vol. 156, no. 3, pp. 312-322, 2018.
[17] S. Sladojevic, et al., “Deep neural networks based recognition of plant diseases by leaf image classification,”
Comput. Intell. Neurosci., vol. 2016, pp. 1-11, 2016.
[18] X. Zhang, et al., “Identification of Maize leaf diseases using improved deep convolutional neural networks,”
IEEE Access, vol. 6, pp. 30370-30377, 2018.
[19] S. P. Mohanty, D. Hughes, and M. Salathé, “Using deep learning for image-based plant disease detection,”
Front. Plant Sci., vol. 7, no. 10, pp. 1-7, 2016.
[20] M. Sibiya and M. Sumbwanyambe, “A computational procedure for the recognition and classification of maize leaf diseases out of healthy leaves using convolutional neural networks,” Agri Engineering, vol. 1, no. 1, pp. 119-131, 2019. [21] A. Hidayat, U, Darusalam, and I, Irmawati., “Detection of disease on corn plants using convolutional neural,”
Jurnal Ilmu Komputer dan Informasi., vol. 12, no. 1, pp. 51-56, 2019.
[22] A. Krizhevsky, I. Sutskever, and G. E. Hinton, “ImageNet classification with deep convolutional neural networks,”
Advances in neural information processing systems, pp. 1097-1105, 2012.
[23] K. Simonyan and A. Zisserman, “Very deep convolutional networks for large-scale image recognition,” arXiv preprint arXiv:1409.1556,2014.
[24] K. He, X. Zhang, S. Ren, and J. Sun, “Deep residual learning for image steganalysis,” Multimed. Tools Appl., pp. 770-778, 2015.
[25] K. He and J. Sun, “Deep residual learning for image recognition,” IEEE Xplore, pp. 1-9, 2015.
[26] W. Setiawan, M. I, Utoyo, and R. Rulaningtyas, “Classification of neovascularization using convolutional neural
network model,” TELKOMNIKA Telecommunication Computing Electronics and Control, vol. 17, no. 1,
pp. 463-472, 2019.
[27] C. Szegedy, V. Vanhouke, S. Ioffe, and J. Shlens, “Rethinking the inception architecture for computer vision christian,” IEEE Explor., pp. 2818-2826, 2016
[28] C. Szegedy, et al., “Inception-v4, Inception-ResNet and the impact of residual connections on learning,”
Thirty-first AAAI conference on artificial intelligence,pp. 1-12, 2017.
[29] C. Szegedy et al., “Going deeper with convolutions,” IEEE conference on computer vision and pattern recognition,
pp. 1-9, 2015.
[30] A. Kowalczyk, "Support vector machine," Morrisville, North Carolina: syncfusion, 2017.
[31] A. S. Prasath, et al., “Distance and similarity measures effect on the performance of K-Nearest neighbor classifier,”
Elsevier, pp. 1-53, 2019.
[32] J. M. Martínez-Otzeta, et al., “K Nearest neighbor edition to guide classification tree learning: Motivation and experimental results,” Lecture Notes in Computer Science, 2018, pp. 53-63, 2018.