RESEARCH ARTICLE
A Multiple SVM System for Classification of Hyperspectral
Remote Sensing Data
Behnaz Bigdeli&Farhad Samadzadegan&Peter Reinartz
Received: 9 February 2013 / Accepted: 22 April 2013 #Indian Society of Remote Sensing 2013
Abstract With recent technological advances in re-mote sensing sensors and systems, very high-dimensional hyperspectral data are available for a better discrimination among different complex land-cover classes. However, the large number of spectral bands, but limited availability of training samples creates the problem of Hughes phenomenon or‘curse of dimensionality’ in hyperspectral data sets. Moreover, these high numbers of bands are usually highly correlated. Because of these complexities of hyperspectral data, traditional classification strategies have often limited performance in classification of hyperspectral imagery. Referring to the limitation of single classifier in these situations, Multiple Classifier Systems (MCS) may have better performance than single classifier. This paper presents a new method for classification of hyperspectral data based on a band clustering strategy through a multiple Support Vector
Machine system. The proposed method uses the band grouping process based on a modified mutual information strategy to split data into few band groups. After the band grouping step, the proposed algorithm aims at benefiting from the capabilities of SVM as classification method. So, the proposed approach applies SVM on each band group that is produced in a previous step. Finally, Naive Bayes (NB) as a classifier fusion method combines de-cisions of SVM classifiers. Experimental results on two common hyperspectral data sets show that the proposed method improves the classification accu-racy in comparison with the standard SVM on entire bands of data and feature selection methods. Keywords Hyperspectral . Support Vector Machine . Multiple Classifier System . Bayesian Theory
Introduction
With the development of the remote-sensing imaging technology and hyperspectral sensors, classification of hyperspectral image is becoming more and more wide-spread in different applications (Jia 2002; Goel et al. 2003; Li et al.2011). These data cover in most cases a wide spectral range from the visible to the short-wave infrared with a narrow band width for each single chan-nel, resulting in hundreds of data channels. Thanks to this amount of information, it is feasible to deal with applications that require a precise discrimination in the spectral domain. In this context, hyperspectral images DOI 10.1007/s12524-013-0286-z
B. Bigdeli (*)
:
F. SamadzadeganDepartment of Geomatics Engineering, Faculty of Engineering, University of Tehran, North Kargar Street, Tehran, Iran
e-mail: [email protected] F. Samadzadegan e-mail: [email protected] P. Reinartz
Department of Photogrammetry and Image Analysis, Remote Sensing Technology Institute, German Aerospace Centre (DLR), Oberpfaffenhofen, P.O Box 1116, 82230 Weßling, Germany
have been successfully used for supervised classifica-tion problems that require very precise descripclassifica-tion in spectral feature space.
An extensive literature is available on the classifi-cation of hyperspectral images. Maximum likelihood or Bayesian estimation methods (Jia 2002), decision trees (Goel et al.2003), neural networks (Del frate et al. 2007), genetic algorithms (Vaiphasa 2003), and kernel-based techniques (Müller et al. 2001; Camps-Valls and Bruzzone2005) have been widely investigat-ed in this direction. One of the most popular classifica-tion methods is Support Vector Machines (SVM) defined by Vapnik, a large margin based classifier with a good generalization capacity in the small-size training set problem with high-dimensional input space (Vapnik 1998). Recently, SVMs have been successfully applied in the classification of hyperspectral remote-sensing data. Camps-Valls and Bruzzone (2005) demonstrated that SVMs perform equal or better than other classifiers in terms of accuracy on hyperspectral data.
At the same time, hyperspectral images are usually composed of tens or hundreds of close spectral bands, which result in high redundancy and great amount of
computation time for image classification. Large num-ber of features can become a curse in terms of accuracy if enough training samples are not available, i.e. due to the Hughes phenomenon in most of traditional classifi-cation techniques (Li et al.2011). Hughes phenomenon means that when the training sample number is a con-stant, the precision of classification will be decreased with the increasing of the dimensionality. It implies that the required number of training samples for supervised classification increases as a function of dimensionality.
Conventional classification strategies often can-not overcome mentioned problem. Alternatives like Multiple Classifier Systems (MCS) are successfully applied on various types of data to improve single classifiers results. Multiple Classifier System (MCS) can improve classification accuracy in com-parison to a single classifier by combining differ-ent classification algorithms or variants of the same classifier (Kuncheva 2004). In such systems a set of classifiers is first produced and then com-bined by a specific fusion method. The resulting classifier is generally more accurate than any of the individual classifiers that make up the ensemble.
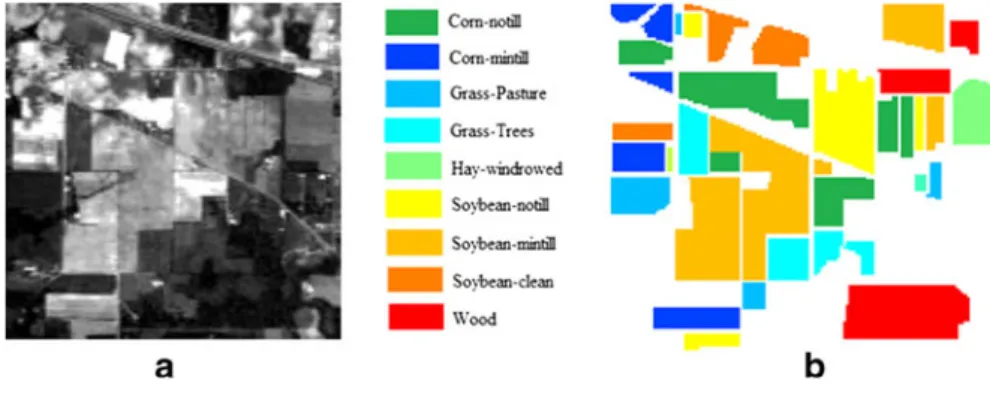
Fig. 2 AVIRIS Indian Pine Data,a) Original data andb) Ground truth H Hyyppeerrssppeeccttrraallddaattaa B Baanndd G Grroouuppiinngg G Grroouupp11 G Grroouupp22 G Grroouuppnn . . . . . . O Ouuttppuutt . . . . . . O Ouuttppuutt O Ouuttppuutt C Cllaassssiiffiieerr11 C Cllaassssiiffiieerr22 C Cllaassssiiffiieerrnn C Cllaassssiiffiieerr F Fuussiioonn F FiinnaallCCllaasssseess
Multiple classifier systems can be used to improve classification accuracy in remote sensing data sets (Benediktsson and Kanellopoulos1999).
The first step of this paper lies in the problem formulation of the extraction of band groups from hyperspectral data to produce a multiple classifier system. This method tries to split the entire high dimensional hyperspectral space into few band groups for classification while it can overcome Hughes phe-nomenon or curse of dimensionality. The proposed approach decomposes high number of spectral bands into few uncorrelated groups. After that SVMs are applied on each group which was produced in the previous step. After producing an ensemble of classi-fiers, a classifier fusion method based on the Bayesian theory is applied in the multiple classifier system to fuse the outputs of SVM classifiers.
Band Grouping of Hyperspectral Imagery
Basic principle of the band grouping of hyperspectral imageries is that the adjacent bands which have high correlation are be grouped into one group and the ones with little redundancy should be separated into differ-ent groups. Band grouping of hyperspectral imageries as primary step of feature selection is investigated in a wide range of investigations.
Feature selection (Band Selection) algorithms suit-ably select a (sub)optimal subset of the original set of features while discarding the remaining features to the classification problem of hyperspectral images. Feature selection techniques generally involve both a search algorithm and a criterion function. The search
algorithm generates possible“solutions”of the feature selection problem (i.e., subsets of features) and com-pares them by applying the criterion function as a measure of the effectiveness of each solution.
Benediktsson and Kanellopoulos (1999) pro-posed absolute correlation as a measure of the spectral bands similarity. After computing correla-tion matrix between bands, they applied a manual clustering to split hyperspectral image. Prasad and Bruce (2008) proposed a divide and conquer ap-proach that partitions the hyperspectral space into contiguous subspaces using the reflectance infor-mation. In another article (Martinez-Uso et al. 2006) they used a clustering method in relation-ship to hyperspectral, multi-temporal classification. After partitioning hyperspectral data using reflec-tance information, they used Linear Discriminant Analysis (LDA) on each subspace that ensures good class separation in their clustering method.
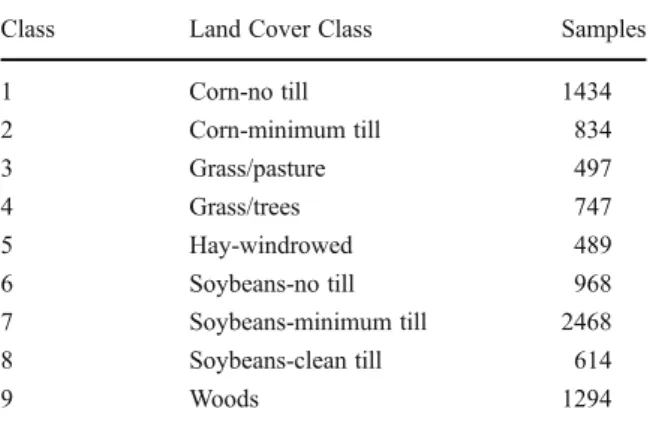
Table 1 AVIRIS Indian Pine lands cover classes and available reference samples
Class Land Cover Class Samples
1 Corn-no till 1434 2 Corn-minimum till 834 3 Grass/pasture 497 4 Grass/trees 747 5 Hay-windrowed 489 6 Soybeans-no till 968 7 Soybeans-minimum till 2468 8 Soybeans-clean till 614 9 Woods 1294
Fig. 3 ROSIS Pavia University Data,a) Original data andb) Ground truth
Table 2 ROSIS Pavia University lands cover classes and avail-able reference samples
Class Land Cover Class Samples
1 Trees 524
2 Asphalt 548
3 Bitumen 375
4 Gravel 392
5 Painted metal sheets 265
6 Shadows 231
7 Self-Blocking Bricks 514
8 Meadows 540
The resulting system is capable of performing re-liable classification even when relatively few train-ing samples are available for a given date.
Martinez-Uso et al. (2006) applied a grouping-based band selection using information measures on hyperspectral data. They used band grouping as a primary step for a band selection technique. Guo et al. (2006) found that the grouping based on the simple criterion of only retaining features with high associated mutual information (MI) values is problematic when the bands were highly correlat-ed. It is also presented that mutual information by itself would not be suitable as a similarity mea-sure. The reason is that it can be low because either the two bands present a weak relation (such as it should be desirable) or the entropies of these variables are small (in such a case, the variables contribute with little information).
Thus, it is convenient to define a strategy that mod-ifies the results of band grouping using mutual informa-tion. This paper applies a hybrid band grouping strategy based on genetic algorithm and support vector machine on the primary results of mutual information. Furthermore Li et al. (2011) applied this method for feature selection on hyperspectral data. Experimental results on two reference data sets have shown that this approach is very competitive and effective.
Classification of Hyperspectral Imagery Using Support Vector Machine (SVM)
SVMs separate two classes by fitting an optimal linear separating hyper plane to the training samples of the two classes in a multidimensional feature space. The optimization problem being solved is based on struc-tural risk minimization and aims to maximize the margins between the optimal separating hyper plane and the closest training samples also called support vectors (Weston and Watkins 1999; Scholkopf and Smola2002). Let, for a binary classification problem in a d-dimensional feature spacexibe a training data set ofLsamples with their corresponding class labels
yi ∈ {1, −1}. The hyper plane f(x) is defined by the normal vectorw and the biasb wherej jb=k kw is the distance between the hyper plane and the origin,
fðxÞ ¼w:xþb ð1Þ
For linearly not separable cases, the input data are mapped into a high-dimensional space in which the new distribution of the samples enables the fitting of a linear hyper plane. The computationally extensive mapping in a high dimensional space is reduced by using a positive definite kernel k, which meets Mercers conditions (Scholkopf and Smola2002).
fð Þxi f xj ¼k xi;xj
ð2Þ where ϕ is mapping function. The final hyper plane decision function can be defined as:
fðxÞ ¼X L i¼1 aiyik xi;xj þg ð3Þ
whereαiare Lagrange multipliers.
Recently, SVMs have attracted increasing attention in remote-sensed hyperspectral data classification tasks and an extensive literature is available. Melgani and Bruzzone (2004) applied SVM for classification of hyperspectral data. They obtained better classifica-tion results compared to other common classificaclassifica-tion algorithms. In Watanachaturaporn and Arora (2004)
Table 3 Final band grouping results on AVIRIS data
Groups 1 2 3 4 5 6 7 8 9 10 11 12
Bands 1–18 19–33 34–44 45–57 58–77 78–105 106–125 126–131 132–147 148–157 158–170 171–202
Bands
MI value
study the aim is to investigate the effect of some factors on the accuracy of SVM classification. The factors considered are selection of multiclass method, choice of the optimizer and the type of kernel function. Tarabalka et al. (2010) present a novel method for accurate spectral-spatial classification of hyperspectral images using support vector machines. Their proposed method, improved classification accuracies in compar-ison to other classification approaches.
Multiple Classifier System (MCS)
Combining classifiers to achieve higher accuracy is an important research topic with different names such as combination of multiple classifiers, Multiple Classifier System (MCS), classifier ensembles and clas-sifier fusion. In such systems a set of clasclas-sifiers is first produced and then combined by a specific fusion method. The resulting classifier is generally more accurate than any of the individual classifiers that make up the ensem-ble (Kuncheva2004; Kuncheva and Whitaker2003).
The possible ways of combining the outputs of the
L classifiers in a MCS depend on what information can be obtained from the individual members. Kuncheva (2004) distinguishes between two types of classifier outputs which can be used in classifier com-bination methods. The first types are classifiers that produce crisp outputs. In this category each classifier only outputs a unique class and finally a vector of classes is produced for each sample. The second type of classifier produces fuzzy output which means that in this case the classifier associates a confidence measure-ment for each class and finally produces a vector for every classifier and a matrix for ensemble of classifier.
The key to the success of classifier fusion is that, intuitively at least, a multiple classifier system should build diverse and partially uncorrelated classifiers. Diversity among classifiers is the notion describing the level to which classifiers vary in data representation, concepts, strategy etc. Consequently, this should be reflected in different classifiers making errors for differ-ent data samples. As shown in many papers, such phe-nomenon of disagreement to errors is highly beneficial for combining purposes (Kuncheva and Whitaker 2003). Most of the diversity measures have already been studied for artificial data by Kuncheva (2004) and real world data sets by Ruta and Gabrys (2000). In the simplest case, a measure can be applied for examining Table
4 Overall Accuracy of SVM classifiers on bands groups of A VIRIS Data for dif ferent training size T raining size Band Group#1 Band Group#2 Band Group#3 Band Group#4 Band Group#5 Band Group#6 Band Group#7 Band Group#8 Band Group#9 Band Group#10 Band Group#1 1 Band Group#12 %5 53.778 62.222 61.556 49.778 59.778 61.556 52.889 46.889 50.222 49.778 51.1 1 1 63.1 1 1 %10 57.778 64 64.444 51.333 57.556 60.444 53.778 46.667 50 50.889 47.556 56.444 %20 57.333 64.667 65.333 53.556 62 66 54 48.889 50.222 51.1 1 1 49.333 53.1 1 1
diversity between exactly two classifiers. Such sures are usually referred to as pair-wise diversity mea-sures (PDM). For more than two classifiers, PDM is typically obtained by averaging the PDM’s calculated for all pairs of classifiers from the considered pool of classifiers. Disagreement (Diss) and Double Fault (DF) are two important diversity measures. Disagreement takes the form of a ratio between the numbers of sam-ples for which the classifiers disagreed, to the total number of observations. This can be written as:
Diss¼N
FTþNTF
N ð4Þ
Where NFF represents the number of elements which both classifiers classified incorrectly, NTF is the number of elements which the 1st classifier clas-sified correctly and the 2nd classifier clasclas-sified incor-rectly, andNFTstands for the 2nd classifier classified correctly and the 1st classifier classified incorrectly. Second, the “Double Fault”estimates the probability of coincident errors for a pair of classifiers, which is
DF¼N
FF
N ð5Þ
These two measures vary between [0–1]. If the dis-agreement measure is greater the diversity is greater how-ever if the double fault measure is lower the diversity is greater. (This means that the relationship between dis-agreement measure and diversity of classifiers is straight but the relationship between DF and diversity is reverse). The performance of a multiple classifier system es-sentially depends on another major factor related to the classifier’s pool: correlation. The correlation between the classifiers to be fused needs to be small to allow performance improvement in classifier fusion. Goebel et al. (2002) introduced a simple computational method for evaluating the correlation between two classifiers which can be extended for more than two classifiers. Kuncheva
and Whitaker (2003) investigated the effects of indepen-dence between individual classifiers on classifier fusion. They showed that independent classifiers offer a dra-matic improvement over the accuracy of fusion corre-lated results. For each classifier, a confusion matrixM
can be generated using the labelled training data . The confusion matrix lists the true classes versus the esti-mated classes. Goebel et al. (2002), describe a classifier correlation analysis for two classifiers.
ρ¼ 2NFF
NTFþNFTþ2NFF ð6Þ
Goebel et al., proposed an extension of the 2 class correlation coefficient tondifferent classifiers as follows: ρn¼
nNf
NNf NtþnNf ð7Þ
where n is the number of classifiers, N represents the number of samples,Ntis the number of samples for which all classifiers had a right answer andNfis the number of samples for which all classifiers had a wrong answer.
In recent years, more studies applied a classifier fusion concept to improve classification results on re-motely sensed data (Waske and Van der linden 2008; Ceamanos et al.2010). Producing a multiple classifier system with low correlation and high diversity between single classifiers can be useful for improving the classi-fication accuracy in particular for multisource data sets and hyper dimensional imagery.
SVM-based MCS for Classification of Hyperspectral Image
A multiple SVM system based on the band grouping for classification of hyperspectral images is introduced in this paper. Figure1shows the general structure of the proposed methodology. The proposed method
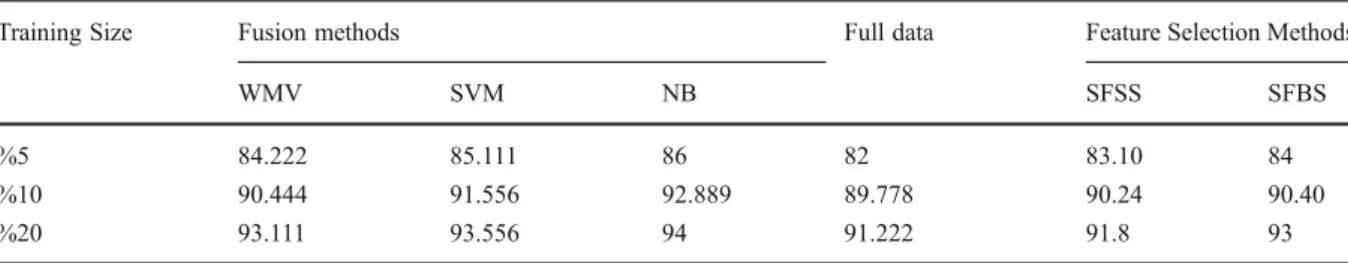
Table 5 Comparison of classification strategies on AVIRIS data set
Training Size Fusion methods Full data Feature Selection Methods
WMV SVM NB SFSS SFBS
%5 84.222 85.111 86 82 83.10 84
%10 90.444 91.556 92.889 89.778 90.24 90.40
starts by splitting the hyperspectral image into few band groups based on the modified mutual informa-tion strategy.
First, the adjacent bands which exhibit a high mu-tual information measure are grouped into one group through a computation of the similarity measure of the spectral information. The major benefit of the pro-posed method is related to this step. All researches in feature selection techniques tried to select just useful bands while the proposed method tries to prevent losing information in feature selection by a system that enables the use of the entire high dimensional hyperspectral in few band clusters.
Second, the proposed methodology applies a SVM classifier for classification of each band group which is produced in the previous step. While conventional methods use SVM for the whole hyperspectral data by definition of one single kernel function which may not be adapted to the whole diversity of information, the proposed method uses one SVM for each band group. In fact, the kernel of each individual classifier applied on each band group is adjusted according to the cor-responding data. Finally, generated classification re-sults fused to improve classification accuracy. In order
to show the performance of the proposed method, results compared with two common classification strategies on hyperspectral data: feature selection method and standard SVM on entire bands.
Band Grouping Based on Mutual Information As stated in the previous section, Mutual Information is applied to split hyperspectral data into few band groups. The entropy is a measure of uncertainty of random variables, and is a frequently-used evaluation criterion of feature selection (Martinez-Uso et al. 2006; Guo et al.2006). If a discrete random variable
XhasΦalphabets and the probability density function is p(x),x∈Φ, the entropy ofXis defined as:
HðXÞ ¼ X
x2
pðxÞlogpðxÞ ð8Þ
In the task of band grouping, the entropy of each band is computed by using all spectral information of this band. For two discrete random variablesXandY, which have Φand Ψalphabets and their joint proba-bility density function isp(x, y),x∈Φ, y∈Ψ, the joint entropy ofXandYis defined as:
H Xð ;YÞ ¼ X
x2 X
y2
p xð ;yÞlogp xð ;yÞ ð9Þ The mutual information is usually used to measure the correlation between two random variables and it is defined as:
MI Xð ;YÞ ¼HðXÞ þHðYÞ H Xð ;YÞ ¼HðXÞ H Xð =YÞ
ð10Þ In Eqs.9and10, X and Y represent pixel value of two adjacent bands.
Fig. 6 Comparison between classification maps of AVIRIS data for,a) Stan-dard SVMb) Naive Bayes fusion method 75 80 85 90 95 100
%5 train %10 train %20 train
Full Data WMV SVM NB SFFS SFBS Training Samples Ov erall accu racy
Fig. 5 Comparison between overall accuracies of different classification strategies on AVIRIS data
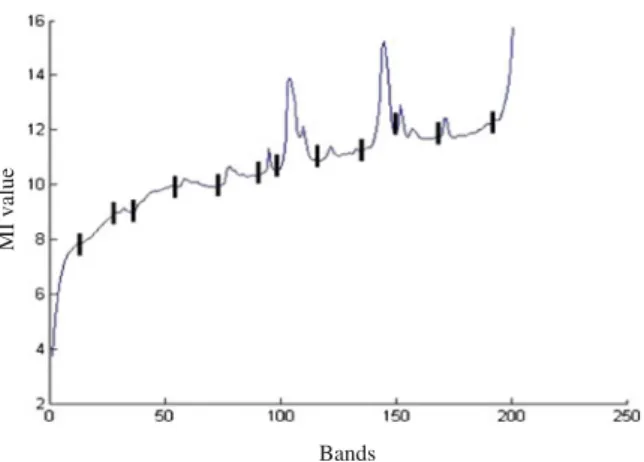
The basic principle of the band grouping is that the adjacent bands which have high correlation should be grouped into one group and the ones with little redun-dancy should be separated into different groups. Proposed method used Mutual Information to measure the correlation between adjacent bands.
The redundancy between two bands is greater when the value of MI is larger (Li et al. 2011). During the process of band grouping based on the MI, the basic principle is that the bands are divided into groups according to local minima points of bands’MI. These local minima points can be obtained automatically by comparing the neighbourhoods of every point.
After this initial band grouping, since the MI only considers the correlation between bands, Genetic Algorithm–Support Vector Machine (GA-SVM) searches for the best combination of bands with more similar information. Since there are hundreds of bands in the hyperspectral imagery, the search space for GA directly on the original band space will be too huge. First, mutual information is employed to partition the bands into disjoint subspace, thus getting the irredundant set of bands and reducing the search space at the same time. Second, GA–SVM is adopted to search for the optimal combination of bands (Li et al.2011). Classifier Fusion Based on Naive Bayes
Naive Bayes is a statistical classifier fusion method that can be used for fusing the outputs of individual classifiers. The essence of NB is based on the Bayesian theory (Kuncheva 2004). Denote by p(.) the probability. In Eqs.11,12and13Dj, (j=1,…,L) is ensemble of classifiers where s=[s1,…,sL] denote the output labels vector of the ensemble for unknown sample x. Also,ωk, (k=1,…,c) denote the class labels and c is the number of classes.
p Sð =wkÞ ¼p sð1;s2;. . .;sL=wkÞ ¼ YL i¼1
p sð i=wkÞ ð11Þ Then the posterior probability needed to labelxis
pðwk=SÞ ¼pð Þwk p Sð =wkÞ pðSÞ ¼ pð Þwk Q L i¼1 p Sð i=wkÞ pðSÞ ;k¼1;. . .;c ð12Þ The denominator does not depend onωkand can be ignored, so the final support for classωkis
μkðxÞ /pð Þwk YL
i¼1
p sð i=wkÞ ð13Þ
Where x is the sample of data with unknown class label. The maximum membership rule (μ) will label x inωkclass (winner class).
The practical implementation of the Naive Bayes (NB) method on a data set with cardinality N is explained below. For each classifier, a c×cConfusion MatrixCMiis calculated by testing data set (Kuncheva 2004). The (g, h)th entry of this matrix, cmi
k;h is the number of elements of the data set whose true class label wasωkand were assigned by the classifier to classωh. ByNhwe denote the total number of elements of data set from class ωh. Takingcmik;hi=Nk as an estimate of the
posterior probability, and Nk/N as an estimate of the prior probability, the final support of class ωk for un-known sample x is μkðxÞ / 1 NL1 k YL i¼1 cmik;hi ð14Þ
The maximum membership rule will labelxinωkclass. The Bayes classifier has been found to be surprising-ly accurate and efficient in many experimental studies. Kuncheva applied NB combination method on artificial data as classifier fusion strategy (Kuncheva2004). The NB classifiers have been successfully applied in text classification for example: Xu et al. (1992) applied NB as classifier fusion method in applications to handwrit-ing recognition. These researches have indicated the
Table 6 Correlation and diversity measures for AVIRIS data set Data Set Correlation Disagreement
(Diss)↓ Double Fault (DF)↑ Indian Pine 0.180 0.008 0.991 70 75 80 85 90 95 100 1 2 3 4 5 6 7 8 9 A ccu racy Class number Full data Fusion(WMV) Fusion(SVM) Fusion(NB)
Fig. 7 Comparison of class accuracies between standard SVM and fusion methods for AVIRIS data
considerable potential of Naive Bayes approach for the supervised classification of various types of data. SVM and Fusion Process
As mentioned in SVM-based MCS for Classification of Hyperspectral Image section after band grouping, SVM classifiers are separately applied to each group. It is worth underlining that the kernel-based implementation of SVMs involves the problem of the selection of mul-tiple parameters, including the kernel parameters (e.g., parameters for the Gaussian and polynomial kernels) and the regularization parameterC.
In our proposed method, the kernel of each individ-ual classifier is adjusted according to the correspond-ing band group properties. This paper utilized one-against-one multi class SVM with Radial Basis Function (RBF) kernel (see Eq.15) as base classifier (Imbault and Lebart2004).
K xð ;x0Þ ¼exp λkxx0k2
ð15Þ ParameterCis the cost of the penalty. The choice of value for parameterCinfluences the classification out-come. IfCis too large, then the classification accuracy rate is very high in the training stage, but very low in the testing stage. IfC is too small, then the classification accuracy rate is unsatisfactory, making the model use-less. Parameter γ has a much stronger impact than
parameter C on classification outcomes, because its value influences the partitioning outcome in the feature space. An excessive value for parameterγleads to over-fitting, while a disproportionately small value results in under-fitting. This paper utilized Grid search as a tech-nique to adjust parameters of kernels. The search range forC(SVM parameter) is in [2−2, 210], and [2−10, 22] for γ(Kernel Parameter). Grid search is the simplest way to determine the values for parameters C andγ. Sets of values for parametersCandγthat produce the highest classification accuracy rate in this interval are found by setting the upper and lower limits (search interval) for parameters C and γ and the jumping interval in the search. Various pairs of(C,γ)values are tried and the one with the best cross-validation accuracy is picked. Methods for obtaining the optimal parameters in the SVM are currently still under development. In this paper we applied this simple method to select the best param-eters of SVM classifiers. You can see more details in Hsu et al. (2010). After producing of single classifiers for the MCS, the proposed method applies three fusion strategies. The first one is a fusion strategy based on the Naive Bayes. The second method is Weighted Majority Voting (WMV) which is based on the voting strategies and can be applied to a multiple classifier system as-suming that each classifier gives a single class label as an output and is proposed by Kuncheva (2004). In this fusion method, overall accuracies of classifiers are in-troduced as the weights of the classifiers. In addition, the final fusion strategy used an additional SVM on the outputs of SVM classifiers. Outputs of each primary SVM on each band group used as new feature vector for new classification. All results from fusion strategies are compared to a standard SVM which is applied on full data with all hyperspectral bands.
Experimental Results Data Sets
The proposed method was tested on two well-known hyperspectral data sets. The first data set is made up of
Table 7 Final band grouping results on ROSIS data
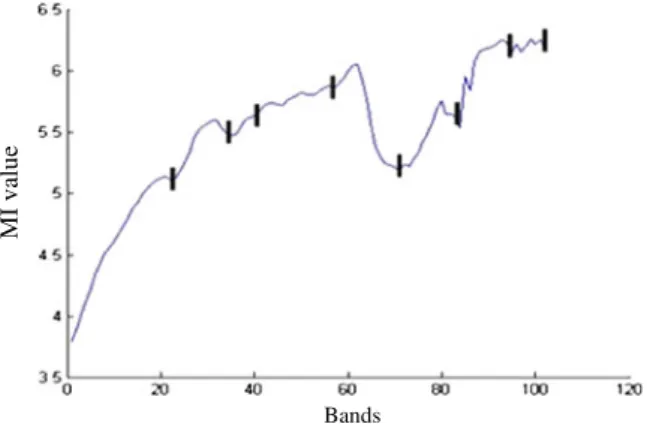
Groups 1 2 3 4 5 6 7 8 Bands 1–22 23–33 34–46 47–57 58–73 74–84 85–93 96–103 Bands MI v alu e
a 145*145 pixel portion of the AVIRIS image acquired over north-western US, Indian Pine, captured in June1992. The Indian Pine data is available in Purdue University site. The second data set is from Pavia University which is another common hyperspectral data set. This data has been captured by the German ROSIS sensor during a flight campaign over Pavia, northern Italy. AVIRIS data contains 220 spectral bands in wave-length range 0.4–2.5μm but not all of the 220 original bands are utilized in the experiments since 18 bands are affected by atmosphere absorption phenomena and are consequently discarded. Hence, the dimensionality for the AVIRIS Indian Pine data set is considered 202. In this experiment Fig.2shows original data and ground truth of the AVIRIS Indian Pine data. From the 16 different land-cover classes available in the original ground truth, seven are discarded; since only a few training samples related to these classes are available. The remaining nine land-cover classes are used to gen-erate the training and test data sets (Table1).
In ROSIS data, there exist 103 spectral bands which covering the wavelength range from 0.43 to 0.86μm. This data set exhibits 610*340 pixels with 1.3 m per pixel geometric resolution. Pavia University data is available in Pavia University site. Figure 3 and Table2show ROSIS Pavia University data set. Experimental Results on AVIRIS Data Set
In the first step of the proposed method, it is necessary to perform band grouping process based on the mutual
information processing in order to split hyperspectral data into band groups. Figure 4 shows the obtained results for AVIRIS data by using mutual information as similarity measure between adjacent bands. In this figure, local minima points correspond to the bands with low redundancy. Initial band groups would be produced based on these points. Moreover, a threshold is considered related to the minimum number of bands in each cluster. Table3shows the final band grouping results after pruning MI-based groups by applying GA-SVM. This table shows that the proposed band grouping method produced 12 combinations of bands on AVIRIS hyperspectral image.
After band grouping, one-against-one SVM was applied on 12 band clusters. As proposed in 5.2, proposed strategy applied grid search as the model selection of SVM classifier. The search range for C
is in [2−2, 210], and [2−10, 22] forγ.
Table 4 represents the overall accuracy of SVM classifiers which are applied to each band combina-tion. In order to investigate the impact of the number of labelled data on the classifier performance, all ex-periments were applied to different percentage of training and testing data sets. After producing the multiple of classifiers for AVIRIS data, three decision fusion strategies (i.e. Naive Bayes, Weighted Majority Voting and SVM) are applied to the results of band group’s classification. In order to show the merits of the proposed methodology, this paper compares a standard SVM on entire bands of AVIRIS data and two feature selection methods. The feature selection
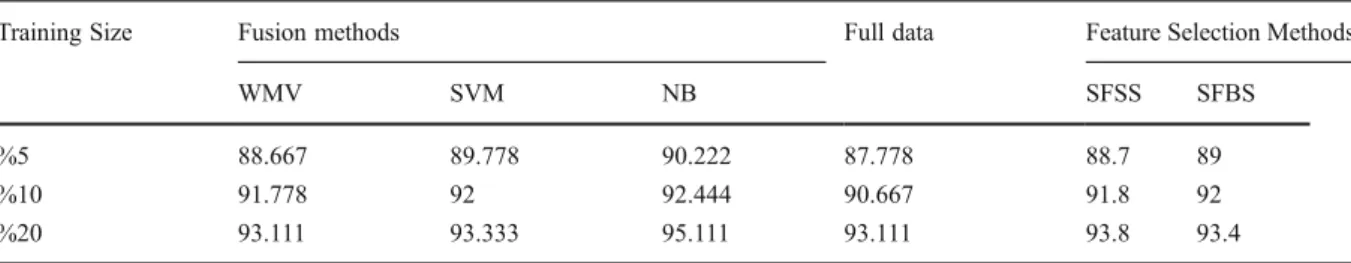
Table 9 Comparison between classification strategies on ROSIS data
Training Size Fusion methods Full data Feature Selection Methods
WMV SVM NB SFSS SFBS
%5 88.667 89.778 90.222 87.778 88.7 89
%10 91.778 92 92.444 90.667 91.8 92
%20 93.111 93.333 95.111 93.111 93.8 93.4
Table 8 Overall Accuracy of SVM classifiers on bands groups of ROSIS data for different training size Training size Band Group#1 Band Group#2 Band Group#3 Band Group#4 Band Group#5 Band Group#6 Band Group#7 Band Group#8 %5 60.778 52.333 52.446 49.778 60.778 61.556 55.348 45.231 %10 61.778 54 63.642 51.333 61.556 60.444 56.284 46.468 %20 62.333 54.866 64.111 53.556 62 66 57 47.021
strategies are the “sequential forward floating selec-tion” (SFFS) and the “sequential backward floating selection”(SBFS) techniques, which identify the best feature subset that can be obtained by starting from an empty set SFFS or from the complete set of features SFBS and adding to SFS or removing from SBS the current feature subset one feature at a time until the desired number of features are achieved. More details have been provided by Pudil et al., in (1994).
Table 5 compares the results of the three fusion strategies with standard SVM and with the feature selection methods for different percentage of train-ing samples. In terms of classification performance, this table shows that the resulting classification after classifier fusion is generally more accurate than standard SVM.
The overall results in Fig.5clearly demonstrate that the proposed multiple classifier system outperforms the feature selection strategies in terms of accuracy, irrespective of the number of training samples. This improvement benefits from splitting all bands of the
hyperspectral data into some band groups and apply-ing the multiple classifier system on the produced band groups.
From the classification accuracy viewpoint, all three fusion strategies resulted in satisfactory results when compared with the standard SVM. In more detail, the Naive Bayes fusion strategy represented the best accuracy with a gain in overall accuracy of 94 % with 20 % training samples that caused accuracy improvement of standard SVM up to 3.2 %. The analysis of Fig. 5 shows two other fusion methods, Weighted Majority Voting and SVM-based fusion; perform better than the standard SVM up to 0.88 % and 1.3 % respectively. Figure6shows the classifica-tion map for NB fusion method and standard SVM on AVIRIS data. This visual interpretation supports the results of the statistical accuracy assessment.
Figure 7 demonstrates the accuracies of different classification strategies for all nine classes of the AVIRIS data set. For some classes, one (e.g. Class 9#Woods), two (e.g. Class 6#Soybeans-no till) or all three (e.g. Class 7#Soybeans-minimum till) fusion algorithms perform better than the results of standard SVM in terms of classification accuracy. This suggests that the decomposition of hyperspectral classification problem into a multiple of classifiers represents an effective way of improving the overall discrimination capability.
As shown in Fig. 7, the NB fusion method out-performs most standard SVM class accuracies or at least achieves similar results. Although the NB
Fig. 10 Comparison between classification maps of ROSIS data for,a) Standard SVM andb) Naive Bayes fusion method
75 80 85 90 95 100
%5 train %10 train %20 train
Full Data WMV SVM NB SFSS SFBS Training Samples Ov erall accu racy
Fig. 9 Comparison between overall accuracies of different classification strategies on ROSIS data
method improves the overall accuracy of standard SVM and other fusion methods, there are still some classes for which this method produced lower accuracies than other methods specially for class 2 (Corn-minimum till) and class 4 (Grass/trees). Since the diversity and correlation between classifiers are the basic assumption of an ade-quate classifier combination, this paper also computed the measures Disagreement and Double Fault for the AVIRIS data set (Table6).
Results show that the MCS applied to AVIRIS data has low correlation and high diversity between classi-fiers. This is the most important cause of high perfor-mance of multiple classifier system in the proposed methodology.
Experimental Results on ROSIS Data Set
In order to prove the efficiency of the proposed meth-odology, further experiments are performed on the second hyperspectral data set. Regarding the band grouping similar results are obtained on ROSIS Pavia University data set as for AVIRIS data set but with fewer groups. Figure8 shows the mutual infor-mation result on 103 spectral bands of ROSIS data.
The initial band groups are generated based on the MI measures pruned by using the proposed GA-SVM strategy. Table7represents final 8 band groups on this data set. The results of SVM classifier for this data set are shown in Table8in terms of overall accuracies.
For comparative purposes, all three decision fusion methods, standard SVM and feature selection methods are applied on the ROSIS data set.
Similar to Table5for AVIRIS data, Table9compares results of fusion methods and standard classifier as well as feature selection strategies for ROSIS data set. It can be observed that all three decision fusion methods spe-cially NB improve the results of traditional classification results on full data. Figure9represents overall accura-cies of all applied classification strategies
The comparison of accuracy improvement of Bayesian fusion algorithm with respect to the standard SVM on two hyperspectral images illustrates that the AVIRIS data exhibited higher performance. The com-parison of the results of Tables5 and9show that this improvement for AVIRIS data is 3.2 % while it is 2 % for the ROSIS data.
Figure10represents the visual classification results of standard classification and NB fusion methods for ROSIS data. In order to compare the classification
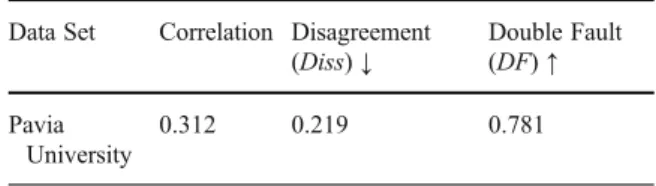
methods in terms of single class accuracies, Fig. 11 illustrates class accuracies for all classification strate-gies. Similar to results on first hyperspectral image, Bayesian fusion strategy (NB) outperforms standard SVM. However, for class 1 (Trees) and class 8 (Self-Blocking Bricks), NB method exhibits lower accura-cies in comparison with the standard classifier. Finally, Table 10 demonstrates the correlation and diversity measures of the classifiers in MCS for the ROSIS data. The comparison between the results of the two data sets shows that the MCS for the first data set is superior with respect to correlation and diversity mea-sures. It means that multiple classifier system for the AVIRIS data set exhibits higher diversity and lower correlation measures in comparison ROSIS data.
Discussion and Conclusion
In this paper, the performance of a SVM based multi-ple classifier system for classification of hyperspectral imageries is assessed. The proposed approach applies a band grouping system based on the modified mutual information on hyperspectral image, in order to split it into few band groups. After that SVM classifiers are trained on each group to produce a multiple classifier system. Finally decision fusion strategies are applied to fuse the decisions of all the classifiers.
The first objective of the proposed method con-cerns the effectiveness of the band grouping strategy
Table 10 Correlation and diversity measures for ROSIS data set
Data Set Correlation Disagreement (Diss)↓ Double Fault (DF)↑ Pavia University 0.312 0.219 0.781 70 75 80 85 90 95 100 1 2 3 4 5 6 7 8 9 A ccu racy Class number Full data Fusion(WMV) Fusion(SVM) Fusion(NB)
Fig. 11 Comparison of class accuracies between standard SVM and fusion methods for ROSIS data
to solve the high dimensionality problem of hyperspectral data. Some previous researches only tried to select useful bands in dimension reduction t e c h n i q u e s t o o v e r c o m e d a t a r e d u n d a n c i e s . Nevertheless, the main drawback of dimension reduc-tion techniques is related to the loss informareduc-tion through elimination of some bands. Using band group-ing, the proposed method tries to overcome this weak-ness by enabling the use of the entire high dimensional hyperspectral image space. Using the conventional SVM for the whole heterogeneous data requires the definition of one single kernel function, which may not be suitably adapted to the whole diversity of information. It might be more adequate to take advan-tage of this heterogeneity by splitting the data into a few distinct subsets, defining a kernel function that is adapted for each data source separately and fuses the derived outputs. To achieve this, band grouping step of the proposed method overcomes this difficulty. In fact, the kernel of each individual classifier on each band cluster is adjusted according to the correspond-ing properties of those band clusters.
The second objective of the work is concerned with combining different classification results to improve the classification accuracy. Multiple classifier systems
–combining the results of a set of base learners–have demonstrated promising capabilities in improving classification accuracy. As result, in this paper all decision fusion algorithms outperformed standard SVMs which use the entire set of bands of the hyperspectral image. Comparing the results of all the experiments carried out on the two considered datasets show that the proposed SVM-based MCS provided higher accuracy than an SVM standard classifier and feature selection strategies. Because of the high ro-bustness and accuracy of Bayesian decision fusion method (NB) this method outperforms the two other fusion strategies.
In comparison with the other research papers in terms of classification accuracy, Ceamanos and his colleagues (2010) received approximately 91 % over-all accuracy for 25 % of training samples with 6 classifiers on Indiana data set in a SVM ensemble system while the results were improved by our pro-posed method to be up to 3 % for 12 classifiers. The results obtained by the proposed MCS classification approach gave both better classification accuracies and a higher robustness compared to the traditional classi-fiers as conclusion of this paper. Further studies will
focus on the new decision fusion methods, novel band grouping strategies and using of new classification methods especially fuzzy classifiers. In addition, to improve classification results after solving Hughes problem, the spatial information can be integrated.
References
Benediktsson, J. A., & Kanellopoulos, I. (1999). Classification of multisource and hyperspectral data based on decision fusion. IEEE Transactions on Geoscience and Remote Sensing, 37(3), 1367–1377.
Camps-Valls, G., & Bruzzone, L. (2005). Kernel-based methods for hyperspectral image classification. IEEE Transaction on Geoscience and Remote Sensing, 43(6), 1351–1362.
Ceamanos, X., Waske, B., Benediktsson, J., Chanussot, J., Fauvel, M., & Sveinsson, J. (2010). A classifier ensemble based on fusion of support vector machines for classifying hyperspectral data. International Journal of Image and Data Fusion, 1(4), 293–307.
Del Frate, F., Pacifici, F., Schiavon, G., & Solimini, C. (2007). Use of neural networks for automatic classification from high-resolution images.IEEE Transactions on Geoscience and Remote Sensing, 45(4), 800–809.
Goebel, K., Yan, W., & Cheetham, W. (2002). A Method to Calculate Classifier Correlation for Decision Fusion, Proceedings of IDC (Information, Decision Control Conference) 2002, Adelaide, pp. 135–140.
Goel, P. K., Prasher, S. O., Patel, R. M., Landry, J. A., Bonnel, R. B., & Viau, A. A. (2003). Classification of hyperspectral data by decision trees and artificial neural networks to identify weed stress and nitrogen status of corn.Computers and Electronics in Agriculture, 39(2), 67–93.
Guo, B., Gunn, S. R., Damper, R. I., & Nelson, J. D. B. (2006). Band selection for hyperspectral image classification using mutual information.IEEE Geoscience and Remote Sensing Letters, 3(4), 522–526.
Hsu, C.-W., Chung, C.-C., & Lin, C.-J. (2010). A Practical Guide to Support Vector Classification. National Taiwan University, March 13, 2010 [Online]. Available:www.csie.ntu.edu.tw/_cjlin Imbault, F., & Lebart, K. (2004). A stochastic optimization approach for parameter tuning of support vector machines, Proceedings of the 17th International Conference on Pattern Recognition (ICPR 2004),4, 597–600.
Jia, X. (2002). Simplified maximum likelihood classification for hyperspectral data in cluster space. IEEE International Geoscience and Remote Sensing Symposium, 2002 (IGARSS
’02), 5, 2578–2580.
Kuncheva, L. (2004). Combining Pattern Classifiers methods and algorithms. Hoboken: John Wiley & Sons, INC. Publication.
Kuncheva, L., & Whitaker, C. (2003). Measures of diversity in classifier ensemble and their relationship with the ensemble accuracy.Machine Learning, 51(2), 181–207.
Li, S., Wu, H., Wan, D., & Zhu, J. (2011). An effective feature selection method for hyperspectral image classification based on genetic algorithm and support vector machine.
Knowledge-Based Systems, 24(1), 40–48.
Martinez-Uso, A., Pla, F., Sotoca, J.M., & Garcia-Sevilla, P. (2006). Clustering based multispectral band selection using mutual information. In Proceedings of the 18th International Conference on Pattern Recognition (ICPR).
2, 760–763.
Melgani, F., & Bruzzone, L. (2004). Classification of hyperspectral remote sensing images with support vector machines.IEEE Transaction on Geosciences and Remote Sensing, 42(8), 1778–1790.
Müller, K. L., Mika, S., Rätsch, G., Tsuda, K., & Schölkopf, B. (2001). An introduction to kernel-based learning algo-rithms. IEEE Transaction on Neural Network, 12(2), 181–202.
Prasad, S., & Bruce, L. M. (2008). Decision fusion with confidence based weight assignment for hyperspectral target recognition.
IEEE Transaction on Geosciences and Remote Sensing, 46(5), 1448–1456.
Pudil, P., Novovicova, P., & Kittler, J. (1994). Floating search methods in feature selection.Pattern Recognition Letter, 15
(11), 1119–1125.
Ruta, D., & Gabrys, B. (2000). An overview of classifier fusion methods.Computing and Information Systems, 7
(1), 1–10.
Scholkopf, B., & Smola, A. J. (2002).Learning with kernels, support vector machines, regularization, optimization and beyond. Cambridge: MIT Press.
Tarabalka, Y., Fauvel, M., Chanussot, J., & Benediktsson, J. (2010). SVM- and MRF-based method for accurate classi-fication of hyperspectral images.IEEE Geosciences and Remote Sensing letters, 7(4), 736–740.
Vaiphasa, C. (2003). Innovative genetic algorithm for hyperspectral image classification, In Proceeding of International Conference of Map Asia, pp. 20.
Vapnik, V. N. (1998).Statistical learning theory. New York: Wiley. Waske, B., & Van der Linden, S. (2008). Classifying multilevel imagery from SAR and optical sensors by decision fusion.
IEEE Transactions on Geosciences and Remote Sensing, 46
(5), 1457–1466.
Watanachaturaporn, P., & Arora, M. K. (2004). Support vector machines for classification of multi- and hyperspectral data. In P. K. Varshney & M. K. Arora (Eds.), Advanced image processing techniques for remotely sensed hyperspectral data (pp. 237–255): Springer-Verlag.
Weston, J., & Watkins, C. (1999). Support vector machines for multiclass pattern recognition. In The Seventh European Symposium on Articial Neural Networks, pp. 219–224. Xu, L., Krzyzak, A., & Suen, C. Y. (1992). Methods of
com-bining multiple classifiers and their applications to hand-writing recognition.IEEE Transactions on Systems, Man, and Cybernetics, 22(3), 418–435.