ML-EWS: Machine Learning Early Warning System
The application of machine learning to predict in-hospital
patient deterioration
Dr Vishal Nangalia
UCL
This dissertation is submitted for the degree of
Doctor of Philosophy
I, Vishal Nangalia confirm that the work presented in this thesis is my own. Where
information has been derived from other sources, I confirm that this has been
indicated in the thesis.
Acknowledgements
I would like to thank Dr David Barber for his guidance on machine learning and its application, and from which I have learnt a great deal. Dr Reecha Sofat for her unequivocal support in the final lap. I must also thank the Medical Research Council and NHS England for funding my research. Thanks also go to the Division of Medicine for supporting my project and helping smooth over the many bumps along the way, especially to Prof Raymond Macallister, Dr Dave Spratt and Prof Robin McAnulty.
I would like thank numerous people who helped me during this research. Dr David Prytherch, Prof Gary Smith and Dr Tony Wolf, who inspired me to embark on this research. Trevor Peacock for his guidance on all things related to data protection and information governance. Tabitha Kavoi, for her patience in helping me navigate the ethics process and her ongoing support for the institutional management of my research. John Adams, for setting up and sorting out my unique IT requirements. Dr Anne Dawnay, for her expertise on everything related to blood results and acute kidney injury.
My local principal investigators, for believing in this research and enrolling their institutions into the study. The research and information teams at all the hospitals that took part in the study, without whom I would not have had the data for this project. Simon Brown, Ani Dwarakanath and Prashant Lele, for believing in my vision of Patient Rescue, helping to mould it, and working well beyond the call of duty to help bring it to fruition. Looking forward to continuing this journey together.
I would also like to thank the NHS England Clinical Entrepreneurship Programme for the ongoing opportunity to help translate this research into clinical practice. It is truly an honour to be part of this inaugural cohort of Clinician Entrepreneurs.
I could not have accomplished this project without the unwavering support of my friends. Thanks to my ‘Exponential Medicine’ friends, for their inspiration, optimism, energy and belief that we can and will positively transform healthcare, in particular Jack, Laurence, and Milind for being the crazy human beings that you are. Ambrita, David, Kirsten, Maxine, Navin, Lee, Li, James, Victoria, Yulia for being awesome, fun and reminding me to focus on life and not just work. Chris for all those out of the box discussions. Damien, Paul, Julien and especially Peter, for their legal prowess. Roman, for all the squash sessions and Vidhya, for all those concerts.
Finally, this work would not have been possible without the unremitting support of my family. Mum, Dad, Jyoti, thank you for your love and for putting things in perspective.
Abstract
Preventing hospitalised patients from suffering adverse event (AEs) (unexpected cardiac, arrest, intensive care unit admission, surgery or death) is a priority in healthcare. Almost 50% of these AEs, caused by mistakes/poor standards of care, are thought to be preventable. The identification and referral of a patient at risk of an AE to a dedicated rapid response team is a key mechanism for their reduction.
Focussing on variables that are routinely collected and electronically stored (blood test data, and administrative data: demographics, date and method of admission, and co-morbidities), along with their trends, I have collected data on ~8 million admissions. I have explained how to navigate the complex ethical and legal landscape of performing such an ambitious data linkage and collection project.
Analysing data on ~2 million hospital admissions with an in-hospital blood test result, I have
1. described how these variables (particularly urea and creatinine blood tests, method of admission, and date of admission) influence in-hospital mortality rate in different groups of patient.
2. created four machine learning (ML) models that have the highest accuracy yet described for identifying a patient at risk of an SAE, while at the same time capturing the majority of patients likely to die (high sensitivity). These models ML-Dehydration, ML-AKI, ML-Admission, and ML-Two-Tests, can be applied to admissions with limited data, specific syndromes, or on all patients in hospital at different time points in their hospital trajectory respectively. Their area under the receiver operator curves are 79.6%, 85.9%, 93% and 90.6% respectively.
3. built and deployed a technology platform Patient Rescue that allows for the automated application of any model in any hospital, as well as the communication of rich patient level reports to clinicians, all in real-time.
Table of Contents
Acknowledgements _________________________________________________________ 3
Abstract ___________________________________________________________________ 4
Table of Contents ___________________________________________________________ 5
List of Figures ______________________________________________________________ 9
List of Tables ______________________________________________________________ 11
Chapter 1: Introduction _____________________________________________________ 16
1.1 Introduction ________________________________________________________________ 16 1.2 The Problem ________________________________________________________________ 18 1.3 The Current Solution: Rapid Response Systems _____________________________________ 201.3.1 The Efferent Limb: Rapid Response Team _____________________________________________ 20 1.3.2 The Afferent Limb: Vital Sign EWSCs _________________________________________________ 21 1.3.3 Issues with Vital Sign EWSCs ________________________________________________________ 24
1.3.3.1 Poor measurement of vital signs _________________________________________________ 24 1.3.3.2 Poor positive predictive value in the identification of the high-risk/deteriorating patient ____ 24
1.4 An Alternative Afferent Limb: Use of Laboratory Data _______________________________ 25 1.4.1 Simple single parameter: Reference intervals ____________________________________ 26
1.4.2 Simple dual-parameter: Dehydration (urea to creatinine ratio): ____________________________ 29 1.4.3 Dynamic single-parameter: Acute Kidney Injury (AKI) ____________________________________ 31 1.4.4 Aggregated multi-parameter _______________________________________________________ 34
1.5 Machine Learning and application to health care ___________________________________ 37
1.5.1 Random Forest __________________________________________________________________ 39 1.5.2 Gradient Boosted Models __________________________________________________________ 39 1.5.3 Software toolkits _________________________________________________________________ 39 1.5.4 Key concepts ____________________________________________________________________ 40
1.6 Aims and Objectives __________________________________________________________ 42
1.6.1 Aim ___________________________________________________________________________ 42 1.6.2 Objectives ______________________________________________________________________ 42
Chapter 2: The Data, Ethical and Legal Frame ____________________________________ 43
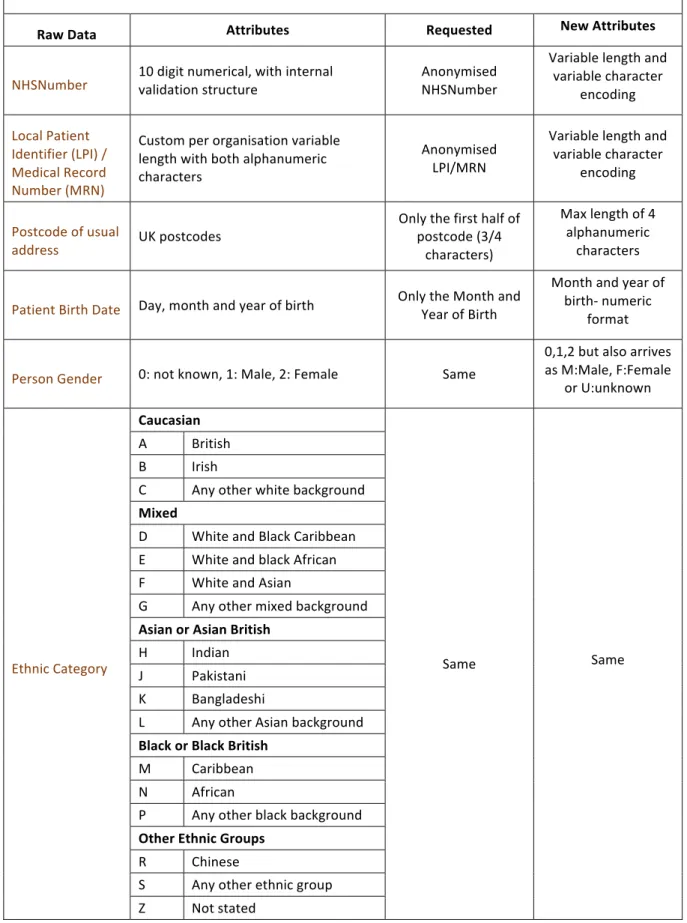
2.1 The Data ___________________________________________________________________ 43
2.1.2 Blood results ____________________________________________________________________ 51
2.2 The Ethical and Legal Framework ________________________________________________ 55
2.2.1 The ethical and legal considerations for conducting research with ‘grey area’ anonymised data __ 57
2.2.1.1 Care.Data ___________________________________________________________________ 59
2.2.2 My Approach ____________________________________________________________________ 60
2.3 Data Acquisition and Pre-Processing _____________________________________________ 64
2.3.1 Data Acquisition _________________________________________________________________ 64 2.3.1 Pre-Processing of the Collected Data _________________________________________________ 67
2.3.1.1 Data Ingestion _______________________________________________________________ 67 2.3.1.2 Data Transformation __________________________________________________________ 68 2.3.1.3 Data Cleaning ________________________________________________________________ 71
Chapter 3 Dehydration: simple dual parameter to ML _____________________________ 74
3.1 Objectives __________________________________________________________________ 74 3.2 Methods ___________________________________________________________________ 75
3.2.1 Data ___________________________________________________________________________ 75 3.2.2 Analysis ________________________________________________________________________ 75
3.2.2.1 Rationale for ML analysis ______________________________________________________ 77
3.2.3 Statistical Analysis ________________________________________________________________ 77
3.3 Results _____________________________________________________________________ 77
3.3.1 Basic characteristics ______________________________________________________________ 77 3.3.2 Prevalence of raised Ur:Cr ratio and AKI ______________________________________________ 77 3.3.3 Length of stay of survivors (Table 3.3) ________________________________________________ 78 3.3.4 In-hospital mortality ______________________________________________________________ 80 3.3.5 Predicting mortality: ML-Dehydration ________________________________________________ 85
3.4 Discussion __________________________________________________________________ 86
Chapter 4: Acute kidney injury: dynamic single parameter to ML ____________________ 89
4.1 Introduction ________________________________________________________________ 89 4.2 Objectives __________________________________________________________________ 90 4.3 Methods ___________________________________________________________________ 91
4.3.1 Patients ________________________________________________________________________ 91 4.3.2 Data ___________________________________________________________________________ 91 4.3.3 Statistical and ML Analyses _________________________________________________________ 92
4.4 Results _____________________________________________________________________ 96
4.4.2 Epidemiology / Variation in Prevalence and Progression of AKI Admissions _________________ 100 4.4.3 AKIlast and false-negative-AKI ______________________________________________________ 107
4.4.4 Variation of Drrt in AKI admissions __________________________________________________ 107 4.4.5 ML Model: ML-AKI ______________________________________________________________ 110 4.5 Discussion _________________________________________________________________ 113
Chapter 5: ML EWSCs ______________________________________________________ 116
5.1 Introduction _______________________________________________________________ 116 5.2 Objectives _________________________________________________________________ 116 5.3 Methods __________________________________________________________________ 117 5.3.1 Patients _______________________________________________________________________ 117 5.3.2 Data __________________________________________________________________________ 117 5.3.3 ML ___________________________________________________________________________ 118 5.4 Results ____________________________________________________________________ 122 5.4.1 Admission_Cohort _______________________________________________________________ 122 5.4.1.1 Baseline Characteristics _______________________________________________________ 122 5.4.1.2 ML-Admission Model ________________________________________________________ 128 5.4.2 Two_Tests_Cohort ______________________________________________________________ 130 5.4.2.1 Baseline characteristics _______________________________________________________ 130 5.4.2.2 ML-Two-Tests Model _________________________________________________________ 136 5.5 Discussion _________________________________________________________________ 137Chapter 6: Patient Rescue: technology platform _________________________________ 142
6.1 Introduction _______________________________________________________________ 142 6.2 The Challenges _____________________________________________________________ 143
6.2.1 Access ________________________________________________________________________ 143 6.2.2 Analytics ______________________________________________________________________ 144 6.2.3 Clinical Communication __________________________________________________________ 145
6.3 The Solution: Patient Rescue __________________________________________________ 145
6.3.1 System Overview _______________________________________________________________ 145 6.3.2 System Schematic _______________________________________________________________ 146 6.3.3 Component Description __________________________________________________________ 147 6.3.3.1 HL7 Gateway _______________________________________________________________ 147 6.3.3.2 NHUB _____________________________________________________________________ 147 6.3.3.3 Service Bus _________________________________________________________________ 147 6.3.3.4 CDS.APC Gateway ___________________________________________________________ 148 6.3.3.5 Algorithms _________________________________________________________________ 148
6.3.3.6 Alert Service ________________________________________________________________ 148 6.3.3.7 SQL Server Reporting Services (SSRS) ____________________________________________ 149
Chapter 7: Summary and Discussion __________________________________________ 152
8 References _____________________________________________________________ 161
Appendices ______________________________________________________________ 168
Appendix 1: Table: Commissioning Data Sets ________________________________________ 168 Appendix 2: ML-EWS Research Protocol ____________________________________________ 171
List of Figures
Figure 1.1: Comparison between a Traditional Code Team and Rapid Response Team 21
Figure 1.2: Single-parameter MET calling criteria 22
Figure 1.3: Multi-parameter EWSC 23
Figure 1.4: National Early Warning Score (NEWS) 23
Figure 1.5: National Early Warning Score (NEWS) escalation criteria 23 Figure 1.6: Individual blood test result: Odds ratio for in-hospital mortality 28 Figure 1.7: Individual blood test results: Area under the receiver operator cure for in-hospital
mortality 28
Figure 1.8: The NHS England Acute Kidney Injury Algorithm (NHSE-AKI algorithm) 33
Figure 1.9: Stage-based management of AKI 34
Figure 3.1: Consort Diagram 78
Figure 3.2: Age at Admission 79
Figure 3.3: Histogram of Admission Urea:Creatinine Ratios 79
Figure 3.4: Urea:Creatinine (Admission and Last) vs Mortality 82 Figure 3.5: Heatmap: Admission Ur:Cr vs Percent Change vs Mortality 83
Figure 3.6: Heatmap: Last Urea vs Creatinine vs Mortality 83
Figure 3.7: Heatmap: Admission Ur:Cr vs Age vs Mortality 84
Figure 3.8: Heatmap: Last Ur:Cr vs Age vs Mortality 84
Figure 3.9: Area Under the Receiver Operator Curve (AUROC) 85
Figure 4.1: Consort Diagram 97
Figure 4.2: Histogram of Age and Chronic Kidney Disease status 97 Figure 4.3: Prevalence of Max AKI by trigger route and Chronic Kidney Disease (CKD) status 104 Figure 4.4: Died or Renal Replacement Therapy (Drrt) Incidence 109 Figure 4.5: AKI Died or Renal Replacement Therapy (Drrt) Incidence for each CKD group 109 Figure 4.6: Heatmap: Died or Renal Replacement Therapy (Drrt) Rate for Max Cr:BCr vs Max
Creatinine vs Mortality 110
Figure 4.7: ML-AKI Model: Area Under the Receiver Operator Curve 85.9% 111
Figure 5.1: Histogram of Age 123
Figure 5.2: ML- Admission: Receiver Operator Curve (AUROC 93%) 129 Figure 5.3: ML-Admission: Scaled variable importance for the top 25 variables 129
Figure 5.4: Histogram of Age 130
Figure 5.5: ML-Two-Tests: Receiver Operator Curve (AUROC 90.6%) 136 Figure 5.6: ML-Two-Tests: Scaled variable importance of the top 25 variables 136
List of Tables
Table 1.1: Kidney Disease Improving Global Outcomes (KDIGO) Staging of AKI 32
Table 1.2: Existing aggregated multi-parameter EWSC 35
Table 2.1: Patient characteristics 47
Table 2.2: Hospital provider spell characteristics 48
Table 2.3: Blood Result Characteristics 51
Table 2.4: List of all NHS Trusts participating in the ML-EWS Study 66 Table 3.1: Predictor Variables for the Machine Learning Model (ML-Dehydration) 76
Table 3.2: Baseline Characteristics 79
Table 3.3: Length of Stay of Survivors: Emergency admissions 80
Table 3.4: Mortality: Emergency admissions 81
Table 3.5: Relative Risk of Death for unresolved or worsening Ur:Cr and AKI 82 Table 3.6: Baseline characteristics of the train and test datasets 85
Table 4.1: ML-AKI Model Variables 93
Table 4.2: Baseline Characteristics 98
Table 4.3: Correlation Coefficients 100
Table 4.4: Ethnicity 101
Table 4.5: Date of Admission 102
Table 4.6: Method of Admission 103
Table 4.7: Co-morbidities: Prevalence/Drrt rates in AKI admissions 105
Table 4.8: First AKI to Max AKI stage 107
Table 4.9: Drrt rates/positive predictive values 108
Table 4.10: ML-AKI Variable Importance 112
Table 5.1: ML-Admission: Variables 119
Table 5.2: ML-Two-Tests: Variables 121
Table 5.3: Admission_Cohort: Ethnic category prevalence, and in-hospital mortality rates 124 Table 5.4: Admission_Cohort: Method of admission prevalence and in-hospital mortality rates 125 Table 5.5: Admission_Cohort: Month of admission prevalence and in-hospital mortality rates 126 Table 5.6: Admission_Cohort: Day of admission prevalence and in-hospital mortality rates 126
Table 5.7: Admission_Cohort: Prevalence of ICD10 codes 127
Table 5.8: Admission_Cohort: Median (Interquartile Range) of Blood Tests 128 Table 5.9: Two_Tests_Cohort: Ethnic category prevalence, and in-hospital mortality rates 131 Table 5.10: Two_Tests_Cohort: Method of admission prevalence and in-hospital mortality rates 132 Table 5.11: Two_Tests_Cohort: Month of admission prevalence and in-hospital mortality rates 134 Table 5.12: Two_Tests_Cohort: Day of admission prevalence and in-hospital mortality rates 134
Table 5.13: Two_Tests_Cohort: Prevalence of ICD10 codes 135 Table 5.14: Two_Tests_Cohort: Median (Interquartile Range) of Blood Tests 135
Abbreviations
AE Adverse Events
AKI Acute Kidney Injury
ALB Albumin
AUROC Area Under the Receiver Operator Curve
BCr Baseline Creatinine
BHOM Biochemistry and Haematology Outcome Model
Bili Bilirubin
BUN Blood Urea Nitrogen
CCMDS Critical Care Minimum Data Set
CDL Clinical Decision Limit
CDS Commissioning Data Set
CDS.APC Commissioning Dataset for Admitted Patient Care
CKD Chronic Kidney Disease
COPD Chronic Obstructive Pulmonary Disease
CQC Care Quality Commission
CQUIN Commissioning for Quality and Innovation
Cr Creatinine
CRB Criminal Records Bureau
CRN Clinical Research Network
DBS Disclosure and Barring Service
Drrt Died or Renal Replacement Therapy
ECG Electrocardiograph
eGFR estimated glomerular filtration rate
EWS Early Warning System
EWSC Early Warning Score
GF Gradient Boosting
GPs General Practitioners
Hb Haemoglobin
Hct Haematocrit
HES Hospital Episode Statistics
HRA Health Research Authority
HRG Healthcare Resource Group
ICD10 International Classification of Diseases Version 10
ICO Information Commissioners Office
ICU Intensive Care Unit
IQR Inter Quartile Range
IT Information Technology
K Potassium
KDIGO Kidney Disease Improving Global Outcomes
LIMS Laboratory Information Management System
LOINC Logical Observation Identifiers Names and Codes
LPI Local Patient Identifier
MARS Medical Admissions Risk System
Max Maximum
MCV Mean Cell Volume
MET Medical Emergency Team
Min Minimum
ML Machine Learning
ML-EWS Machine Learning Early Warning System
MRN Medical Record Number
Na Sodium
NCEPOD National Confidential Enquiry into Patient Outcome and Death
NEWS National Early Warning Score
NHS National Health Service
NHSE National Health Service of England
NHSE-AKI National Health Service of England Acute Kidney Injury NICE National Institute of Health and Care Excellence
NLMC National Laboratory Medicines Catalogue
NPEx National Pathology Exchange
NWIS National Wales Informatics Service
OPCS Office of Population Censuses and Surveys
OPCS-4 OPCS Classification of Interventions and Procedures, version 4
PDF Portable Document Format
Plts Platelets
P-POSSUM Portsmouth Physiology and Operative Severity Score for enUmeration of Mortality
PPV Positive Predictive Value
PSA Patient Safety Alert
QAPI Quality Assessment and Performance Improvement
RCP Royal College of Physicians
REC Research Ethics Committee
RF Random Forest
RI Reference Interval
RRS Rapid Response System
RRT Rapid Response Team
RV Reference Value
SHA Secure Hash Algorithm
SQL Structured Query Language
SSRS SQL Server Reporting Services
UCL University College London
UK United Kingdom
ULRI Upper Limit of Reference Interval
Ur Urea
Ur:Cr Urea to Creatinine Ratio
USA United States of America
USB Universal Serial Bus
ViEWS Vitalpac Early Warning Score
WCC White Cell Count
Chapter 1: Introduction
1.1 Introduction
My responsibilities as an anaesthesiologist apart from intraoperative anaesthesia include the management of patients who have had a cardiac arrest (as a member of the cardiac arrest team), the optimisation of patients who need emergency surgery, and assisting in the management of patients who have severely deteriorated and are peri-arrest (as a member of the outreach team). When I am referred these patients I almost always notice, a) their physiological deterioration had been going on for some time prior to them being referred to me, and b) important interventions, whether they were additional tests or treatments, were either not done or were delayed. I believe that early identification, enabling immediate appropriate intervention, would prevent such patient deterioration. This early identification needs to occur in the resource constrained environment of the healthcare system (e.g. it must not require expensive additional tests), and must fit in with existing modes and processes of clinical care (i.e. there must be simple mechanisms for its implementation). The challenges are therefore to demonstrate a) that early identification is possible using existing data, and 2) a system to enable this early identification can be implemented that fits into both existing clinical workflows, and integrates with existing healthcare information technology (IT). This belief and drive to improve patient care are the motivations behind my doctoral research. My hypothesis is- “Better understanding of already captured clinical data, using machine learning, and the application of advanced information technology can enable early, automatic and real time identification of all hospitalised patients at risk of future deterioration”.
Adverse events (AE) are defined as harm to a patient as a result of medical care or those that occur within a health care setting1. These include unexpected prolongation of hospitalisation, cardiac arrest,
emergency surgery, emergency intensive care admission, and patient death. They may also include any untoward medical occurrence that result in persistent or significant disability, congenital abnormality, or birth defect. The primary focus of this research will be on the AE of in-hospital patient death.
An AE indicates that the care resulted in an undesirable clinical outcome and may have involved errors, negligence, or poor-quality care. Although this does not necessarily mean that the events were preventable2, a significant number appear to be of this type. For example, a 2010 United States of
America (USA) Government Investigation found that ‘44% of AEs were clearly or likely preventable’3.
patients received good care4. Disease-specific reports support these findings: only 50% of patients who
died of acute kidney injury (AKI) received ‘good’ care5. 20–30% of the total number of AKI cases (fatal
and non-fatal) were regarded as being preventable. Intervention-specific reports, in this case regarding the administration of intravenous fluids, found that a significant number of hospitalised patients were dying as a result of the infusion of too much or too little fluid6.
The potential for improving the quality of in-hospital care, and for the reduction of adverse outcomes, is clear. These goals have been incorporated in national clinical guidelines in the UK6,7, highlighted in
government and patient reports4,5,8,9,10,11,12, and linked to reimbursement via quality improvement
metrics13,14. The UK, National Institute for Health and Care Excellence (NICE), National Confidential
Enquiry into Patient Outcome and Death (NCEPOD) and the Royal College of Physicians (RCP) all advocate programmes to reduce AE frequency through the early recognition of patient decline. In the USA, as a condition of participation in the Medicare and Medicaid programmes, Federal regulations require that hospitals develop and maintain Quality Assessment and Performance Improvement (QAPI) Programmes13. As a part of their QAPI programmes, hospitals must ‘track medical errors and
adverse patient events, analyse their causes, and implement preventative actions’. In the UK, commissioning for quality and innovation (CQUIN) payments14 are similar vehicles for prioritising AE
reduction in hospitals.
Fulfilling these requirements of reducing AEs is a challenge. The substantial and continuously rising cost of healthcare dictates, in my opinion, that it is economically unfeasible to address the problems of AEs by simply increasing funding for the healthcare services. Instead, improved quality of care must accompany increased healthcare efficiency.
The key components of a programme of cardiac arrest reduction, as an example of an AE, have been described as a ‘Chain of Prevention’15, requiring the successful implementation of all the following:
§ Education: Recognition of the signs of deterioration; appreciating clinical urgency; use of an early-warning score; when and how to use simple interventions; successful teamwork and organization; and end-of-life care.
§ Monitoring: Includes patient assessment and measurement, and recording of vital signs.
§ Recognition of all patients likely to deteriorate in the near future, or currently declining. This is difficult to achieve, and failure to do so is one of the most common features of AEs.
§ Call for help (communication): Communication of this deterioration to the appropriate clinical team (e.g. the rapid response team (RRT)).
§ Response (intervention) that successfully stabilises the patient or prevents the deterioration from occurring. Many countries have introduced RRTs to which deteriorating patients can be referred.
For my doctoral research, I have focussed on ‘Recognition’ of the deteriorating patient, using a different modality of monitoring the patient. Existing programmes of ‘Monitoring’ of patients rely on the measurement of vital signs7. Utilisation of laboratory blood test results, with patient administrative
data, could be a novel alternative. It is possible that an early warning score (EWSC) based on multiple variables (including but not limited to patient demographics, co-morbidities, and admission dates) may have a high accuracy in identifying those who are at an increased risk to suffer AEs. Because these data are quality-controlled and stored electronically, theoretically this should make them easy to access, and amenable to complex computational analysis. In this thesis I have first applied advanced analytical techniques, specifically machine learning, to laboratory and administrative data, to build models that predict which hospitalised patients are likely to suffer an AE (with a particular focus on mortality). Second, I have built an advanced computer system (‘Patient Rescue’) that enables the application of such models to any healthcare provider in the world.
1.2 The Problem
A significant proportion of hospitalised patients receive sub-optimal care7. This leads to increased
mortality and morbidity. Key factors in this sub-optimal care of patients are: 1) the lack of recognition of the seriousness of a patient’s condition on first presentation to a hospital; 2) lack of recognition of a patient’s subsequent clinical deterioration while in hospital; and 3) despite indications of clinical deterioration being present, it is neither appropriately recognised nor acted upon7. Multiple reports
from the UK NCEPOD have focussed on these issues and highlighted that many cases may have been preventable. A summary of each of these influential reports is described below.
§ ‘An Acute Problem’, published in 20058, focussed on patients admitted to the Intensive Care Unit
(ICU). Among its key findings it found that ‘Patients often had prolonged periods of physiological instability prior to admission to ICU. In patients who had been in hospital more than 24 hours prior to ICU admission, 66% exhibited physiological instability for more than 12 hours.’ The report also highlighted the inadequacy of physiological monitoring, and the lack of both early warning systems (EWS) and critical care outreach teams. Two of the key recommendations of the report were: 1) increased attention to patients exhibiting physiological abnormalities, as this is a marker of increased mortality; and 2) Deployment of EWSCs to cover all hospitalised patients. These EWSCs should be linked to a RRT that was appropriately skilled to manage the deteriorating patient.
§ ‘Emergency Admissions: a journey in the right direction?’, published in 20079, focussed on
emergency admissions to hospitals. It highlighted that 34.8% of patients received substandard care, and that the initial assessment and management plan for these patients was inadequate, with a failure to perform appropriate investigations and to recognise critically ill patients. Among
its principal recommendations were training to enable recognition of critically ill patients and a clear physiological monitoring plan for each patient, commensurate with their clinical condition. This physiological monitoring plan should detail what is to be monitored, the desirable parameters and the frequency of observations. It should also include an explicit statement of parameters that would prompt escalation of care, and review by an expert multidisciplinary team; i.e. an EWSC linked to a RRT.
§ ‘Adding Insult to Injury. A review of the care of patients who died in hospital with a primary diagnosis of acute kidney injury (acute renal failure)’, published in 20095, focussed on patients who
developed AKI. Among its key findings were: a) there was an unacceptable delay in recognising hospital-acquired AKI in 43% of patients; b) 20% of hospital-acquired AKI cases were avoidable; c) complications of AKI were missed in 13% of cases, and avoidable in 17%; and d) 50% of patients received substandard care. Among the report’s many recommendations was the robust implementation of ‘NICE Clinical Guidance 50’, which are systems for recognising acutely ill patients.
§ ‘Caring to the End? A review of the care of patients who died in hospital within four days of admission’, published in 200910, highlighted issues of inadequate early assessment, investigation,
diagnosis, and management of patients on admission. It also focussed on the failure to urgently escalate care of these patients to a senior clinician or consultant.
§ ‘Knowing the Risk. A review of the peri-operative care of surgical patients’, published in 20114
focussed on the care of high-risk surgical patients. Among its key findings were: a) only 48% of high-risk patients received care that was ‘good’; b) there was a lack of consensus as to what constitutes high peri-operative risk (a recognition problem); c) 24% of patients were not monitored by an early warning system; and d) there were inadequate pre-operative interventions to optimise a patient’s nutritional and fluid status, resulting in poor outcomes for those cases where optimisation did not occur. The key recommendations included better assessment of high-risk patients and optimisation of their nutritional and fluid status, along with the escalation of their care to an enhanced recovery pathway.
§ ‘Time to Intervene? A review of patients who underwent cardiopulmonary resuscitation as a result of an in-hospital cardiorespiratory arrest’, published in 201211, focussed on patients who had a
cardiac arrest in hospital. It found that 64% of cardiac arrests were predictable, with warning signs for imminent cardiac arrest present in 75% of cases. The report also claimed 38% of cardiac arrests were avoidable. Key factors in this poor antecedent patient care were identified as the lack of ‘recognition’ and failure to escalate the care of these deteriorating patients. Again, the implementation of ‘NICE Clinical Guidance 50’ was one of the key recommendations.
§ Finally, in ‘Just Say Sepsis! A review of the process of care received by patients with sepsis’, published in 201512, the principal recommendations included: a) the implementation of a formal
protocol to enable the early identification and management of patients with sepsis; b) the use of an EWSC, such as the National Early Warning Score (NEWS); c) adequate vital sign monitoring; d) adequate staffing and resources; and e) implementation of ‘care bundles’.
Two overriding themes emerge, first poor identification of patients at high risk of deterioration, or those who are already deteriorating; and second inadequate urgency in the escalation of care and review of these patients, by an appropriate senior clinician (consultant or specialist nursing team).
1.3 The Current Solution: Rapid Response Systems
Addressing the problems of poor or delayed identification of high-risk or acutely ill patients is complex, and apart from rapid identification and effective clinical intervention, this involves: education, training and resourcing. Resourcing applies to adequacy in staff and facilities e.g. critical care beds.
The key components of a programme of AE reduction- the ‘Chain of Prevention’15, are described in
detail in Section 1.1. To deal specifically with 1) monitoring and identification of the high-risk/deteriorating patient, and 2) the call for help and response components, the most widely implemented solution has been the rapid response system (RRS). The RRS is composed of an afferent limb of monitoring, recognition and alerting (call for help), namely the EWSC, and an efferent limb of intervention (response), which is the RRT. These are described below (in reverse order):
1.3.1 The Efferent Limb: Rapid Response Team
RRTs are referred to by a variety of names, including ‘medical emergency team’, ‘outreach team’, ‘critical care outreach team’, ‘emergency response team’, or ‘patient emergency response team’. The RRT is a designated group of healthcare professionals with a mixture of skills. According to Jones et al, ‘These teams are key components of rapid-response systems, which have been put in place because of evidence of “failure to rescue” with available clinical services, leading to AEs’16. As a minimum
requirement, each RRT includes a senior clinician (acute medicine physician, anaesthetist or intensivist) and a critical care nurse, though the composition varies by institution. The RRT differs from the traditional ‘cardiac arrest’ team (‘code team’ in the USA) in a number of ways (Figure 1.1)16. The
RRT assesses a larger number of hospitalised patients at an earlier stage of their clinical deterioration. The RRT’s role is to immediately assess and treat a patient showing objective or subjective signs of clinical deterioration. The RRT’s goal is to reverse the patient’s deterioration and prevent an AE. The RRT responds to emergencies, proactively evaluates high-risk ward patients, educates and acts in liaison with ward staff. The RRT may also follow up on patients discharged from an ICU. RRTs have
been introduced in many countries, including for example Australia, Canada, Denmark, the Netherlands, New Zealand, Sweden, UK and USA.
Figure 1.116
1.3.2 The Afferent Limb: Vital Sign EWSCs
It is well recognised that, prior to an in-hospital patient having a cardiac arrest, being admitted to an ICU, or dying; they exhibit a period of physiological deterioration that is potentially recognisable and reversible4,8,9,10,11,12. However, frontline medical staff often ignore this. As a result, the use of an EWSC
has been mandated in health care settings, in order to aid the detection and escalation of care of the high-risk/deteriorating patient.
EWSC were developed to facilitate early detection of deterioration by categorising a patient’s severity of illness and prompting frontline medical staff to request a medical review at specific trigger points7.
EWSC are sometimes referred to as ‘Track and Trigger Score’.7 Each of a patient’s vital signs (blood
pressure, heart rate, respiratory rate, etc.), is allocated a numerical score depending on its absolute value. Individual scores are added to give the total score for that patient, which is their EWSC. A high or rising EWSC value indicates a patient has or is deteriorating, while falling values indicate their improvement. Thresholds are set, where if a patient’s score is equal to or above a certain value, specific actions are recommended, from increasing the frequency of recording the vital signs to immediately calling the RRT. It is also not always necessary to aggregate the individual vital signs together, and some countries, particularly the USA, have instituted MET (medical emergency team) calling criteria, which are dependent only on the absolute values of individual vital signs. Examples of MET and EWSC calling criteria are shown in Figures 1.2 and 1.3. At some hospitals, patients themselves and family members may trigger/call the rapid response team.
In the UK, in 2007 the NICE issued guidance that all patients in hospital should be monitored using an EWSC with appropriate escalation.7 In 2012, The RCP published the ‘National Early Warning Score
(NEWS): Standardising the assessment of acute-illness severity in the NHS’ report.17 In this, it
recommended that a new EWSC, known as ‘NEWS’, be implemented across all NHS hospitals. In 2014, the Irish National Clinical Effectiveness Committee issued its National Clinical Guideline No. 1, namely the National Early Warning Score (NEWS), and recommended its introduction in Ireland.18 Figure 1.4
details the assigned values for each vital sign parameter of NEWS, and Figure 1.5 shows the thresholds and triggers of the aggregated values. NEWS was evaluated against a range of other EWSC, and was shown to have an area under the receiver operator curve (AUROC) of 89% for discriminating for in-hospital mortality within 24 hours of NEWS assessment, for patients admitted to a medical admissions unit (medical emergency admissions). As a result, rapid response systems (RRS) are now standard practice in the UK and in most developed countries.
Figure 1.2: Single-parameter MET calling criteria16
A hospital poster listing criteria for activation of a rapid response team. Such posters are displayed on the walls of hospitals to remind caregivers of abnormalities in vital signs that are considered to require intervention. This poster is based on one displayed at Austin Hospital, Heidelberg, Victoria, Australia 16
Figure 1.3: Multi-parameter EWSC19
Figure 1.4: National Early Warning Score (NEWS)
1.3.3 Issues with Vital Sign EWSCs
Before, embarking on creating an EWSC based on blood results, administrative data was undertaken, an understanding of the key problems with vital sign based EWSCs was carried out. I did this to mitigate any of these issues arising in my ML based approach. Although, vital-sign-based EWSCs have been widely implemented. I believe there remain significant issues with their use, which limits their effectiveness in adequately identifying the high-risk/deteriorating patient.
In my opinion, the two most significant problems are
§ Limitations on the measurement of vital signs
§ Poor positive predictive value in the identification of the high-risk/deteriorating patient Both of which are explored in below.
1.3.3.1 Limitations on the measurement of vital signs
Measuring vital signs is routine. Vital signs are used to help diagnose and monitor the health status of the patient, and their response to clinical interventions. However, there are numerous studies that have shown that such measurements may not be performed predictably, accurately or completely.16
In addition, the frequency of measuring vital signs has been shown to be inadequate and a cause for the delayed detection of a deteriorating patient.8,9,10,12 Thus, if monitoring is not being carried out, or
the values recorded from it are inaccurate, then any escalation of care that relies on the interpretation of the vital signs is bound to be detrimentally affected, reducing the effectiveness of a vital-sign-based EWSC.
1.3.3.2 Poor positive predictive value in the identification of the high-risk/deteriorating patient
There is significant variation in the predictive performance of a vital-sign-based EWSC to identify patients at risk of an AE20, 21.
Single-parameter EWSCs comprise escalation criteria based on the values of single variables only, such as ‘heart rate < 40 beats per minute (bpm) or > 130 bpm’, ‘respiratory rate < 8 breaths per minute (brpm) or > 30 brpm’, etc. Smith et al. compared 80 single-parameter EWSCs in 9,987 emergency medical patients, and demonstrated variations in their positive predictive values (PPVs) to identify death within hospital, which ranged from 13.5% to 26.1%.20 Sensitivities varied from 7.3% to 52.5%,
with specificities ranging from 69.1% to 98.1%. The maximum positive predictive value (PPV) of identifying a patient dying in hospital was 26.1%, which equates to one patient death in every 3.8 (1:3.8) predicted patient deaths. However, this particular EWSC had a sensitivity of only 7.3%; i.e. it identified only 7.3% of all patients who died in hospital. A slightly more effective single-parameter EWSC was that of Salamonson22, which had a marginally lower PPV of 25.7% (1:3.9), but identified only
19% of patients likely to die. The single-parameter EWSC with the highest sensitivity of 52.8% had a PPV of only 13.5% (1:7.4).23
Multiple-parameter EWSCs perform substantially better. For the same vital sign database used to evaluate the single-parameter EWSCs above, the area under the receiver operator curve (AUROC) for death within 24 hours of the vital signs being measured varied from 65.7% to 78.2%.21 This comparative
analysis was repeated on a larger dataset (35,585 admissions, 198,755 vital sign observation sets) with the NEWS.24 NEWS achieved an AUROC for identifying death within 24 hours of 89.4%, with the other
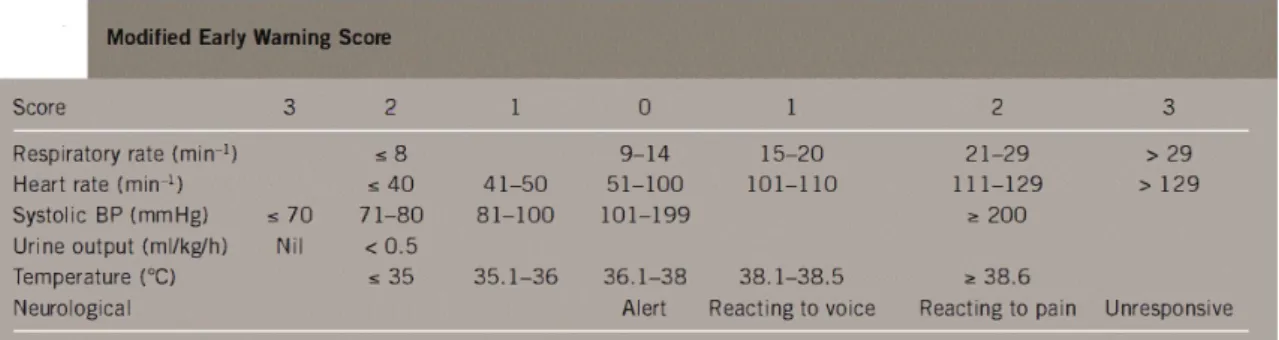
EWSCs’ AUROCs ranging from 81.3% to 85.8%. No positive predictive values, sensitivities or specificities for any threshold levels (the numerical value of the EWSC) were explicitly stated in the paper. However, for NEWS, it was indicated that when the value was 5, the sensitivity of capturing patients who died within 24 hours was 75%. In a separate study, two EWSCs, ViEWS (Vitalpac Early Warning Score, the basis for NEWS) and MEWS (Modified Early Warning Score), were tested on a dataset of 1.15 million vital signs obtained from 42,230 admissions.25 The mortality rate in this study
was 1.79% (756 deaths). ViEWS achieved an AUROC of 86.2%, while MEWS’s AUROC was 86.5%. However, for ViEWS, the positive predictive value in discriminating whether the patient was likely to die, even at a relatively high threshold value of 11 (the recommended threshold for a severe patient is 7), was only 1:4.5 (22.1%), and this was achieved with a poor sensitivity of only 30.7%. Another study, by Romero-Brufau et al.26, used a different dataset of almost seven million sets of vital sign
observations from 46,366 admissions, and compared various EWSCs for their predictive accuracy in correctly classifying a composite outcome. The composite outcome was positive if it occurred within 36 hours, and included cardiac arrest, unplanned transfer to ICU, resuscitation call, or RRT activation. This study relied not just on admission data, but also on data collected throughout a patient’s hospital stay. The maximum PPV attained by an EWSC was 21%, but this was paired with a poor sensitivity of only 8%. NEWS seemed to consistently have a PPV of less than 10% (the sensitivity was not reported). The exact threshold value for NEWS was not stated, but it can be estimated to be either 5 or 7, corresponding to the moderate or severe thresholds respectively.
In summary, existing vital sign based EWSCs do not offer good predictive value for RRT activation, and better EWSCs need to be developed and validated.
1.4 An Alternative Afferent Limb: Use of Laboratory Data
An alternative to using an EWSC based on vital signs would be to use existing quality-controlled data stored electronically in hospital. This would mitigate issues affecting data quality and calculations.
Medical professionals already use the results of blood tests to help them diagnose, prognosticate and monitor interventions. Although not regarded as an EWSC, blood test results are already used to identify high-risk/deteriorating patients. Diagnoses are normally made by interpreting individual blood results and their trends, ratios of different blood results, simple combinations of a few blood results, and in the case of blood gas measurements: to aid the diagnosis of metabolic vs respiratory acidosis/alkalosis. Scoring systems also exist which use blood result data to aid diagnosis and severity grading of diseases, for example Ranson’s criteria for predicting the severity of acute pancreatitis.27
In my opinion, four specific methods by which blood results are interpreted, their use in clinical practice, and their potential for use as an EWSC, are given below (ranked in increasing complexity):
1. Simple single-parameter: Reference intervals.
2. Simple dual-parameter: Dehydration (urea to creatinine ratio). 3. Dynamic single-parameter: AKI.
4. Aggregated multi-parameter: potential laboratory-based EWSCs.
In this thesis, I have explored each of the above methods. I have specifically in Chapters 3, 4 and 5, used the methods, of 2, 3 and 4 above.
In each of these chapters and for each use case I have demonstrated
1. the inadequacy of that method in discriminating between patients likely to die or not 2. the substantial improvement in discrimination an ML approach achieves
I have shown this by the application of three techniques 1 adding additional variables
2 incorporating dynamic change 3 applying ML techniques
The background behind each of these existing methods of interpretation follows below.
1.4.1 Simple single parameter: Reference intervals
Most blood results are reported with a reference interval (RI). The purpose of the RI is to help the clinician to interpret the blood result. The display of these RIs is a legal requirement in Europe (EU Directive 98/79/EC) and the rest of the world28, and each laboratory calculates and presents the RI for
each blood test performed28. These RIs may vary slightly between laboratories. RIs are usually derived
from a 95% interval of a reference distribution of values present in that population28. The population
whom the test will used. However, frequently the sample population is not representative and is based on young Caucasian males, rather than the diverse ethnicities and ages of the population who present for medical treatment28. Disease states themselves may shift the appropriate RIs for patients for
example chronic kidney disease patients having known and stable creatinine results of between 100 and 200 micromol/L.
RI’s date back to 1968.29 The use of RI’s is supported by the International Federation of Clinical
Chemistry, which in 1991 recommended that each laboratory follow defined procedures to produce its own reference values for tests carried out.28 The latest, most significant step in the development
and harmonisation of reference ranges is the 2010 EP28-A3C guideline.30
Frequently confused with RIs are clinical decision limits (CDLs). According to Yesim Ozarda in his recent review of RIs28,
‘CDLs are thresholds above or below which a specific medical decision is recommended. CDLs are based on the diagnostic question and are obtained from specific clinical studies to define the probability of the presence of a certain disease or a different outcome. These limits lead to the decision that individuals with values above or below the decision limit should be treated differently’.
Examples of CDLs include cholesterol, troponin, HBA1C, and blood transfusion thresholds28. Although
RIs and CDLs are distinct, they are commonly reported in the same reference interval/range field when a result is displayed. The consequence of this is that, RI’s maybe be inappropriately regarded as a CDL, rather than just a statistical range, especially by junior clinicians. This may cause them to inappropriately believe the patient is free from disease.
High or low values for a range of blood tests, such as for sodium, glucose, white cell count, urea and Ur:Cr ratio, have been shown to correlate with poor outcomes in various hospital populations.31
Figures 1.6 and 1.7 are two examples of univariate analysis on individual blood results, which highlight increased patient mortality when their blood test result is outside its RI. Using individual blood results, the odds ratio for mortality for results outside the RI range from 0.6 to 13.8, for lymphocytes > 3 and age > 65 respectively (Figure 1.6). Similarly, the AUROC for predicting mortality for individual blood results range from 0.5788 to 0.8069 for haematocrit and pH respectively (Figure 1.7). As for single-parameter vital-sign-based EWSCs, univariate analysis on individual blood tests provides poor discrimination for predicting in-hospital mortality. Thus, although essential for diagnosis and monitoring or patient health, an EWSC based only on individual blood tests results has little utility.
Figure 1.6: Individual blood test results: Odds ratio for in-hospital mortality 31
Figure 1.7: Individual blood test results: Area under the receiver operator curve for in-hospital mortality 32
1.4.2 Simple dual-parameter: Dehydration (urea to creatinine ratio):
One of the simplest ways two blood result variables have been used in conjunction has been the urea to creatinine ratio (Ur:Cr) as a non specific surrogate for dehydration.33
Dehydration is a reduction in total body water. This can occur due to reduced intake, or increased losses. A reduction in the intravascular volume without a reduction in total body water, which occurs when intravascular water moves into the third spaces (interstitial, peritoneum, etc.), is intravascular hypovolaemia. Most clinical measurements of dehydration rely on sampling of the intravascular plasma and thus cannot normally differentiate between the two.34 Understanding the specific type of
dehydration is critical to initiating the appropriate treatment. This section however, focusses on providing an overview of the deleterious effects on the body of dehydration (total body water and hypovolaemia), when measured primarily using Ur:Cr.
Water accounts for some 60% of adult body mass and is essential for human life: it is the environment in which most biochemical reactions occur, and is necessary for the convective transport of nutrients, oxygen and metabolic waste products. Dehydration disturbs these functions, reducing cardiac output and cell volume, increasing plasma osmolality and blood viscosity, and driving visceral blood flow redistribution (including a reduction in cutaneous blood flow).35,36
A laboratory-based marker for classifying whether or not a patient is dehydrated is the serum Ur:Cr. Ur:Cr is an historical means of diagnosing dehydration.33 Urea is the end product of nitrogen-containing
amino-acid metabolism. In the kidneys, urea is freely filtered by the glomerulus, as well as both resorbed and secreted by renal tubules. Creatinine is derived from the metabolism of muscle creatine. In the kidneys, creatinine is freely filtered and secreted by the proximal renal tubular. Ur:Cr changes when there is either a disproportionate fall in creatinine vs urea, or a disproportionate rise of urea vs creatinine. In individuals who are dehydrated, urea concentrations in the renal medulla (and thus plasma) rise37 whilst creatinine continues to be freely filtered. This results in a rise in the Ur:Cr. A Ur:Cr >80 mmol/L:mmol/L (BUN:CR >20 mg/l:mg/l)) has been traditionally considered a marker of dehydration (or intravascular volume depletion).38,39 However, Ur:Cr may rise for other reasons: urea
for instance, also rises in hypercatabolic states (sepsis, major surgery, starvation)40; with the large
‘blood protein meal’ of an upper gastrointestinal bleed41,42; or with high-dose glucocorticoid
administration.43 Alternatively, in the context of a low skeletal muscle mass (e.g. in the elderly,
Hospitalised patients are at risk of dehydration, due to impaired intake (resulting from cerebral, musculoskeletal or gastrointestinal pathology) or excessive losses (e.g. enteric, renal or insensible). Even modest dehydration (<2% loss of body mass) may impair cognitive46 and physical performance47,
mood48 which can manifest as delirium in the elderly49, and impair thermoregulation.50 It can cause
constipation, and is associated with impaired wound healing51, urolithiasis and urinary tract infection.36
Dehydration also leads to renal hypoperfusion, and plays an important pathogenic role in the development of AKI.5,52 Specifically, a raised Ur:Cr is associated with an increased risk of death in
patients with AKI53 and in those on long-term dialysis.54,55 In stroke, it is associated with early clinical
deterioration56, impaired functional outcome57,58, thromboembolism37 and mortality57,58. Elevated
Ur:Cr is also an independent marker of mortality in critical care40,59, heart failure60, myocardial
infarction61 and gastrointestinal cancer39, and also indicates functional impairment62 and poor
rehabilitation in the elderly.63
Independently, both low creatinine and raised urea levels are also associated with poor outcomes. Low Cr marks a poor outcome in critical illness45, and raised Ur indicates a poor outcome in pneumonia64,65,
acute pancreatitis66, coronary artery bypass grafting67, myocardial infarction61, decompensated68 and
chronic60 heart failure, and critical illness.40
The impact of dehydration on healthcare costs and outcomes is causing increasing concern to England’s Care Quality Commission69, patient associations70 and the Parliamentary Ombudsman71,
with such concerns being echoed in recent independent inquiries72 and in the media.73,74,75,76,77 The
NICE has recently issued clinical guidelines in an effort to improve the prevention and management of dehydration and AKI.6,78 However, despite concerns over the clinical impact of dehydration and the
awareness that it may be more commonplace than expected, the true current prevalence of dehydration in hospital patients is not known. In 1991, 6.7% of 731,695 USA Medicare admissions recorded dehydration as a cause for admission.79 From 1994 to 2000, admission rates for dehydration
ranged from 130 to 134 admissions per 100,000 population.69 In England in 2012–2013, some 11,417
(0.075%) of all hospital admissions (n=15.1 million), and 16,928 (0.095%) of all consultant episodes (n=17.7 million) were coded for primary dehydration (International Classification of Diseases, 10th
edition, code: E86.X).80 This rose to 243,161 (1.7%) of all consultant episodes, if dehydration was coded
either as a primary or an associated diagnosis. When Ur:Cr is used to define dehydration, estimates of the prevalence of dehydration rise dramatically: 54% of all elderly orthopaedic rehabilitation patients (n=39) were dehydrated at the point of admission.63 Likewise, between a quarter and a half of stroke
patients were dehydrated on admission56,81, and 62% suffered this condition at some point during their
Thus, two routinely performed blood tests, whether viewed independently or interpreted in conjunction, provide significant insight into the condition of the majority of hospitalised patients. The results of these tests, and in particular their ratio, are strongly associated with in-hospital mortality. It is, however, yet to be established whether an EWS, applicable to all hospitalised patients, that incorporates the Ur:Cr of a patient and tracks its change, could be developed and used to identify high-risk/deteriorating patients. This is because all reported studies to date have been single-site, and either disease- or speciality-specific.
1.4.3 Dynamic single-parameter: AKI
The trends of blood results, i.e. their rise or fall, have always been extremely valuable to clinicians. A recent and highly publicised interpretation of a very specific dynamic change in just one specific blood result (creatinine) is that of AKI.82
AKI is an abrupt impairment in kidney function that results in a rise in serum creatinine concentration or a fall in urine output. AKI is a broad clinical syndrome that encompasses a number of aetiologies, including but not limited to kidney diseases (e.g. acute interstitial nephritis; acute glomerular and vasculitic renal diseases; ischaemia, toxic injury), extra-renal pathology (for example, pre-renal azotaemia, acute post-renal obstructive nephropathy, sepsis). More than one of these conditions may coexist in the same patient. In 2012, to harmonise the detection and treatment of AKI, a rise in patient’s serum creatinine and a fall in their urine output measures were used by the Kidney Disease: Improving Global Outcomes (KDIGO) group, to standardise definitions of its presence and stage of severity (stages 1–3).83
One in every five hospitalised adults (21%) suffer AKI84, worldwide; with a prevalence of 14% reported amongst UK hospital admissions.79 AKI is also associated with increased risk of death85, prolonged
hospitalisation86, requirement for renal replacement therapy87, or the development of chronic kidney
disease.88 The associated health care costs of AKI exceed £1 billion per year in the UK.79 Over 50% of
AKI-associated morbidity and mortality may be preventable with early detection and appropriate intervention.5 A more systematic approach that does not rely on any one individual checking or acting
on results, rather a process that used existing data to alert health care staff that a patient is at high risk of an poor outcome based on their results is now achievable, given the way we store and report blood test results.
In response, initiatives throughout the world have attempted to promote AKI recognition and encourage timely interventions to hasten its resolution.82 In 2015, the National Health Service of
KDIGO, Table 1.1) in hospital laboratory information-management systems (NHSE-AKI algorithm, Figure 1.8). The NHSE-AKI algorithm compares the current creatinine result of a patient with their previous results, to determine whether a significant rise has occurred. Specifically, the current result is compared to a ‘baseline creatinine’ value, which is calculated as either the patient’s minimum creatinine result in the previous seven days, or the median of all their creatinine results in the preceding 8–365 days, whichever is lower.
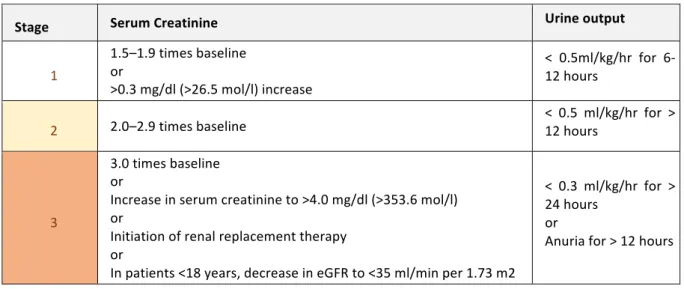
Table 1.1: Kidney Disease Improving Global Outcomes (KDIGO): Staging of AKI
Stage Serum Creatinine Urine output
1 1.5–1.9 times baseline or >0.3 mg/dl (>26.5 mol/l) increase < 0.5ml/kg/hr for 6-12 hours
2 2.0–2.9 times baseline < 0.5 ml/kg/hr for > 12 hours
3
3.0 times baseline or
Increase in serum creatinine to >4.0 mg/dl (>353.6 mol/l) or
Initiation of renal replacement therapy or
In patients <18 years, decrease in eGFR to <35 ml/min per 1.73 m2
< 0.3 ml/kg/hr for > 24 hours
or
Anuria for > 12 hours
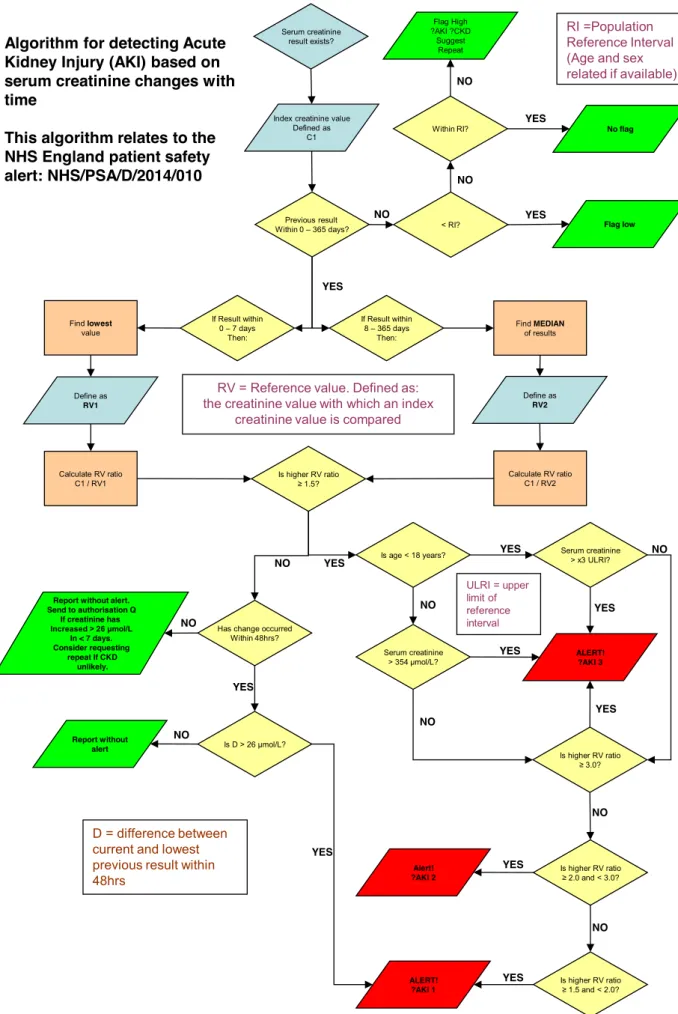
The NHSE-AKI algorithm is intended to alert clinicians to potential AKI cases and their likely severity stage, and thus identify those at risk of subsequent AEs, such as death or renal replacement therapy (Drrt).89 Clinical assessment following such an AKI alert may lead to an escalation of intervention according to the AKI stage (Figure 1.9). Thus, although not explicitly labelled as such, the NHSE-AKI algorithm could be regarded as the afferent limb of a ‘rapid response system’ (RRS), where the efferent limb ‘rapid response team’ (RRT) includes a nephrologist.
However, whilst clinicians may consider more severe AKI stages to be more dangerous (and worthy of prioritisation of care), the degree to which this is correct is unclear. Patient heterogeneity or clinical state (e.g. the presence of dehydration or of co-morbidities) might influence the degree of risk within any one AKI stage, or across stages. Likewise, multiple trigger routes can lead to the same AKI stage (Figure 1.8), but might be associated with different outcomes. None of these issues have been sufficiently evaluated on a large multisite dataset, and thus we have yet to establish the benefit of implementing an existing AKI algorithm, which does not account for all of these factors, as the afferent limb of a referral system.
Figure 1.8: The NHS England Acute Kidney Injury Algorithm (NHSE-AKI algorithm)
Serum creatinine result exists?
Previous result Within 0 – 365 days? Index creatinine value
Defined as C1 If Result within 0 – 7 days Then: If Result within 8 – 365 days Then: Find lowest value Define as RV1 Calculate RV ratio C1 / RV1 Find MEDIAN of results Define as RV2 Calculate RV ratio C1 / RV2 Is higher RV ratio ≥ 3.0? Is higher RV ratio ≥ 2.0 and < 3.0? Is higher RV ratio ≥ 1.5 and < 2.0? ALERT! ?AKI 3 Alert! ?AKI 2 ALERT! ?AKI 1 Is higher RV ratio ≥ 1.5?
Has change occurred Within 48hrs?
Is D > 26 μmol/L?
Report without alert Report without alert. Send to authorisation Q If creatinine has Increased > 26 μmol/L In < 7 days. Consider requesting repeat If CKD unlikely.
< RI? Flag low
Within RI? No flag
Flag High ?AKI ?CKD
Suggest Repeat
Algorithm for detecting Acute Kidney Injury (AKI) based on serum creatinine changes with time
This algorithm relates to the NHS England patient safety alert: NHS/PSA/D/2014/010
RI =Population Reference Interval (Age and sex related if available)
RV = Reference value. Defined as: the creatinine value with which an index
creatinine value is compared
D = difference between current and lowest previous result within 48hrs YES NO YES YES NO NO NO YES YES YES YES YES NO NO NO NO ULRI = upper limit of reference interval
Is age < 18 years? Serum creatinine > x3 ULRI?
Serum creatinine > 354 μmol/L? YES YES YES YES NO NO NO
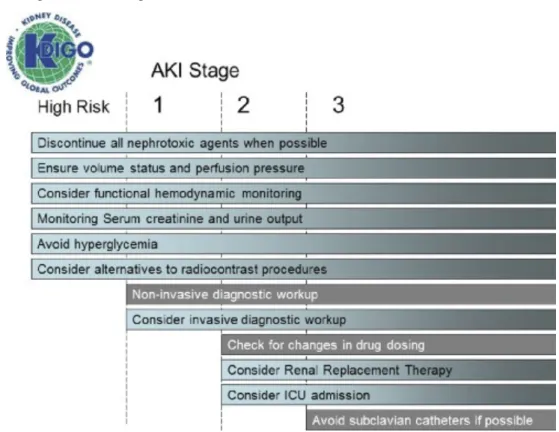
Figure 1.9: Stage-based management of AKI
Shading of boxes indicates priority of action: solid shading indicates actions that are equally appropriate at all stages whereas graded shading indicates increasing priority as intensity increases. AKI: acute kidney injury; ICU: intensive care unit.
1.4.4 Aggregated multi-parameter
The use of multiple laboratory based variables (parameters) in a formal score is not commonplace in-hospital. However, one field of medicine where occasionally an aggregated scoring system is used to modify the care a patient receives, is that of perioperative medicine. For example, for patients undergoing major surgery, some doctors calculate a score that helps them determine whether the patient should be transferred to intensive care post-operatively, and arrangements are made prior to the commencement of surgery. A recent review article by Moonesinghe et al.90 summarises the most
common of these surgical scoring systems. The models in this review use a mixture of data, comprising demographic, co-morbidities, lifestyle questions, surgical questions, vital-sign and laboratory information, in both the pre-operative and post-operative periods. In this review, P-POSSUM (Portsmouth Physiology and Operative Severity Score for enUmeration of Mortality) and the Surgical Risk Scale were highlighted as being the most validated and accurate.
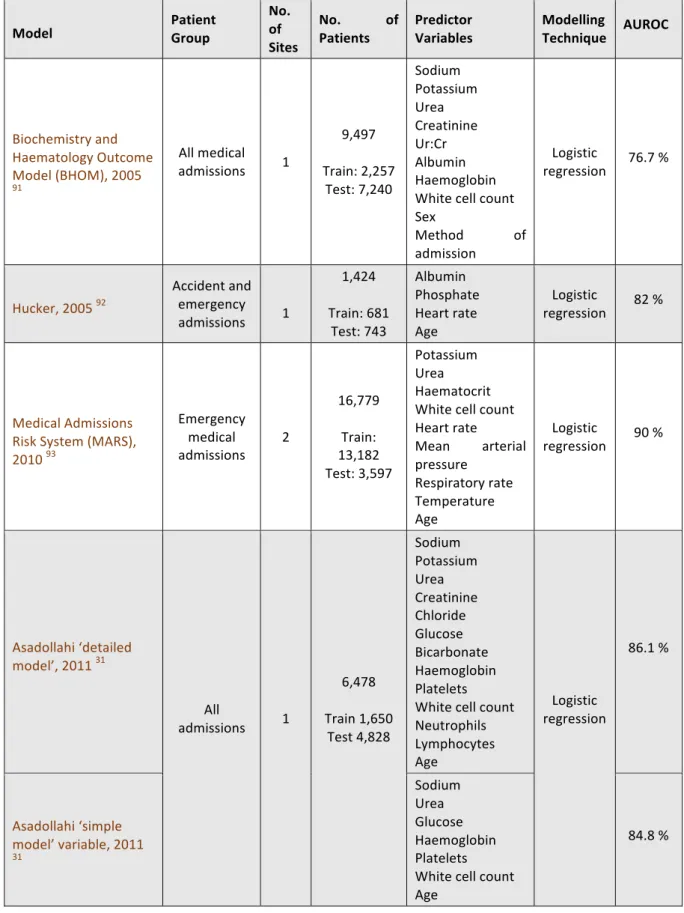
Outside of perioperative medicine, the use of multi-parameter laboratory-based models for assessing the risk of mortality in all hospital patients has not been implemented individually or at scale. However, as individual blood test results are known to correlate with in-hospital mortality (Section 1.4.1), researchers have explored combining these with basic demographic data (i.e. age, sex), to predict risk of death. Researchers have developed a number of such models (Table 1.2).
Table 1.2: Existing aggregated multi-parameter EWSC
Model Patient Group
No. of Sites
No. of
Patients Predictor Variables Modelling Technique AUROC
Biochemistry and Haematology Outcome Model (BHOM), 2005 91 All medical admissions 1 9,497 Train: 2,257 Test: 7,240 Sodium Potassium Urea Creatinine Ur:Cr Albumin Haemoglobin White cell count Sex Method of admission Logistic regression 76.7 % Hucker, 2005 92 Accident and emergency admissions 1 1,424 Train: 681 Test: 743 Albumin Phosphate Heart rate Age Logistic regression 82 % Medical Admissions Risk System (MARS), 2010 93 Emergency medical admissions 2 16,779 Train: 13,182 Test: 3,597 Potassium Urea Haematocrit White cell count Heart rate Mean arterial pressure Respiratory rate Temperature Age Logistic regression 90 % Asadollahi ‘detailed model’, 2011 31 All admissions 1 6,478 Train 1,650 Test 4,828 Sodium Potassium Urea Creatinine Chloride Glucose Bicarbonate Haemoglobin Platelets White cell count Neutrophils Lymphocytes Age Logistic regression 86.1 % Asadollahi ‘simple model’ variable, 2011 31 Sodium Urea Glucose Haemoglobin Platelets White cell count Age