sustainability
ArticleA Probabilistic Alternative Approach to Optimal
Project Profitability Based on the Value-at-Risk
Yonggu KimID and Eul-Bum Lee *Graduate Institute of Ferrous Technology & Graduate School of Engineering Mastership, Pohang University of Science and Technology, 77, Cheongam-ro, Nam-gu, Pohang-si, Gyeongsangbuk-do 37673, Korea; [email protected]
* Correspondence: [email protected]; Tel.: +82-10-5433-8940
Received: 4 February 2018; Accepted: 4 March 2018; Published: 8 March 2018
Abstract:This paper focuses on an investment decision-making process for sustainable development based on the profitability impact factors for overseas projects. Investors prefer to use the discounted cash-flow method. Although this method is simple and straightforward, its critical weakness is its inability to reflect the factor volatility associated with the project evaluation. To overcome this weakness, the Value-at-Risk method is used to apply the volatility of the profitability impact factors, thereby reflecting the risks and establishing decision-making criteria for risk-averse investors. Risk-averse investors can lose relatively acceptable investment opportunities to risk-neutral or risk-amenable investors due to strict investment decision-making criteria. To overcome this problem, critical factors are selected through a Monte Carlo simulation and a sensitivity analysis, and solutions to the critical-factor problems are then found by using the Theory of Inventive Problem Solving and a business version of the Project Definition Rating Index. This study examines the process of recovering investment opportunities with projects that are investment feasible and that have been rejected when applying the criterion of the Value-at-Risk method. To do this, a probabilistic alternative approach is taken. To validate this methodology, the proposed framework for an improved decision-making process is demonstrated using two actual overseas projects of a Korean steel-making company.
Keywords:Value-at-Risk; probabilistic alternative approach; Theory of Inventive Problem Solving; Project Definition Rating Index; optimal project profitability
1. Introduction
Since 2005, Korean steel-making companies have been attempting to establish overseas steel plant projects (SPPs). The experience of Korean steel-making companies in overseas SPPs is relatively low, whereas their experience in domestic SPPs is extensive. Korean steel-making companies have suffered numerous difficulties due to the uncertainty and risks of overseas SPPs [1]. Stakeholders are consistently exposed to risks when managing a project at any stage in the engineering, construction, procurement, or sustainment life-cycles [2–5]. The risks can lead to project failure [6]. Risk management of the project can be achieved through the economical application of resources to identify, assess, and prioritize risks as well as minimize, monitor, and control the likelihood or impact of unfortunate events, while maximizing the realization of opportunity [7]. The purpose of risk management is to ensure that uncertainties do not cause deviation from the project goals. Therefore, for sustainable project development, investors need to be aware of and deal with the risks associated with a project.
In particular, investors dealing with projects for sustainable development should be careful when making investment decisions. Investors have traditionally used the discounted cash flow (DCF) method to make decisions when investing in projects and it is widely used because it is simple to use
Sustainability2018,10, 747 2 of 24
and understand. The value of the DCF method is based on the cash flow of the investment project. In this paper, the factors affecting cash flow are defined as profitability impact factors. The disadvantage of the DCF method is that it does not reflect risk, and so, it has difficulties in recognizing, preventing, and overcoming the risks of the project. A way to reflect these risks is the Value-at-Risk (VaR) method which can be applied as an improved project-profitability indicator to estimate the future uncertainty risks. The VaR method, introduced in the late 1980s by major financial institutions, is one of the risk-measurement methods that can be used to quantitatively predict the amount of loss due to risk. While the input factors used in the DCF method have fixed values, the input factors used in the VaR method have variable values depending on the risks. Although the VaR method has the advantage of reflecting the risk, its disadvantage is that the decision criterion is conservative due to excessive recognition of the risk, which often leads to loss of an investment opportunity for investors. In previous studies, the VaR method for various projects has been applied to evaluate the risk by reflecting the project [8–11]. For sustainable development, investors need to select good investment opportunities that are less risky and more profitable for their projects. Therefore, this paper proposes a method to support investors’ through a probabilistic alternative approach that takes advantage of the VaR method. VaR has been used in previous studies to analyze risk factors through sensitivity analysis to select risk priorities [12–14]. This paper proposes a probabilistic approach to compare and analyze alternatives using the Theory of Inventive Problem Solving (TRIZ or TIPS) and the business version of the Project Definition Rating Index (PDRI) as a differentiating method from previous studies. Unlike previous studies, this method is not limited to presenting only alternatives, it also presents new input factors that reflect the risks and helps determine whether various alternatives are actually applicable for sustainable project development.
The objective of this paper is to propose an alternative approach for the optimization of project profitability through a quantitative evaluation of the various risks using the profitability indicators of sustainable investments. The contribution of this paper is the proposal of an alternative business perspective that can quantitatively analyze the project risk factors and improve the project value from a sustainability perspective in project development. This paper is organized as follows: Section2
discusses the need for research from an investigation of the relevant literature; Section3introduces the project evaluation methodology for traditional decision-making processes and for improved decision-making processes; Section4identifies the factors that affect project value in terms of risk management and a method is suggested for quantitatively analyzing risk factors using a proposed probabilistic alternative approach employing TRIZ and PDRI; Section5validates this paper through a case study of two actual steel plant projects, and finally, a conclusion summarizes the paper and discusses limitations and future plans.
2. Related Work
A major indicator of project profitability is the results from the DCF method, which is a well-established valuation method for steel-plant projects (SPPs), for which cash flows are used [15]. The DCF method measures the future cash flows of a project from which the gains are converted into the present value (PV) [16]. The DCF method is typically represented by the net present value (NPV) and the internal rate of return (IRR), which are useful in the assessment of a reasonable value in terms of the difference between the present value and the future cash flow value [15]. However, SPPs can be inaccurately assessed when using traditional evaluation methods due to the large size of a project, its long-term operation period, the risk characteristics according to the uncertainty of the contract complexity, varying degrees of management flexibility, and the financial structure [15,17–19].
While making investment decisions for overseas SPP projects, investors analyze the project profitability according to the impact of various risks and they should estimate the realistic losses from the risks to ensure the sustainability of the development and their investments. This means that the NPV and IRR output variables must be calculated under uncertain input variables that vary within a certain range and shift with the occurrence of hazardous events; it is then possible to obtain
Sustainability2018,10, 747 3 of 24
NPV and IRR probability distributions [20]. In the VaR method, two risk definitions are applicable: the potential-loss degree of the asset portfolio and the potential-profit standard deviation [21]. Risk can be understood as the potential-loss amount. The VaR is defined as the maximum amount of loss reserves in the time horizon of the portfolio at a given confidence level. The confidence level is defined by each company according to its standards and its financial condition [22]. The main purpose of the VaR is the quantification of the potential losses under normal market conditions [23]. Here, it is essential to pay attention to the term “normal.” Fundamentally, the VaR does not make use of unusual market circumstances, such as the Great Depression of 1929 or the financial crisis of 2008. Therefore, to establish a risk-prevention plan with project-profitability forecasting, investors should focus on normal market conditions as well as abnormal conditions, as well as on the fluctuations in extreme situations.
Ye et al. [8] considered the VaR value as the NPV and carried out an infrastructure-project investment evaluation for which an NPV at-risk method was utilized. Habibi et al. [9] dealt with the conditional VaR of a cash-flow stream in the presence of an exchange-rate risk. Caron et al. [10] used the VaR to obtain an improvement in balancing the overall portfolio of power-plant projects for a company operating in the engineering and contracting industry. These studies attempted to consider the risk variability by using the NPV at-risk method from the perspective of the investor, the creditor, and the project constructor. The limitation of these studies, however, is their sole use of the NPV as a project-evaluation index derived from a Monte Carlo simulation. Monte Carlo simulations can be further utilized for the evaluation of potential risks with a sensitivity analysis, and Gatti et al. [12] used Monte Carlo simulations to calculate the VaR estimates for project-financing transactions, whereby suggestions were made regarding the ways that important issues can be discussed in the development of a model for the improvement of the project value.
Value engineering (VE) is used as an alternative approach in the engineering phase of a project. Miles [24] technically analyzed various cases using VE as a problem-solving system. Lbusuki [25] suggested the correct systematic approach of VE and a target-costing method for cost management. These studies mainly focus on approaches that improve the technical aspects of products. To increase the effectiveness of the VE practice, TRIZ can be applied at VE idea-gathering meetings [26]. The versatility of TRIZ means that it can be applied to business issues as well as the technical aspects of projects [27]. The TRIZ technique is used in this paper to solve the problem of major risk factors that are derived from an analysis of a Monte Carlo simulation.
TRIZ techniques are used in various disciplines and fields. Kim and Cochran [28] reviewed a number of TRIZ concepts from the perspective of the axiomatic-design framework. Yamashina et al. [29] proposed an effective integration of TRIZ and quality-function deployment, enabling technological innovations for the effectiveness and systematic operability of new products. John and Harrison [30] identified ways in which TRIZ tools and methodologies could be used to innovate the environment and then presented a way TRIZ could be applied as a sustainable design tool for specific purposes. Ilevbare et al. [31] moved away from the traditional TRIZ literature by exploring the challenges that are associated with the acquisition and application procedures for TRIZ beginners based on their practical experience as well as the benefits that are associated with the attainment of TRIZ knowledge. Souchkov [32] provided a brief overview of the manner in which TRIZ can benefit the business world, whereby business and management innovations are improved and implemented. This study evaluates project risks through the application of the business version of the PDRI, which is widely used by project managers of SPPs, and TRIZ-based solutions are proposed for which a project-risk evaluation result is employed.
3. Project-Evaluation Methodology
The methodology of this study consists of two tasks. The first task is to assess risk applied project evaluation. The second task is to select alternatives for optimal profitability by applying a probabilistic alternative approach to risk in project evaluation. The overall methodology framework of this paper is shown in Figure1.
Sustainability2018,10, 747 4 of 24
Sustainability 2018, 10, x FOR PEER REVIEW 4 of 24
Figure 1. Overall project evaluation framework.
3.1. Traditional Decision-Making Process for the DCF Model
Project evaluation is based on a cash-flow model. Essentially, the cash-flow model defines the pro forma income-statement elements and the discount-rate elements as profitability impact factors. Figure 2 shows an example of a pro forma income statement.
Figure 2. Example of a pro forma income statement.
To assess the project value, a reasonable cash-flow model that reflects the profitability impact factors that are the input variables of the DCF method should be established. This paper defines the following 15 profitability impact factors, (1) capital expenditure; (2) material cost; (3) labor cost; (4) net working capital; (5) overhead cost; (6) sale price; (7) production; (8) exchange rate; (9) corporate tax rate; (10) debt-to-equity ratio; (11) risk-free interest rate; (12) market risk premium; (13) beta; (14) cost of debt (COD) before tax; and (15) country risk. Further, this paper introduces the necessary calculation formulas. A capital cost that represents the weighted average cost of capital (WACC) is
20X1 20X2 20X3 Revenues Sale price 1,553.80 1,773.54 1,453.60 production 3 3 3 Expenses Capital expenditure 50,354.81 50,354.81 50,354.81 Material cost 1,235.43 1,235.43 1,235.43 Labor cost 50.43 50.43 50.43
Net working capital 34.22 34.22 34.22
Overhead cost 5.46 5.46 5.46
▣
Pro forma income statement
〮〮〮
Figure 1.Overall project evaluation framework.
3.1. Traditional Decision-Making Process for the DCF Model
Project evaluation is based on a cash-flow model. Essentially, the cash-flow model defines the pro forma income-statement elements and the discount-rate elements as profitability impact factors. Figure2shows an example of a pro forma income statement.
Sustainability 2018, 10, x FOR PEER REVIEW 4 of 24
Figure 1. Overall project evaluation framework.
3.1. Traditional Decision-Making Process for the DCF Model
Project evaluation is based on a cash-flow model. Essentially, the cash-flow model defines the pro forma income-statement elements and the discount-rate elements as profitability impact factors. Figure 2 shows an example of a pro forma income statement.
Figure 2. Example of a pro forma income statement.
To assess the project value, a reasonable cash-flow model that reflects the profitability impact factors that are the input variables of the DCF method should be established. This paper defines the following 15 profitability impact factors, (1) capital expenditure; (2) material cost; (3) labor cost; (4) net working capital; (5) overhead cost; (6) sale price; (7) production; (8) exchange rate; (9) corporate tax rate; (10) debt-to-equity ratio; (11) risk-free interest rate; (12) market risk premium; (13) beta; (14) cost of debt (COD) before tax; and (15) country risk. Further, this paper introduces the necessary calculation formulas. A capital cost that represents the weighted average cost of capital (WACC) is
20X1 20X2 20X3 Revenues Sale price 1,553.80 1,773.54 1,453.60 production 3 3 3 Expenses Capital expenditure 50,354.81 50,354.81 50,354.81 Material cost 1,235.43 1,235.43 1,235.43 Labor cost 50.43 50.43 50.43
Net working capital 34.22 34.22 34.22
Overhead cost 5.46 5.46 5.46
▣
Pro forma income statement
〮〮〮
Figure 2.Example of a pro forma income statement.
To assess the project value, a reasonable cash-flow model that reflects the profitability impact factors that are the input variables of the DCF method should be established. This paper defines the following 15 profitability impact factors, (1) capital expenditure; (2) material cost; (3) labor cost; (4) net working capital; (5) overhead cost; (6) sale price; (7) production; (8) exchange rate; (9) corporate tax rate; (10) debt-to-equity ratio; (11) risk-free interest rate; (12) market risk premium; (13) beta; (14) cost of debt (COD) before tax; and (15) country risk. Further, this paper introduces the necessary calculation formulas. A capital cost that represents the weighted average cost of capital (WACC) is relevant here;
Sustainability2018,10, 747 5 of 24
it consists of the cost of equity (COE), the COD, the debt-to-capital ratio (DCratio), and the corporate tax rate (TAX). In this case, the COE is derived using the capital-asset pricing model [33]. The risk-free interest rate (Rfree), market risk premium, and beta also need to be considered. The cost of debt refers to the borrowing of the interest rate in project financing.
COE = Rfree+ beta×(market risk premium−Rfree), (1)
WACC = (1−DCratio)×COE + DCratio×COD×(1−TAX), (2) To calculate the project profitability, it is essential to obtain a discount rate which is an index of the project risks, as follows:
Discount rate = WACC + Country risk premium, (3)
The project cash flow is divided into the construction-period component and the business-period component, and each part constitutes the cash inflows and outflows that are associated with the 15 profitability impact factors presented above.
Through the DCF method, a project is assessed using the NPV and the IRR. Further, the profitability of these two indicators is verified using the cash flow, as follows:
NPV= N
∑
t=1 CFt (1+r)t−1, (4)wheretis the year of the project period,Nis the total project period,CFtis the cash flow of the year,
andris the discount rate.
IRR =rvalue when the NPV = 0, (5)
whereris derived using a trial-and-error method. 3.2. Improved Decision-Making Process for the VaR Model
During the planning stage of projects, investors consider the various risks. However, if traditional economic evaluation criteria such as the NPV and the IRR are being used, the investors are then at risk of overlooking the volatility of the project uncertainty risks [34]; therefore, it is necessary to consider the change in profitability according to the fluctuation of the risks. By developing a sophisticated probabilistic model of the future cash flows, investors can determine the project investment based on risk-based decision criteria. In this study, an improved DCF method is used, to which the profitability impact factors that reflect the project risks are applied. The improved DCF method is called VaR-based NPV at Risk (NPVaR) and is based on a cash-flow model [8]. The main difference between the traditional DCF method and the NPVaR method is the determination of whether each of the profitability impact factors accurately reflect the risks of the project. A Monte Carlo simulation shows the way that this distribution can be calculated for a given project, and how it can comprehensively measure the business risks of the project [10]. In fact, a Monte Carlo simulation can be easily applied to explain numerous types of practical assumptions regarding the probability distributions of the profitability impact factors of the cash-flow model. The probability distribution for each profitability impact factor of the NPVaR method is determined based on a number of literature researches [15,35,36].
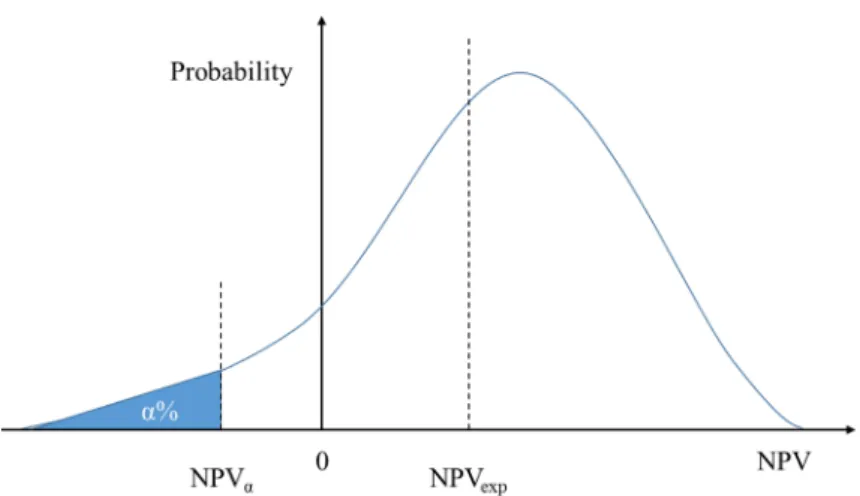
In this paper, VaR refers to the NPV for the maximum loss that may occur during a relatively long operation period of a project, whereas the general VaR, which is used in financial sectors, refers to the amount of loss for a relatively short period of time. The NPVaR method is applied to the VaR in terms of the NPV as it applies a discount rate on the cash flow of the project during the project period. As shown in Figure3, NPVαis defined as the NPV corresponding to the significance level ofα; that is, it refers to the minimum NPV at the (1−α) confidence level [8].
Sustainability2018,10, 747 6 of 24
Sustainability 2018, 10, x FOR PEER REVIEW 6 of 24
Figure 3. Probability distribution of the net present value (NPV).
Figure 3 shows two definitions of simple profitability forecasting for which the volatility of the risks is considered. These definitions will be used as the decision-making criteria in the following section. First, the expected NPV (NPVexp) is defined as the mean NPV of a probability distribution. The NPVexp is a level of profitability that can occur under normal circumstances. The second definition is the NPVα, the lower cumulative α% NPV of the probability distribution. The NPVα is a level of profitability that can occur under severe circumstances. Therefore, if the investors decide on whether to execute a project using the NPVaR, they will be able to receive assistance during the decision-making process by identifying the maximum number of losses that might occur during the operation period of the project. If the NPV, which does not consider the risk volatility, is not used as a traditional decision-making tool, the project profit may be less than the expected NPV, or a loss might result due to the unknown risks of an actual project. To prevent the uncertainty risks, this paper presents decision-making criteria that are determined by the nature of the investors according to the risk circumstances and in consideration of the risk volatility.
4. Probabilistic Alternative Approach
In terms of project evaluation, the NPVaR is presented as the decision-making criteria; although previous studies have been limited to the VaR decision-making process [8,10,20,35,36]. The authors of this current study noticed that the decision-making criterion for project investment is more conservative as it reflects the profitability impact factors of the project risks. When the investment is approved in the VaR process, the distinction from previous studies is not evident. The focus of this paper, however, is the actions that investors can take when their investment is rejected in the VaR process, which are discussed below.
First, in this study, the major risk factors are recognized based on previous studies of the many risks that arise for investors who are dealing with overseas construction projects, as well as on the database of a steel-making company. The major risk factors can be tabulated according to their associations with the profitability impact factors, as follows. A database of overseas constructions should be set and analyzed to identify the relevance between the associated major risk factors and the profitability impact factors. The analysis of the project profitability, for which the Monte Carlo simulation was employed, is a sensitivity analysis that finds the most influential factor among the profitability impact factors. Second, the business version of the PDRI, which is based on major risk factors, is helpful in determining the alternatives for achieving the optimal project profitability. The success regarding the optimal profitability requires identification of the most influential factors, analysis of the problems that are associated with the risks, and a TRIZ-based derivation of the optimal solution.
Figure 3.Probability distribution of the net present value (NPV).
Figure3shows two definitions of simple profitability forecasting for which the volatility of the risks is considered. These definitions will be used as the decision-making criteria in the following section. First, the expected NPV (NPVexp) is defined as the mean NPV of a probability distribution. The NPVexpis a level of profitability that can occur under normal circumstances. The second definition is the NPVα, the lower cumulativeα% NPV of the probability distribution. The NPVαis a level of profitability that can occur under severe circumstances. Therefore, if the investors decide on whether to execute a project using the NPVaR, they will be able to receive assistance during the decision-making process by identifying the maximum number of losses that might occur during the operation period of the project. If the NPV, which does not consider the risk volatility, is not used as a traditional decision-making tool, the project profit may be less than the expected NPV, or a loss might result due to the unknown risks of an actual project. To prevent the uncertainty risks, this paper presents decision-making criteria that are determined by the nature of the investors according to the risk circumstances and in consideration of the risk volatility.
4. Probabilistic Alternative Approach
In terms of project evaluation, the NPVaR is presented as the decision-making criteria; although previous studies have been limited to the VaR decision-making process [8,10,20,35,36]. The authors of this current study noticed that the decision-making criterion for project investment is more conservative as it reflects the profitability impact factors of the project risks. When the investment is approved in the VaR process, the distinction from previous studies is not evident. The focus of this paper, however, is the actions that investors can take when their investment is rejected in the VaR process, which are discussed below.
First, in this study, the major risk factors are recognized based on previous studies of the many risks that arise for investors who are dealing with overseas construction projects, as well as on the database of a steel-making company. The major risk factors can be tabulated according to their associations with the profitability impact factors, as follows. A database of overseas constructions should be set and analyzed to identify the relevance between the associated major risk factors and the profitability impact factors. The analysis of the project profitability, for which the Monte Carlo simulation was employed, is a sensitivity analysis that finds the most influential factor among the profitability impact factors. Second, the business version of the PDRI, which is based on major risk factors, is helpful in determining the alternatives for achieving the optimal project profitability. The success regarding the optimal profitability requires identification of the most influential factors, analysis of the problems that are associated with the risks, and a TRIZ-based derivation of the optimal solution.
Sustainability2018,10, 747 7 of 24
4.1. Identification of Overseas-Project Risk Factors
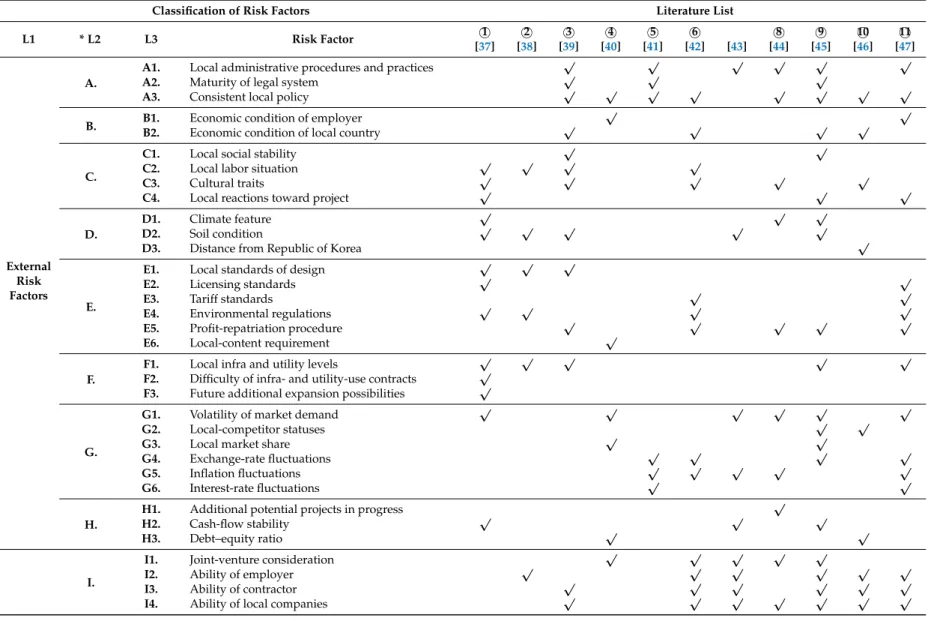
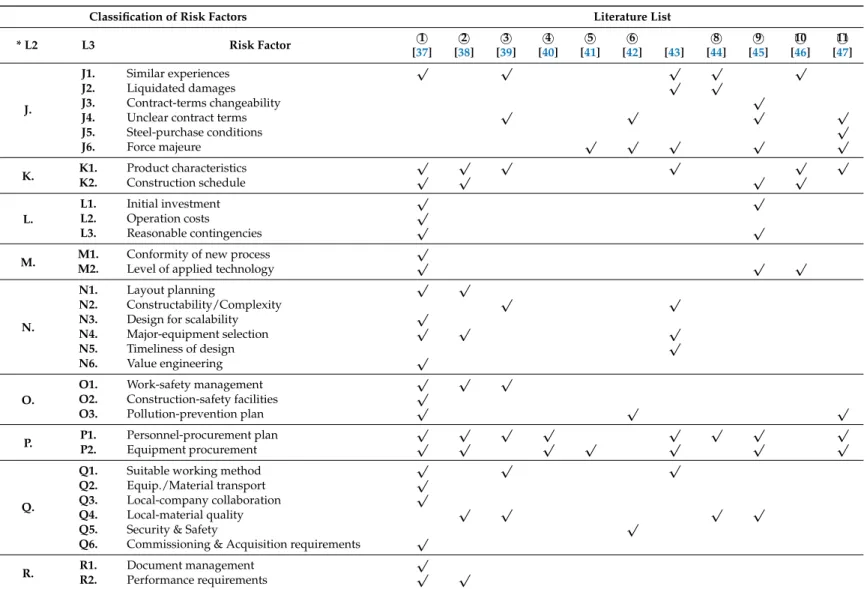
In this paper, the proposed method is used for the data analysis to make relationships between the profitability impact factors and the associated major risk factors, and the risk factors of overseas investment projects are determined based on the literature references that are associated with the overseas construction cases that are discussed in the remainder of this paper. The methods that have been widely used to evaluate the success of projects are the PDRI [37] and the front-end loading (FEL) index [38]. This study also includes an additional nine references in which other overseas and domestic plant projects have been assessed. It is advantageous that a variety of the risks that can occur in overseas construction-project cases can be recognized. Table1shows 66 overseas construction-project risk factors that are related to the contents of the literature references.
As shown in Table 1, the risk factors of overseas construction projects are largely classified into internal and external risk factors. The external risk factors are related to the project-investment environment and the internal risk factors are related to the managerial regulations of the project itself. For the classification, the risk factors have been organized into categories that are based on the literature references. The classification considers most of the risk factors, while also considering the investors during the investment-decision step.
When they are utilized in real-life projects, the major risk factors can be added and subtracted depending on the nature of the project. Additionally, it is more effective to build a database of risk factors so that investors can document a company’s overseas experiences. In this study, a business version of the PDRI is analyzed based on the 66 previously mentioned risk factors to find the associated risk factors according to the profitability impact factors, as shown in Table2.
Sustainability2018,10, 747 8 of 24
Table 1.List of the risk factors for overseas construction projects based on the related literature.
Classification of Risk Factors Literature List
L1 * L2 L3 Risk Factor 1 [37] 2 [38] 3 [39] 4 [40] 5 [41] 6 [42] [43] 8 [44] 9 [45] 10 [46] 11 [47] External Risk Factors A.
A1. Local administrative procedures and practices √ √ √ √ √ √
A2. Maturity of legal system √ √ √
A3. Consistent local policy √ √ √ √ √ √ √ √
B. B1. Economic condition of employer
√ √
B2. Economic condition of local country √ √ √ √
C.
C1. Local social stability √ √
C2. Local labor situation √ √ √ √
C3. Cultural traits √ √ √ √ √
C4. Local reactions toward project √ √ √
D.
D1. Climate feature √ √ √
D2. Soil condition √ √ √ √ √
D3. Distance from Republic of Korea √
E.
E1. Local standards of design √ √ √
E2. Licensing standards √ √
E3. Tariff standards √ √
E4. Environmental regulations √ √ √ √
E5. Profit-repatriation procedure √ √ √ √ √
E6. Local-content requirement √
F.
F1. Local infra and utility levels √ √ √ √ √
F2. Difficulty of infra- and utility-use contracts √ F3. Future additional expansion possibilities √
G.
G1. Volatility of market demand √ √ √ √ √ √
G2. Local-competitor statuses √ √
G3. Local market share √ √
G4. Exchange-rate fluctuations √ √ √ √
G5. Inflation fluctuations √ √ √ √ √
G6. Interest-rate fluctuations √ √
H.
H1. Additional potential projects in progress √
H2. Cash-flow stability √ √ √ H3. Debt–equity ratio √ √ Internal Risk Factors I.
I1. Joint-venture consideration √ √ √ √ √
I2. Ability of employer √ √ √ √ √ √
I3. Ability of contractor √ √ √ √ √ √
Sustainability2018,10, 747 9 of 24
Table 1.Cont.
Classification of Risk Factors Literature List
L1 * L2 L3 Risk Factor 1 [37] 2 [38] 3 [39] 4 [40] 5 [41] 6 [42] [43] 8 [44] 9 [45] 10 [46] 11 [47] J. J1. Similar experiences √ √ √ √ √ J2. Liquidated damages √ √ J3. Contract-terms changeability √
J4. Unclear contract terms √ √ √ √
J5. Steel-purchase conditions √ J6. Force majeure √ √ √ √ √ K. K1. Product characteristics √ √ √ √ √ √ K2. Construction schedule √ √ √ √ L. L1. Initial investment √ √ L2. Operation costs √ L3. Reasonable contingencies √ √
M. M1. Conformity of new process
√
M2. Level of applied technology √ √ √
N.
N1. Layout planning √ √
N2. Constructability/Complexity √ √
N3. Design for scalability √
N4. Major-equipment selection √ √ √
N5. Timeliness of design √
N6. Value engineering √
O.
O1. Work-safety management √ √ √
O2. Construction-safety facilities √
O3. Pollution-prevention plan √ √ √
P. P1. Personnel-procurement plan
√ √ √ √ √ √ √ √
P2. Equipment procurement √ √ √ √ √ √ √
Q.
Q1. Suitable working method √ √ √
Q2. Equip./Material transport √
Q3. Local-company collaboration √
Q4. Local-material quality √ √ √ √
Q5. Security & Safety √
Q6. Commissioning & Acquisition requirements √ R. R1. Document management
√
R2. Performance requirements √ √
* A.Credibility of Local Government,B.Economic Stability,C.Local Social & Cultural Characteristics,D.Geographical conditions,E.Legal Standard,F.Status of infrastructure,G. Market conditions,H.Financing Plan,I.Project Organization,J.Contract Condition,K.Scope of Work,L.Expenses,M.Process & Technology,N.Engineering Period,O.Health, Safety, & Environment,P.Procurements,Q.Construction Period,R.Completion Requirements.
Sustainability2018,10, 747 10 of 24
Table 2.Relationships between the profitability impact factors and the associated major risk factors.
Profitability Impact Factors Associated Major Risk Factors
External Risk Factors Internal Risk Factors
Capital Expenditure C. D. F. I. J. L. N. Q.
Material cost G. J. L. M. N.
Labor cost C. L. O. P.
Net working capital L. M.
Overhead cost L. M.
Sale price B. E. G. J. K.
Production B. G. K. R.
Exchange rate G.
Corporate tax rate A. B. C. E.
Debt/(equity + debt) H.
Cost of equity
Risk-free interest rate H.
Market risk premium B. I. J.
Beta B.
Cost of debt H. I. J.
Country risk A. B. C.
A. Credibility of Local Government, B. Economic Stability, C. Local Social & Cultural Characteristics, D. Geographical conditions,E.Legal Standard,F.Status of infrastructure,G.Market conditions,H.Financing Plan,I. Project Organization,J.Contract Condition,K.Scope of Work,L.Expenses,M.Process & Technology,N.Engineering Period,O.Health, Safety & Environment,P.Procurements,Q.Construction Period,R.Completion Requirements.
The level of risk associated with overseas projects is greater than that of domestic projects. Therefore, as the role of the investors is the planning of projects and the provision of project investments, it is important for the investors to recognize and respond to such risks in advance. Also, it is essential to set the cash-flow model to predict the project profitability; and to reflect the cash-flow model for each of these risks, it is important to analyze the relationship between the profitability impact factors and the risk factors in advance. This study defines the major factors that affect the project profitability according to 15 factors based on the pro forma income statement shown in Figure2of the risk factors of overseas projects, as shown in Table2. The relationships between the profitability impact factors and the associated risk factors is linked to the references on overseas projects [48–51]; furthermore, these relationships are utilized in the problem-solving of this paper.
This paper presents a method which is applicable to an increase in the NPVα, which is
an important indicator of investment decisions based on the relationships between the profitability factors and the associated major risk factors. It is important to identify the major contributors among the profitability impact factors; to find these factors, the use of a sensitivity analysis is recommended. A sensitivity analysis refers to the impact on the input variables in terms of the value of the results [52]. In a profitability-forecasting model that utilizes the NPVaR through an analysis of the major profitability impact factors affecting the NPVα, the investors may establish a risk-prevention plan; if the investors
can analyze the critical profitability impact factors influencing the NPV and manage the volatility of the controllable risk factors, the probability of the retention of the NPVexp, the initial expected project profit, will be further increased.
4.2. Developing Alternatives and the Alternative Selection Process
In order to develop alternatives, the major risk factors are first identified by recognizing the risks given in Table1and assessing the priorities of these risks. The most vulnerable risk factor can be selected by analyzing the relationship between the profitability impact factors and the associated major risk factors given in Table2and then checking the pre-assessed PDRI scores. The most vulnerable risk factors are used in the idea meetings to discover alternatives to TRIZ. In this study, additional project evaluation is performed using probabilistic alternatives as the input factors in order to select an optimal alternative. The schematic process of this methodology is shown in Figure4.
Sustainability2018,10, 747 11 of 24
Sustainability 2018, 10, x FOR PEER REVIEW 11 of 24
additional project evaluation is performed using probabilistic alternatives as the input factors in order to select an optimal alternative. The schematic process of this methodology is shown in Figure 4.
Figure 4. Flow diagram for alternative development and alternative selection.
4.2.1. Business-Version of PDRI
As shown in Figure 4, the investors first determined the weight of each risk factor of the project. This activity is an early part of the process of creating the business-version PDRI on a project-by-project basis. The major risk factors are identified in Table 2 using the most influential profitability impact factors given in the previous section. The list of 66 elements of the business-version PDRI was originally identified and categorized according to 10 references [37–47]. The elements were weighted in order of importance using the inputs from 15 experienced project managers and estimators who each have between 10 and 20 years of experience. An example of the business version of PDRI is presented in Appendix A. These employees used the TRIZ to seek out alternatives to overcome the most vulnerable risk factors that were applied for the weighted evaluation table.
4.2.2. TRIZ
The TRIZ offers a systematic approach to gain an understanding and definition of difficult problems. Difficult problems typically require unique solutions, and the TRIZ offers a variety of strategies and tools to facilitate the formulation of creative solutions. One of the earliest theory-based discoveries of large-scale projects is that most of the problems that require creative solutions typically reflect a need to overcome the dilemma or the tradeoff between two contradictory factors. A key goal of the TRIZ-based analysis is the systematic application of strategies and tools to find superior solutions that overcome the need to enact tradeoffs or compromises between the two contradictory elements. Twelve TRIZ principles are introduced in this current study to find alternatives, as shown in Appendix B.
Figure 4.Flow diagram for alternative development and alternative selection.
4.2.1. Business-Version of PDRI
As shown in Figure4, the investors first determined the weight of each risk factor of the project. This activity is an early part of the process of creating the business-version PDRI on a project-by-project basis. The major risk factors are identified in Table2using the most influential profitability impact factors given in the previous section. The list of 66 elements of the business-version PDRI was originally identified and categorized according to 10 references [37–47]. The elements were weighted in order of importance using the inputs from 15 experienced project managers and estimators who each have between 10 and 20 years of experience. An example of the business version of PDRI is presented in AppendixA. These employees used the TRIZ to seek out alternatives to overcome the most vulnerable risk factors that were applied for the weighted evaluation table.
4.2.2. TRIZ
The TRIZ offers a systematic approach to gain an understanding and definition of difficult problems. Difficult problems typically require unique solutions, and the TRIZ offers a variety of strategies and tools to facilitate the formulation of creative solutions. One of the earliest theory-based discoveries of large-scale projects is that most of the problems that require creative solutions typically reflect a need to overcome the dilemma or the tradeoff between two contradictory factors. A key goal of the TRIZ-based analysis is the systematic application of strategies and tools to find superior solutions that overcome the need to enact tradeoffs or compromises between the two contradictory elements. Twelve TRIZ principles are introduced in this current study to find alternatives, as shown in AppendixB.
Sustainability2018,10, 747 12 of 24
4.2.3. Probabilistic Alternative Selection
The profitability impact factor of alternatives based on TRIZ is first transformed into probabilistic values through a literature review and the company’s internal database. Based on the previously derived alternatives, the probability-distribution fit is used to formulate probability distributions. The transformed probabilistic values are used as the input variables to perform the Monte Carlo simulation using the VaR method. Among the found alternatives, the alternative with the largest NPVαis salient to solve the risk problem. The largest NPVαis the optimal project value.
5. Case Study
The leading Korean steel-making company, P, encountered many difficulties during their participation in three overseas projects. The Indonesian Krakatau project (Project K) of 2009, experienced difficulties such as a sales decrease due to a change in the local-market conditions and high steep-price volatility in the local market. The Brazilian Companhia Siderúrgica do Pecém project (Project C) of 2011, was hindered by difficulties such as a construction delay due to local-union strikes, an increase in the investment cost that was caused by inflation and political issues, and local policing and environmental issues. The current statuses of these projects considering the corresponding difficulties are as follows. A long-term demand in the market had not been established for Project K, so the sale price slowly decreased while profitability was even worse. In Project C, the investment cost became much larger than expected due to the frequent design changes and decreased workability. Overseas SPPs can pose serious risks and various detrimental environmental conditions in accordance with the investment uncertainties in the target countries. Investors should be more cautious in terms of investment decisions, as the risks of overseas SPPs are greater than those of local projects.
In this section, first, the profitability of two projects is analyzed with the traditional DCF-based decision-making process. Second, the profitability of the projects with the improved decision-making process is analyzed based on the NPVaR method. The difference between the two results is then analyzed and discussed. Finally, the selection of alternatives for the optimal profitability of the two projects is validated through a probabilistic alternative comparison of the major risk factors derived from the improved decision process.
5.1. Traditional DCF-Based Decision-Making Process
The case models for Project K (Indonesia, 2009) and Project C (Brazil, 2011) are shown in Table3, based on the profitability impact factors that were formulated from the pro forma financial-statement and the discount-rate elements. Values that are as close to the real values as possible serve as the basis for the modelling of both cases. The profitability impact factors are estimated based on the company’s financial and accounting disclosure documents that are stored in the Republic of Korea (ROK)’s electronic disclosure system. The cash-flow data for Project K and Project C, are presented in Tables4
Sustainability2018,10, 747 13 of 24
Table 3.Case information for a cash-flow model.
Profitability Impact Factors Unit Project K
(Indonesia, 2009) Project C (Brazil, 2011)
Construction/Operation period Year 3/15 4/20
* Capital expenditure Million USD 3000 3800
Material cost Million USD per year 480 460
Labor cost Million USD per year 300 280
Net working capital Million USD per year 40 30
Overhead cost Million USD per year 50 30
Sale price Million USD/Million
tons 680 640
Production Million USD per year 3 3
Revenue Million USD per year 2040 1920
Exchange rate KRW/USD 1065.92 1122.10
Corporate-tax rate % 28 34
Debt-to-equity ratio 1.5 (60%/40%) 1.0 (50%/50%)
Cost of equity % 7.758 6.901
Risk-free interest rate % 4.341 3.691
Market risk premium % 7.392 7.219
Beta 1.12 0.91
Cost of debt after tax % 3.622 2.845
Cost of debt before tax % 5.031 4.311
WACC % 5.277 4.873
Country risk premium % 3.400 3.400
Discount rate % 8.677 8.273
* Capital Expenditure (CAPEX) is amortized on a straight-line basis calculation. Table 4.Cash-flow data sheet for Project K (Indonesia, 2009).
Period Construction Operation
Year 1 2 3 4 5 . . . 15 16 17 18
Cash outflow *(1000) *(1000) *(1040) *(40) *(40) . . . *(40) *(40) *(40)
-Capital Expenditure *(1000) *(1000) *(1000) - - . . . - - -
-Net working capital - - *(40) *(40) *(40) . . . *(40) *(40) *(40)
-Cash Inflow - - - *718 *718 . . . *628 *634 *641 *647
Profit after tax - - - *622 *622 . . . *572 *578 *585 *591
Depreciation saving - - - *56 *56 . . . *56 *56 *56 *56
Net cash flow *(1000) *(1000) *(1040) *678 *678 . . . *588 *594 *601 *647
* Unit: Million USD.
Table 5.Cash-flow data sheet for Project C (Brazil, 2011).
Period Construction Operation
Year 1 2 3 4 5 . . . 21 22 23 24
Cash outflow *(950) *(950) *(950) *(980) *(30) . . . *(30) *(30) *(30)
-Capital Expenditure *(950) *(950) *(950) *(950) - . . . - - -
-Net working capital - - - *(30) *(30) . . . *(30) *(30) *(30)
-Cash Inflow - - - - *644 . . . *600 *604 *607 *611
Profit after tax - - - - *580 . . . *536 *539 *543 *546
Depreciation saving - - - *64 . . . *64 *64 *64 *64
Net cash flow *(950) *(950) *(950) *(950) *614 . . . *570 *574 *577 *611
* Unit: Million USD.
Table4shows the spending of the capital expenditure (CAPEX) from equity to debt; the CAPEX sequence uses the debt after the spending from the equity. Loan repayment is a method of fully
Sustainability2018,10, 747 14 of 24
amortizing loans, and it starts five years after the beginning of the operation period. The principal is repaid evenly during the remaining operation period. It is assumed here that the entirety of the CAPEX is a depreciable asset and is amortized on a straight-line basis calculation throughout the operation period. All products are sold out every year, thereby negating the need for a goods inventory. The net working capital is a plant-operation cost that is addressed one year prior to the start of the operation period and is then recovered in the final year of the operation period. This cost is used in the additional equity because debt is strictly defined by a term sheet for the CAPEX calculation.
Table6shows the calculation results of four of the profitability indicators, including the NPV and the IRR, using two cash-flow tables.
Table 6.Profitability-calculation results.
Profitability Indicators Project K (Indonesia, 2009) Project C (Brazil, 2011)
NPV (Million USD/Billion KRW) 1432/1525 901/1011
IRR (%) 15.25% 11.08%
Decision Making Result Investment approval Investment approval
All profitability indices are excellent and indicate that the implementation of the two projects should be approved. Both projects show NPVs that are greater than zero and IRRs that are greater than the discount rate (Project K is 8.677% and Project C is 8.273%), which is the minimum acceptable rate of return (MARR). Traditionally, investors would not hesitate in making the decision to invest in these projects. In practice, however, each of the profitability impact factors has a risk volatility. These profitability indices are prone to change depending on the potential economic situations. In the next section, the investment decision-making process is described using a new profitability index that reflects the risk variation.
5.2. Improved Decision-Making Process Based on the NPVaR Method
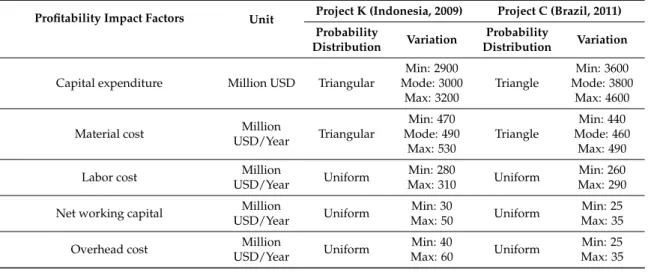
This case study is also based on the cash-flow model in Table 3. In traditional methods, the profitability impact factors are all fixed. If the profitability impact factors of each project are variable due to uncertainty risks, the decision-making results regarding the investment can be varied. In the improved decision-making process, the probability distribution of each profitability impact factor is set, as shown in Table7, and these can be applied to a Monte Carlo simulation to forecast the project profitability considering the risk volatility.
Table 7.Probability-distribution-fitting results for major profitability impact factors.
Profitability Impact Factors Unit Project K (Indonesia, 2009) Project C (Brazil, 2011) Probability
Distribution Variation
Probability
Distribution Variation
Capital expenditure Million USD Triangular
Min: 2900 Mode: 3000 Max: 3200 Triangle Min: 3600 Mode: 3800 Max: 4600
Material cost Million
USD/Year Triangular Min: 470 Mode: 490 Max: 530 Triangle Min: 440 Mode: 460 Max: 490
Labor cost Million
USD/Year Uniform
Min: 280
Max: 310 Uniform
Min: 260 Max: 290
Net working capital Million
USD/Year Uniform
Min: 30
Max: 50 Uniform
Min: 25 Max: 35
Overhead cost Million
USD/Year Uniform
Min: 40
Max: 60 Uniform
Min: 25 Max: 35
Sustainability2018,10, 747 15 of 24
Table 7.Cont.
Profitability Impact Factors Unit Project K (Indonesia, 2009) Project C (Brazil, 2011) Probability Distribution Variation Probability Distribution Variation Sale price Million USD/Million tons Exponential β: 26.7 Min: 620 Mean: 680 Triangle Min: 600 Mode: 630 Max: 650 Production Million USD/Year Uniform Min: 2.8 Max: 3.1 Uniform Min: 2.95 Max: 3.1
Exchange rate KRW/USD Beta
α1: 1.1427, α2: 3.4881 Min: 755.75 Max: 1973.80 Normal µ: 1122.10 σ: 175.92
Corporate tax rate % Triangular
Min: 25 Mode: 28
Max: 30
Uniform Min: 34
Max: 34
Debt/(equity + debt) Uniform Min: 0.55
Max: 0.70 Uniform
Min: 0.45 Max: 0.60
Cost of equity
Risk-free
interest rate % Uniform
Min: 1.0783 Max: 5.8217 Uniform Min: 0.9135 Max: 5.1265 Market risk premium % Triangular Min: 5.6759 Mode: 5.6759 Max: 10.4031 Uniform Min: 5.2502 Max: 8.8857
Beta Uniform Min: 1.07
Max: 1.17 Uniform
Min: 0.89 Max: 0.91
Cost of debt before tax % Uniform Min: 2.90
Max: 6.70 Triangular
Min: 3.128 Mode: 3.128
Max: 6.106
Country risk % Uniform Min: 2.4
Max: 4.4 Uniform
Min: 3.0 Max: 3.8
A probability-distribution fitting produces probability distributions that are used for the fitting of a set of data that has been accumulated for more than 10 years with respect to the variable profitability impact factors. The probability distributions that present a similar fit are assumed to lead to an excellent profitability estimation. A variety of probability distributions can be produced, some of which can be adapted more easily to the gathered data than others, depending on the characteristics of the profitability impact factors [53]. A probability-distribution fitting and Monte Carlo simulation are presented in this study, using the commercial statistical software @Risk for Excel Version 6.3.1 (Palisade Corporation, Ithaca, NY, USA).
A Monte Carlo simulation is presented here by using the cash-flow data from Tables4and5and the probability distributions of the major profitability impact factors of Project K (Indonesia, 2009) and Project C (Brazil, 2011) from Table7. The number of simulation repetitions is set to 10,000 to ensure the reliability of the simulation using the @Risk software. The derived simulation results are as close to reality as possible, and it is assumed that the investors are risk-averse. Two of the NPV probability distributions of the two projects were derived from the Monte Carlo simulation, as shown in Table7. The detailed simulation results are also given in Table8.
In the DCF methods, the two profitability indices are the NPV and the IRR, as can be seen in Table6. Usually, the two investment cases would be approved where the NPV is larger than zero and the IRR is larger than the discount rate (MARR). The two projects are ideally set up to receive investments. However, according to the improved method, both projects are rejected. This investor attribute means that the decision-making criterion is based on the decision criterion NPVα> 0. The significance level
that serves as the reference for the estimation of the NPVαis typically set at 5% (confidence level
Sustainability2018,10, 747 16 of 24
of the improved decision-making method, are negative, the risk-averse investors would reject both projects based on the decision criterion (NPV0.05> 0). Therefore such investors might miss suitable investment opportunities compared to relatively risk-neutral or risk-amenable investors. To resolve this problem, a method is suggested for enabling investors to find probabilistic alternatives to the risks for target projects.
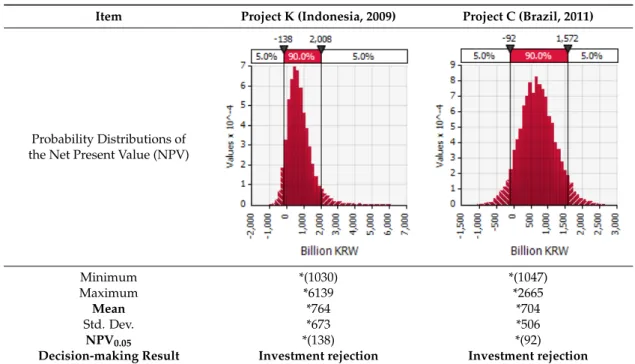
Table 8.Simulation summary statistics for the net present value (NPV).
Item Project K (Indonesia, 2009) Project C (Brazil, 2011)
Probability Distributions of the Net Present Value (NPV)
Sustainability 2018, 10, x FOR PEER REVIEW 15 of 24
Cost of equity
Risk-free
interest rate % Uniform
Min: 1.0783 Max: 5.8217 Uniform Min: 0.9135 Max: 5.1265 Market risk premium % Triangular Min: 5.6759 Mode: 5.6759 Max: 10.4031 Uniform Min: 5.2502 Max: 8.8857
Beta Uniform Min: 1.07
Max: 1.17 Uniform
Min: 0.89 Max: 0.91
Cost of debt before tax % Uniform Min: 2.90
Max: 6.70 Triangular
Min: 3.128 Mode: 3.128
Max: 6.106
Country risk % Uniform Min: 2.4
Max: 4.4 Uniform
Min: 3.0 Max: 3.8
A probability-distribution fitting produces probability distributions that are used for the fitting of a set of data that has been accumulated for more than 10 years with respect to the variable profitability impact factors. The probability distributions that present a similar fit are assumed to lead to an excellent profitability estimation. A variety of probability distributions can be produced, some of which can be adapted more easily to the gathered data than others, depending on the characteristics of the profitability impact factors [53]. A probability-distribution fitting and Monte Carlo simulation are presented in this study, using the commercial statistical software @Risk for Excel Version 6.3.1 (Palisade Corporation, Ithaca, NY, USA).
A Monte Carlo simulation is presented here by using the cash-flow data from Tables 4 and 5 and the probability distributions of the major profitability impact factors of Project K (Indonesia, 2009) and Project C (Brazil, 2011) from Table 7. The number of simulation repetitions is set to 10,000 to ensure the reliability of the simulation using the @Risk software. The derived simulation results are as close to reality as possible, and it is assumed that the investors are risk-averse. Two of the NPV probability distributions of the two projects were derived from the Monte Carlo simulation, as shown in Table 7. The detailed simulation results are also given in Table 8.
Table 8. Simulation summary statistics for the net present value (NPV).
Item Project K (Indonesia, 2009) Project C (Brazil, 2011)
Probability Distributions of the Net Present Value
(NPV) Minimum *(1030) *(1047) Maximum *6139 *2665 Mean *764 *704 Std. Dev. *673 *506 NPV0.05 *(138) *(92)
Decision-making Result Investment rejection Investment rejection
* Unit: Billion KRW.
Sustainability 2018, 10, x FOR PEER REVIEW 15 of 24
Cost of equity
Risk-free
interest rate % Uniform
Min: 1.0783 Max: 5.8217 Uniform Min: 0.9135 Max: 5.1265 Market risk premium % Triangular Min: 5.6759 Mode: 5.6759 Max: 10.4031 Uniform Min: 5.2502 Max: 8.8857
Beta Uniform Min: 1.07
Max: 1.17 Uniform
Min: 0.89 Max: 0.91
Cost of debt before tax % Uniform Min: 2.90
Max: 6.70 Triangular
Min: 3.128 Mode: 3.128
Max: 6.106
Country risk % Uniform Min: 2.4
Max: 4.4 Uniform
Min: 3.0 Max: 3.8
A probability-distribution fitting produces probability distributions that are used for the fitting of a set of data that has been accumulated for more than 10 years with respect to the variable profitability impact factors. The probability distributions that present a similar fit are assumed to lead to an excellent profitability estimation. A variety of probability distributions can be produced, some of which can be adapted more easily to the gathered data than others, depending on the characteristics of the profitability impact factors [53]. A probability-distribution fitting and Monte Carlo simulation are presented in this study, using the commercial statistical software @Risk for Excel Version 6.3.1 (Palisade Corporation, Ithaca, NY, USA).
A Monte Carlo simulation is presented here by using the cash-flow data from Tables 4 and 5 and the probability distributions of the major profitability impact factors of Project K (Indonesia, 2009) and Project C (Brazil, 2011) from Table 7. The number of simulation repetitions is set to 10,000 to ensure the reliability of the simulation using the @Risk software. The derived simulation results are as close to reality as possible, and it is assumed that the investors are risk-averse. Two of the NPV probability distributions of the two projects were derived from the Monte Carlo simulation, as shown in Table 7. The detailed simulation results are also given in Table 8.
Table 8. Simulation summary statistics for the net present value (NPV).
Item Project K (Indonesia, 2009) Project C (Brazil, 2011)
Probability Distributions of the Net Present Value
(NPV) Minimum *(1030) *(1047) Maximum *6139 *2665 Mean *764 *704 Std. Dev. *673 *506 NPV0.05 *(138) *(92)
Decision-making Result Investment rejection Investment rejection
* Unit: Billion KRW. Minimum *(1030) *(1047) Maximum *6139 *2665 Mean *764 *704 Std. Dev. *673 *506 NPV0.05 *(138) *(92)
Decision-making Result Investment rejection Investment rejection
* Unit: Billion KRW.
5.3. Probabilisic Alternative Approach for Optimal Profitability
In this section, a method is proposed for the optimal increase of the NPV0.05. First, it is important to find the major contributors among the profitability impact factors, as this will identify the most influential profitability impact factor. To find this factor, investors should use a sensitivity analysis, which investigates the impact of the input variables on the results [52]. In a profitability-forecasting model that utilizes the NPVaR method, through an analysis of the major profitability impact factors affecting the NPV0.05, risk-prevention alternatives can be identified. Thus, if investors can find the critical profitability impact factor that has the most influence on the NPV through a sensitivity analysis, they can connect the associated risks, as shown in Table2, by using a backward tracing method to seek the requisite solutions.
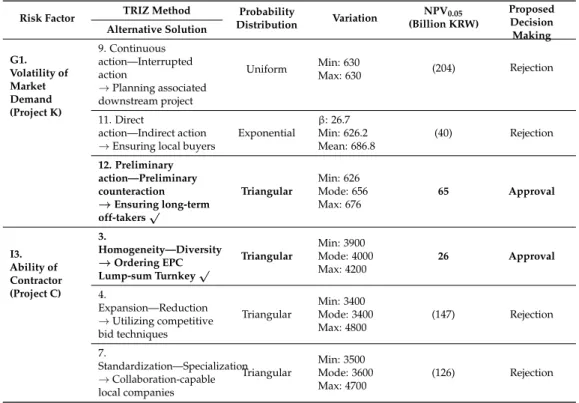
In Table9, the most influential profitability impact factors are the sale price and the CAPEX in Project K and Project C, respectively. This paper utilizes the risk information in Tables1and2to find solutions to reduce the risk-factor volatility by using the business-version PDRI and the proposed TRIZ problem-solving method [27,54].
As shown in Table10, in Project K, the sale price has five associated risk factors that are weighted in advance by overseas SPPs experts. According to this method, the risk factor “G. Market Condition” is the most influential factor, while the risk factor “G1. Volatility of market demand” is the most vulnerable PDRI score. In Project C, the CAPEX has eight associated risk factors that are also weighted. The risk factor “I. Project Organization” is the most influential factor, while the risk factor “I3. Ability of contractor” is the most vulnerable PDRI score.