Faculty of Business and Economics
DEPARTMENT OF ACCOUNTANCY, FINANCE AND INSURANCE (AFI)
&DSLWDO6WUXFWXUH'\QDPLFVLQ3ULYDWH%XVLQHVV*URXSV
Capital Structure Dynamics in Private Business Groups
Nico Dewaelheyns
Lessius University College, Department of Business Studies, Korte Nieuwstraat 33, 2000 Antwerp, Belgium Katholieke Universiteit Leuven, Faculty of Business and Economics, Department of Accountancy, Finance and
Insurance, Naamsestraat 69, 3000 Leuven, Belgium; email: [email protected]
Cynthia Van Hulle
Katholieke Universiteit Leuven, Faculty of Business and Economics, Department of Accountancy, Finance and Insurance, Naamsestraat 69, 3000 Leuven, Belgium; email: [email protected]
May 2010
Abstract
Dynamic models of capital structure assume that companies trade-off the advantages of a leverage adjustment and its costs. In general, private companies are assumed to face large adjustment costs, and should have lower financing flexibility. However, we argue that an important class of private companies – business group affiliates – may face relatively low adjustment costs because of their access to both internal and external capital markets. Our empirical results show significant differences in the composition of the capital structure and the leverage adjustment process between affiliates of private Belgian business groups and comparable stand-alone companies.
Keywords: Internal Capital Markets; Capital Structure; Business Groups; Ownership Structure; Capital Structure Dynamics
JEL – Classification Codes: G32, G21
Acknowledgements
The authors gratefully acknowledge useful comments and suggestions on a previous version of this paper by Frederiek Schoubben, Marc Deloof, Marie Dutordoir, seminar participants at the Manchester Business School and participants at the 2009 EFMA Conference, the 2009 FMA European Conference
1. Introduction
Even after decades of active theoretical and empirical research, the question of what determines a company’s capital structure remains a key research area in corporate finance. In recent years, the focus of capital structure research has increasingly shifted from examining the determinants of leverage levels to studying the drivers of adjustments in capital structure, i.e. capital structure dynamics. One of the main insights of this literature is that companies trade-off the potential benefits of adjusting their capital structure (e.g. tax optimization, reducing financing costs or ameliorating agency problems) against the transaction costs of doing so. The vast majority of the available empirical evidence on this issue concerns stock exchanged quoted companies, who appear to frequently adjust their leverage (e.g. Flannery and Rangan, 2006 and Leary and Roberts, 2005 for the U.S.; Ozkan, 2001 for the U.K.; de Miguel and Pindado, 2001 for Spain). Private companies, however, tend to have a much more restricted access to capital markets. In other words, they face higher transaction costs, which lead them to adjust their capital structure less frequently (Brav, 2009). This lack of financing flexibility is often regarded as a major disadvantage of private companies as compared to public ones (Huyghebaert and Van Hulle, 2006).
However, using insights from another fast growing field of research – the literature on business groups and internal capital markets – we argue that not all types of private companies face adjustment costs to the same extent. In many regions of the world – including Continental Europe, South East Asia and emerging markets regions as e.g. India – large numbers of companies are linked through common ownership structures (e.g. pyramids) to form business groups (cf. Masulis et al., 2009). For instance, more than 20% of the top 50,000 (in terms of revenue) non-financial
companies in the euro-zone are linked to a private domestic business group.1 Companies that are part of such a business group are expected to have better access to capital markets (both internal and external) than comparable stand-alone companies (Schiantarelli and Sembenelli, 2000; Almeida and Wolfenzon, 2006). If this is the case, business group member companies should be able to adjust their capital structure more frequently.
This paper empirically examines the capital structure adjustment process of large2, non-financial affiliates of Belgian private business groups and comparable stand-alone companies. Belgium is an interesting setting to study our research questions because all companies are obligated to file information on group related financing in the comments to the financial statements, which allows us to distinguish between internal and external leverage. In addition, it is a typical example of a civil law country where external capital markets are relatively underdeveloped compared to the Anglo Saxon world3, which implies that private companies play a very important role in the economy.
1 With a strict 50.01% control criterion, 20.6% of the top 50,000 (in terms of sales of 2006)
non-financial companies in the euro-zone are non-listed and have ties to a private business group (excluding government owned groups). (Source: Amadeus database, version April 2008).
2 Private is not necessarily synonymous with small in our Continental European setting. Many of the
business groups in our sample are among the largest competitors in their industry on a national or European level (average total assets of 135.3 million euros). Even many of the individual group affiliates we consider would meet the size requirements for stock exchange quotation on European exchanges as Euronext, Deutsche Börse or the London Stock Exchange.
3 Domestic equity market capitalization at the end of 2007 was 79.7% of GDP for Belgium, compared
to 143.9% for the US and 139.8% for the UK (Sources: World Federation of Exchanges, Euronext, Belgostat).
The sample selection ensures a clean test of the group versus stand-alone effect. First of all, we only include private stand-alone companies and affiliates of business groups without a stock-exchange listed component. This implies that neither type of companies has access to public capital markets (cf. Dewaelheyns and Van Hulle, 2010). Second, we only include domestic business group affiliates, so that all companies we consider operate within the same institutional framework and are subject to the same tax regime, bypassing potential confounding effects from international tax optimization of capital structure as described in Desai et al. (2004) or Huizinga et al. (2008). Finally, we limit the analysis to larger companies because only companies filing complete financial statements provide sufficient details on internal debt financing. The focus on larger companies has the additional advantage that a number of SME related problems w.r.t. capital structure decisions – for instance the fact that some owners or managers of SMEs might lack the economic expertise to make well-founded capital structure decisions (Van Auken, 2005) – are avoided.
As – to the best of our knowledge – this is the first paper in the literature to focus on the differences in leverage dynamics between private group affiliates and stand-alone companies, the empirical analysis starts with summary statistics and univariate tests on leverage levels and total, internal and external leverage adjustments. Next, we estimate target leverage models for the combined sample of stand-alone and group companies and for each sample separately. These estimated targets are used in second stage regressions, which are multinomial logistic models of the determinants of a substantial leverage increase or decrease. Throughout all types of empirical tests we find significant differences between group and stand-alone
companies in terms of levels of leverage and the leverage adjustment process. The evidence indicates that group affiliates take advantage of their better access to financing to more frequently adjust both their total leverage and their external leverage ratios. The results are robust to changes in methodology, model specifications and variable definitions.
The remainder of the paper is organized as follows. Section 2 gives a brief overview of the relevant literature on capital structure and capital structure dynamics. Section 3 provides a link with the literature on business groups and formulates the hypotheses. Section 4 discusses the sample and descriptive statistics and Section 5 contains the empirical analysis. Finally, Section 6 summarizes the main conclusions.
2. Capital Structure Research: an Increasing Focus on Dynamics
Most capital structure studies start from one or both of the most influential theoretical frameworks: the pecking order theory (Myers, 1984; Myers and Majluf, 1984) and the trade-off theory (Modigliani and Miller, 1963; DeAngelo and Masulis, 1980). Essentially, trade-off theory argues that leverage has both costs (e.g. increased bankruptcy risk and transaction costs) and benefits, e.g. tax deductibility (DeAngelo and Masulis, 1980) or reduction of agency problems (Jensen and Meckling, 1976; Jensen, 1986). Companies then set their leverage level such that the marginal benefits of adding more debt equals the marginal costs. This implies companies have a target, or optimal, level of leverage, which is affected by firm characteristics that reflect the company’s sensitivity to the different costs and benefits of debt. The pecking order theory, on the contrary, does not support the notion of an optimal leverage level
each time a need arises. This choice is based on transaction costs and costs arising from asymmetric information, resulting in a general pecking order of retained earnings over different debt classes (ranging from very safe to highly risky) to, lastly, equity. Both theories lead to testable hypotheses of the links between a number of company characteristics (e.g. size, age, profitability, risk, tangibility, etc.) and capital structure. Empirical studies (Titman and Wessels, 1988; Rajan and Zingales, 1995; Fama and French, 2002, among many others) tend to be inconclusive on which framework dominates. Research into corporate behaviour seems to support trade-off theory: in surveys among CFOs of public companies, Graham and Harvey (2001) and Bancel and Mittoo (2004) document that 81% of U.S. and 75% of European firms have a target level or target range of leverage. Brounen et al. (2006) confirm these results for a mixed sample of public and private companies from four European countries.
Several authors point out that trade-off theory only implies a relationship between the optimal leverage level and certain company characteristics, while most empirical papers examine observed leverage levels. If there are capital market frictions (e.g. transaction fees), or if companies try to time their financing operations based on market conditions, observed levels of leverage may systematically deviate from the optimum (among the first to raise this point were Taggart, 1977 and Marsh, 1982). Dynamic capital structure models (e.g. Fischer et al., 1989; Titman and Tsyplakov, 2007) allow reconciling the existence of a long-term optimal level of leverage (consistent with trade-off theory) with short-term pecking order behaviour. In other words, companies may allow their leverage levels to fluctuate according to pecking order theory until the deviation from the long term optimum becomes large
enough to warrant a costly leverage adjustment. The empirical literature addresses this issue by decomposing observed leverage into an unobserved target level and a deviation from the optimum. Some papers use the historic mean of leverage as a proxy for the target level (Javilvand and Harris, 1984; Shyam-Sunder and Myers, 1999). A small number of papers simultaneously model the target level and the speed of adjustment to the target using non-linear regression techniques (e.g. Heshmati, 2001 for Sweden and de Haas and Peeters, 2006 for transition economies), or explore aggregate data (Frank and Goyal, 2004).
The most popular method in the literature, however, is a two step estimation procedure in which the target or optimal leverage level is estimated first and the estimated optimum or the deviation from the optimum is used as a variable in a second stage regression. One type of research question that can be addressed in the second stage – often using GMM dynamic panel data techniques – is whether and how fast companies reduce the gap between their optimal and observed levels of leverage (de Miguel and Pindado, 2001; Ozkan, 2001; Gaud et al., 2005; Drobetz and Wanzenried, 2006; Flannery and Rangan, 2006). Another approach for the second stage is modelling the determinants of a substantial change in capital structure using probit or multinomial logistic regressions (Hovakimian et al., 2001; Korajczyk and Levy, 2003; Brav, 2004; Hovakimian et al., 2004) or hazard models (Leary and Roberts, 2005). The intuitive rationale for this approach is that, if companies care about an optimal capital structure, managers are likely to thoroughly analyse all of the trade-offs when they substantially adjust leverage (Hovakimian et al., 2001). To decide whether or not a company has adjusted its capital structure in a significant way, cut-offs are used (e.g. an increase or decrease in debt or equity of more than 5%
of book value of assets). Hovakimian et al. (2001) confirm that the classification of companies that have made capital structure adjustments according to the cut-off method corresponds quite well to SDC issue data for US companies. The cut-off method can easily be applied to our sample of private companies as it does not require data on individual debt issuances/retirements or equity issuances/repurchases. In fact, Leary and Roberts (2005) argue that cut-offs may be preferable over public capital transaction data because they also capture private debt transactions.
As we primarily focus on the determinants of major changes in capital structure, our empirical analysis follows the latter strand of literature (with multinomial logistic regressions as second step). However, as a robustness check, we also estimate partial adjustment models to evaluate the speed at which firms reduce the gap between optimal and observed leverage levels.
3. Capital Structure in Business Groups: Analysis and Hypotheses
The general literature on capital structure focuses on stand-alone companies. However, existing evidence from the business group literature indicates that the capital structure decision process of a group affiliate may be different. First, it is important to note that – contrary to the case of theoretical conglomerate studies, where external financing is often assumed to be raised by headquarters and passed through to the different divisions (e.g. Gertner et al., 1994; Stein, 1997) – business group affiliates are separate legal entities. As a result, these affiliates can directly access the external capital markets. In addition, group member companies may also have access to financing via an internal capital market which can be used to shift risks
and resources throughout the group’s structure (cf. Shin and Stultz, 1998; Deloof, 1998). Therefore, capital structure decisions of business group affiliates are likely to be the result of a group wide trade-off between the benefits and costs of different financing sources (equity/internal debt/external debt).
According to several authors the optimal total leverage level of a business group affiliate should be higher than that of a comparable stand-alone firm. Hoshi et al. (1990) argue that the costs arising from information asymmetries at debt renegotiations are smaller within business groups. These decreased potential costs of financial distress allow group members to ex ante take on more debt, thus realizing more tax gains and avoiding relatively expensive equity issues. A coinsurance effect across activities in diversified groups could further decrease costs of debt (cf. Berger and Ofek, 1995). Furthermore, an intra-group optimization process may take place via the internal capital market to reduce costs at all levels (cf. Faccio et al., 2001; Bianco and Nicodano, 2006; Dewaelheyns and Van Hulle, 2010), again increasing ex ante optimal leverage. Next, the affiliate may receive intra-group debt guarantees which could increase its debt bearing capacity even more (Chang and Hong, 2000). Finally, belonging to a business group may also have non-quantifiable beneficial effects: the group’s reputation may change perception and behavior of banks and other creditors, thus increasing access to external finance (cf. Schiantarelli and Sembenelli, 2000). On the other hand, groups are also able to exploit the limited liability of their members, i.e. letting lower level affiliates file for bankruptcy at the expense of external debt providers to save the remainder of the group’s activities (Bianco and Nicodano, 2006). These types of problems increase the cost of debt, and hence decrease the optimal level of leverage. However, in practice the benefits of allowing group
member companies to fail may be limited, as the failure of a large affiliate is likely to have a strong negative impact on group reputation. The results of Dewaelheyns and Van Hulle (2006) indeed indicate that Belgian business groups continue to support their troubled operating affiliates for as long as they can manage. Direct evidence on the differences in the total debt ratio between group affiliated and non-group affiliated companies is reported by e.g. Manos et al. (2007) who find significantly higher leverage levels for Indian listed group affiliates and Lee et al. (2000) and Jung et al. (2009) who show that Korean chaebol members are more highly levered than non-group companies. Therefore, in line with the literature, the first testable hypothesis is:
H1 – Business group companies are more highly levered than stand-alone companies.
Several of the arguments above may also have implications for leverage adjustments. As debt raised via the internal capital markets is owner provided and therefore can be renegotiated at very low to zero cost and does not suffer from major asymmetric information problems, capital structure adjustment costs may be lower for group member companies. The existence of intra-group guarantees and reputation effects which facilitate access to external financing are again likely to lower the costs of adjusting leverage. Empirical evidence on this issue is very limited: to the best of our knowledge, only one paper takes into account the impact of group-affiliation on capital structure adjustment: for a sample of Korean listed manufacturing companies Kim et al. (2006) find that both the target level of leverage and the speed of leverage adjustment are higher for chaebol members. Within our sample which consists of unlisted firms, an additional reason why there could be differences in capital structure adjustments between group and stand-alone companies is the fact that group affiliated
companies are less likely to face credit rationing by banks caused by asymmetric information (cf. Ghatak and Kali, 2001). Credit rationing may be an important reason why private companies do not raise their leverage, even if it is optimal to do so (Faulkender and Petersen, 2006). All of the above leads us to the second testable hypothesis:
H2 – Business group companies adjust their capital structure more frequently than stand-alone companies.
The total leverage of a typical group-affiliated company consists of two components: external and internal leverage. This implies that, compared to stand-alone companies, group companies have an additional capital structure choice to make: they have to decide on their total level of leverage and on the relative importance of internal and external debt (the internal/external debt concentration ratio). In other words, business group companies may also change the internal/external leverage concentration ratio as part of their capital structure optimization. For instance, Bianco and Nicodano (2006) show that the use of external debt at the affiliate level in Italian business groups is lower than at the holding level to limit costs of potential expropriation of creditors. Similar results are found by Piga (2002). Verschueren and Deloof (2006) report that internal debt is (at least partly) used as a substitute for external debt in Belgian firms. Desai et al. (2004) show that foreign affiliates of US-based multinational corporations use parent-provided debt as a substitute for external debt, especially in countries where access to external financing is limited or expensive. Dewaelheyns and Van Hulle (2010) find evidence consistent with a pecking order of internal debt over external (bank) debt and the presence of a group-wide optimization of financing costs linked to the relative use of
both debt sources in Belgian private domestic groups. Given this type of behaviour, the question arises whether the more frequent leverage adjustments hypothesized in H2 are solely caused by the use of highly flexible internal leverage. Specifically, due to the fact that affiliated companies can make use of the parent’s reputation and guarantees as instruments to reduce credit rationing and dissipative costs of external borrowing, one would predict that subsidiaries can more easily adjust their external leverage as well. To test whether these firms actually make use of these opportunities, we formulate our third hypothesis:
H3 – Business group companies adjust their external leverage more frequently than stand-alone companies.
4. Sample and Descriptive Statistics
We collect data on all private Belgian financial companies that file non-consolidated complete financial statements4 for at least six consecutive fiscal years during the period 1996 to 2005. The data are obtained from Bureau Van Dijk EP’s BelFirst database.
We select two samples: one consisting of business group affiliates, the other containing only stand-alone companies. For the group sample, we select operating
4 Under Belgian Accounting Law, companies are required to file complete (unconsolidated) accounts if
they meet at least two of the following criteria: total assets exceed 3.125 million euro, operating revenue exceeds 6.25 million euro, more than 50 full time equivalent employees. Companies with more than 100 full time equivalent employees always have to file complete accounts. All other firms may file abbreviated accounts, which contain less information on issues which are relevant to our research questions (e.g. intra-group financing).
affiliates of all Belgian non-financial private business groups filing group consolidated accounts (excluding State controlled groups).5 We define a company as being group affiliated if at least 50% of its shares are held (directly or indirectly) by the controlling company of the group.6 Because of the high levels of ownership concentration within most Belgian business groups, setting a lower threshold (e.g. 20%, cf. Gadhoum et al., 2005) would only have a marginal impact on the number of companies included.
To minimize the risk of misclassifying a group affiliated company as stand-alone, we use a double criterion to include a company in the stand-alone sample (cf. Dewaelheyns and Van Hulle, 2010): the company should not have a dominant incorporated shareholder (i.e. the largest incorporated shareholder does not control more than 20% of the sample company, directly or indirectly) and it should not use intra-group financing.
5 Although limiting the analysis to groups with consolidated accounts introduces a potential size bias
(companies are exempted from filing consolidated accounts if they do not surpass more than one of the following criteria: revenues of 20 million EUR, total assets of 10 million EUR, or 250 employees), it ensures that the variables that we define at the group level capture economic reality as accurately as possible. As an alternative, Manos et al. (2007) or Chang and Hong (2000) compute group level variables as the value weighted average of the individual member firms’ variables. Although this approach cancels the need for consolidated statements, it is likely to lead to information quality problems in our sample of private companies.
6 According to Belgian Accounting Law, all firms which are controlled by, or are controlling a
corporation, are considered to be affiliated. The Law defines control as owning more than 50% of the shares or the votes, or having common controlling shareholders who can appoint the majority of the board or can make strategic decisions. This control can also be the result of company bylaws, contracts or the existence of a consortium.
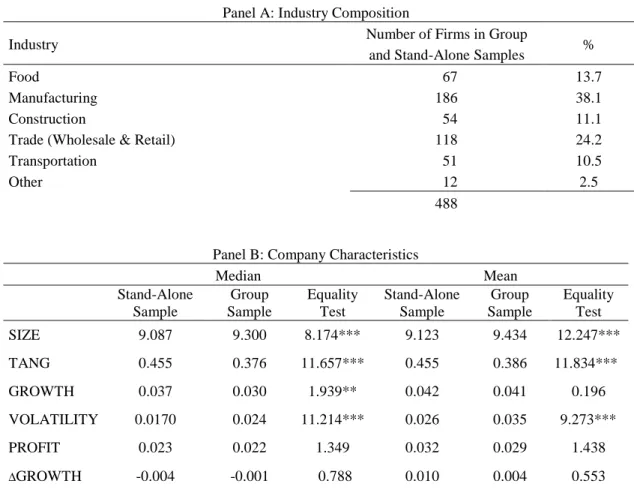
Following common practice, companies with zero sales, several categories of service companies (e.g. real estate management) and firms with extremely high leverage levels (>100% of total assets) are excluded.7 Using the criteria described above, we end up with a group sample of 4,488 firm years of 488 companies (part of 226 different business groups) which – due to variable construction and lagging – results in 2,536 testable firm years from the period 1999-2005. For reasons of comparability, we select a one-to-one sample of stand-alone companies that matches the industry and the size of the group sample firms as closely as possible.8 This results in a stand-alone sample of 2,875 testable firm years. Panel A of Table I shows that all major non-financial industries are represented in the sample, with an emphasis on manufacturing and distribution.
************************ Table I about here ************************
Based on the literature discussed in Section 2, we select a number of company characteristics that will function as control variables in the regression models:
7 Including firm years with extreme levels of leverage could potentially influence the results of the
target leverage models. However, as the 100% leverage level is only exceeded in 1.4% of all firm years, robustness checks show that including these observations would not affect our results.
8 Using the full stand-alone sample would lead to important differences in size and industry
distribution across samples. For instance, the total assets of the median group sample company are more than twice as large as those of the median firm in the unmatched stand-alone sample. Size matching is based on total assets. Industry matching is based on a 2-digit NACE classification code. As a robustness check, the tests were rerun on the unmatched stand-alone sample, with very similar results. This implies that the matching procedure is unlikely to impact our conclusions.
company size (SIZE, proxied by the logarithm of total assets); a tangible assets ratio (tangible fixed assets plus inventory to total assets, TANG); growth opportunities (GROWTH, proxied by the average annual sales growth of the last three firm years); earnings volatility (VOLATILITY, defined as the standard deviation of net earnings over total assets of the last three firm years); profitability (PROFIT, defined as net earnings over total assets) and changes in growth opportunities (∆GROWTH, which is the 1-yr change of the variable GROWTH). Table I Panel B reports the medians (left-hand side) and means (right-hand side) of these variables in the stand-alone and group samples, and statistics for equality tests across samples. First of all it should be noted that, even after matching for size, the companies in the group sample are still statistically significantly larger than those in the stand-alone sample, although this difference is unlikely to be important in economic terms (median total assets of 9.8 million euros for stand-alones vs. 12.1 million euros for affiliates). Several of the other characteristics are significantly different as well: compared to stand-alones, group affiliated companies have relatively less tangible assets, a somewhat lower sales growth rate and more volatile profitability ratios. The profitability ratios themselves do not significantly differ across samples, nor does the change in growth rates.
5. Tests and Results
5.1. LEVERAGE AND LEVERAGE DYNAMICS: UNIVARIATE TESTS
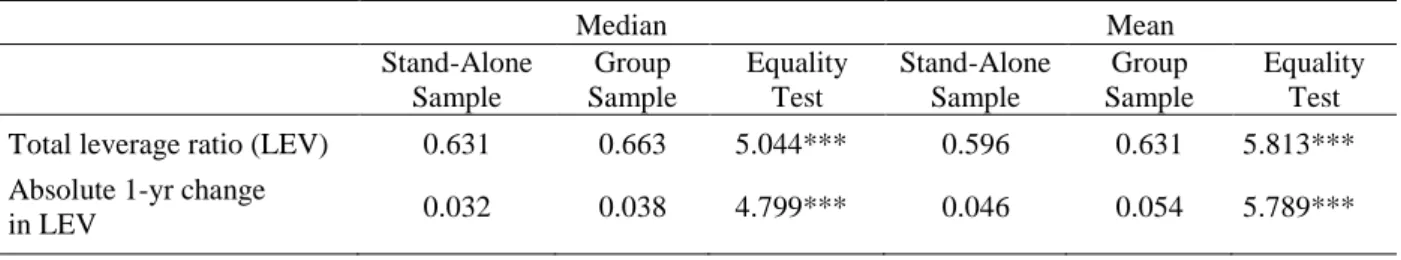
The first panel (Panel A) of Table II reports means and medians of the total leverage ratios of the companies in the stand-alone and group samples. Note that we use an overall leverage proxy (LEV, defined as long term liabilities plus short term liabilities over total assets; cf. Desai et al., 2004; Huizinga et al., 2008) while many
Anglo-Saxon studies focus on long-term debt as a measure of leverage. However, Titman and Wessels (1988) point out that in countries where short-term liabilities are important financing sources, measures of leverage should include these as well. The importance of short-term debt in Belgium has been confirmed by e.g. Deloof and Jegers (1999). Moreover, only this broad measure of leverage can be unambiguously split up into external and internal leverage based on the information provided by the comments to financial statements. Consistent with expectations (H1) and existing empirical evidence (e.g. Lee et al., 2000; Jung et al., 2009), total leverage is significantly higher for group member companies than for stand-alones (a difference of 3.5% in means and 3.2% in medians). More interestingly, however, the degree of change in leverage is different across samples as well. The mean absolute 1-yr change in total leverage ratio in the group sample is 5.4% (median of 3.8%), compared to 4.6% for the stand-alone sample (median of 3.3%). This may be a first indication that the leverage of group affiliates is adjusted more often (or to a greater extent) than that of comparable stand-alone companies, which is in line with hypothesis H2.
************************ Table II about here ************************
More explicit evidence of differences in leverage adjustment can be found in Panel B. Analogous to, for instance, Hovakimian et al. (2001) and Leary and Roberts (2005) we define a firm year with substantial leverage change as a firm year during which the total leverage ratio increases or decreases by more than 5% of total assets. Robustness checks show that although changing the cut-off to e.g. 3% or 7% obviously affects the number of leverage increase and decrease firm years, the main
results and conclusions of the univariate and multivariate tests remain unchanged. Group affiliated companies have significantly more leverage increases (in 17.6% of firm years) and decreases (in 22.7% of firm years) than stand-alones. Put differently, there is a substantial change in leverage in 40.3% of firm years in the group sample (i.e. one change every 2.5 years on average), compared to 33.5% of firm years in the stand-alone sample (i.e. one change every 3.0 years on average). Although direct comparison is difficult because of differences in data frequency and variable definitions, the occurrence of leverage adjustments in both of our samples is considerably lower than for the U.S. quoted companies in the sample of Leary and Roberts (2005) which adjust leverage about once a year on average. Given the fact that private companies have less access to equity and external debt financing, this is not surprising. Also note that there are significantly more leverage decreases than leverage increases in both samples. A potential explanation could be that corporate profits and growth during our sample period (1999-2005) were stable and relatively high, allowing companies to gradually reduce their leverage. In fact, the average total leverage ratio decreases from 64.5% (1999) to 59.1% (2005) in the group sample, and from 62.2% (1999) to 56.2% (2005) in the stand-alone sample. A final point of notice is that leverage adjustments are not only more frequent in group companies, they are also slightly larger (not reported in Table 2 to limit the Table’s size): the average change in the total leverage ratio is –9.6% for stand-alones vs. –10.2% for group affiliates in leverage decrease years (difference significant at the 5% level) and +9.6% (stand-alones) vs. +10.2% (group affiliates) in leverage increase years (difference significant at the 10% level).
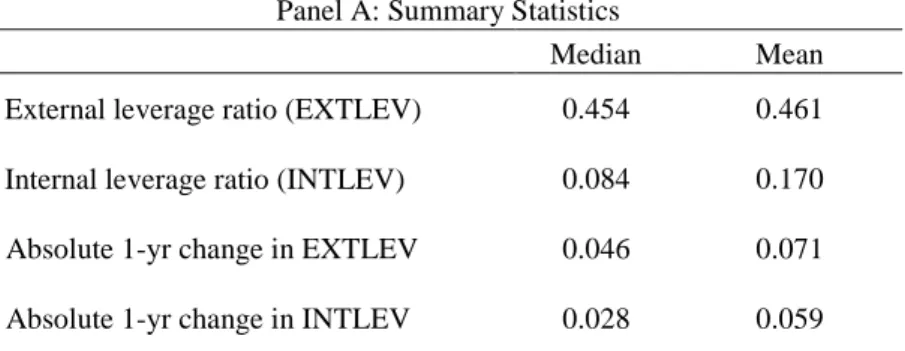
In the remainder of this sub-section we focus on the details of the types of leverage and leverage dynamics for the group sample reported in Table III. Panel A of Table III contains summary statistics on the external leverage ratio (EXTLEV = external liabilities/total assets) and the internal leverage ratio (INTLEV = internal liabilities/total assets). Consistent with empirical evidence of, for instance, Verschueren and Deloof (2006) and Dewaelheyns and Van Hulle (2010), we observe that although total leverage of affiliates is higher than that of stand-alones, the substantial use of internal leverage (internal leverage ratio of 17.0% on average) leads to lower external leverage ratios (mean of 46.1%) compared to stand-alones for which – by definition – all leverage is external (mean of 59.6%, see Table II Panel A).
************************ Table III about here ************************
The absolute one year changes in internal and external leverage ratios are relatively high compared to the changes found for stand-alone companies. In fact, even though external leverage is only a part of total leverage, the one year absolute changes in the external leverage ratio in group affiliated companies are larger (both in terms of means and medians) than the absolute changes in the total leverage ratios in stand-alone companies in Table II Panel A, which is consistent with hypothesis H3. Although the changes in internal leverage are smaller than those in external leverage in absolute terms, the changes in internal leverage ratios are more important in relative terms: the average change in internal leverage equals 34.7% of the average internal leverage ratio, while the average change in external leverage is 15.4% of the
average external leverage ratio. Table III Panel B confirms that both external and internal leverage are frequently adjusted. The external leverage ratio is substantially increased in 20.0% of firm years and decreased in 26.9% of firm years. In other words, group affiliates adjust their external leverage significantly9 more frequently than stand-alone companies (cf. Table II Panel B). Within the group sample, the number of increases in external leverage is not significantly different from the number of increases in internal leverage. However, external leverage is reduced much more frequently than internal leverage. This implies that the drop in total leverage ratio during the sample period mentioned above was predominantly caused by reducing external leverage (i.e. the more expensive debt type).10
5.2. TARGET LEVERAGE MODELS
Table IV reports results of least squares regression estimates of the optimal or target leverage ratios. Following Hovakimian et al. (2001), we split up the company specific control variables between the first and second stage regressions. Variables which have been empirically shown to be related to the long term trade-off optimum are included in the target leverage regression models (in our case, company size, tangibility, growth opportunities and earnings volatility); while variables which are more relevant to pecking order are used in the second stage regression models (i.e. determinants of leverage adjustments models, see Section 5.3). Company size (SIZE)
9 Test statistics for Z-test of equality of proportions of firm years with external leverage adjustments
between stand-alone sample and group sample: 6.10 (leverage increase firm years) and 6.27 (leverage decrease firm years).
10 There is a downward trend in the average external debt ratio in the group sample (from 49.6% in
1999 to 41.3% in 2005) and a moderately upward trend in the average internal debt ratio (from 14.9% in 1999 to 17.8% in 2005).
should be positively related to the optimal level of leverage as larger companies, ceteris paribus, have lower relative costs of financial distress (Rajan and Zingales, 1995). Tangible assets can be used as collateral for loans. As collateralization reduces the expected costs of bankruptcy for the lender and thus lowers the cost of debt, companies with a higher tangible assets ratio (TANG) should have a higher optimal level of leverage. Companies with strong growth opportunities (GROWTH) may prefer lower leverage levels, due to increased asymmetric information problems and the fact that debt servicing could hinder growth (McConnell and Servaes, 1995). Earnings volatility (VOLATILITY) is a measure of risk and should therefore be negatively related to the target leverage level.
************************ Table IV about here ************************
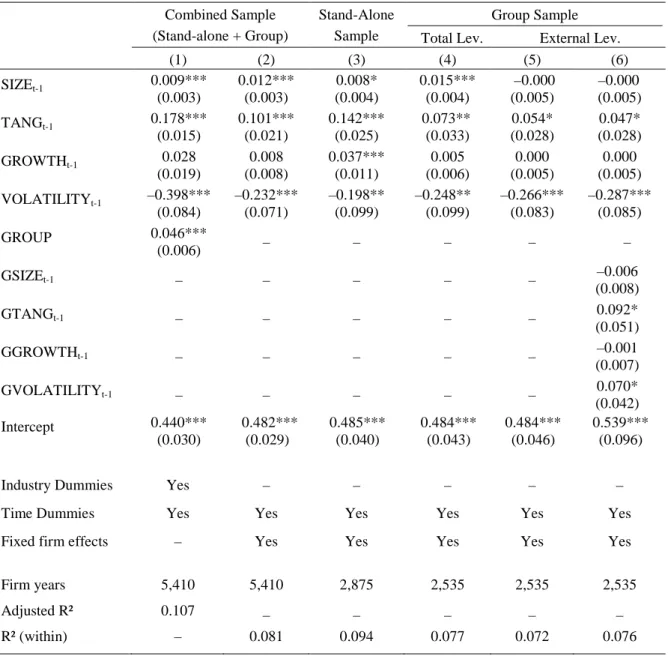
Models 1 and 2 in Table IV are estimated using all testable firm years (i.e. from both the stand-alone and the group sample). Model 1 is a pooled OLS regression with industry and time dummies which includes the four company specific control variables and a dummy (GROUP) which distinguishes the group affiliates from the stand-alone firms. All explanatory variables are lagged one period to avoid simultaneity biases. As expected, target leverage is positively related to a company’s size (SIZE) and tangibility (TANG) and negatively related to risk which is proxied by VOLATILITY. GROWTH is not significant. The GROUP dummy is highly significant and positively related to target leverage: after controlling for company characteristics and industry effects, the target leverage level of group affiliates is about 4.6% higher than that of stand-alones (cf. H1). Model 2 includes fixed firm
effects to control for all firm specific characteristics not captured by the other variables. Given that there is very little mobility across samples (i.e. companies are either group affiliated or stand-alone and remain so during the entire sample period), the GROUP dummy can no longer be included. The results for the remaining variables are similar to those in model 1.
Next, models 3 and 4 in Table IV are fixed effects models for the stand-alone and the group member sample separately. For both types of companies, the target total leverage ratio increases with size and tangibility and decreases with earnings volatility. The main difference is that growth opportunities are significantly related to target leverage for stand-alone companies, but are not significant for affiliates. The positive sign of GROWTH differs from the literature’s expectation for public companies and suggests that the privately held companies in our stand-alone sample need to resort to debt to finance growth, in view of their limited access to equity. In the final two models in Table IV (models 5 and 6) the dependent variable is the external leverage ratio (EXTLEV) instead of the total leverage ratio (LEV). Model 5 shows that, just as for total leverage, the target external leverage ratio is positively related to TANG and negatively related to VOLATILITY. SIZE and GROWTH are not significant. In model 6 we do not only include company level control variables, but also add some analogous variables computed at the consolidated group level (GSIZE, GTANG, GGROWTH and GVOLATILITY; cf. Dewaelheyns and Van Hulle, 2010). The tangible assets ratio of the consolidated group (GTANG) is positively related to its subsidiary’s optimal external leverage ratio. More collateralizable assets within the group may raise a subsidiary’s likelihood of receiving direct or indirect group guarantees. The coefficient of GVOLATILITY is
significantly positive (at the 10% level). This is in line with Bianco and Nicodano (2006), who argue that groups may raise debt at affiliate level instead of at group headquarters, to be able to exploit the affiliate’s limited liability in case of financial difficulties: in times of distress they could let one or more affiliates go bankrupt to save the rest of the group. If this is the case, the target use of external debt by affiliates of riskier groups (i.e. groups with higher earnings volatility) will be higher.
5.3. DETERMINANTS OF LEVERAGE INCREASES AND DECREASES
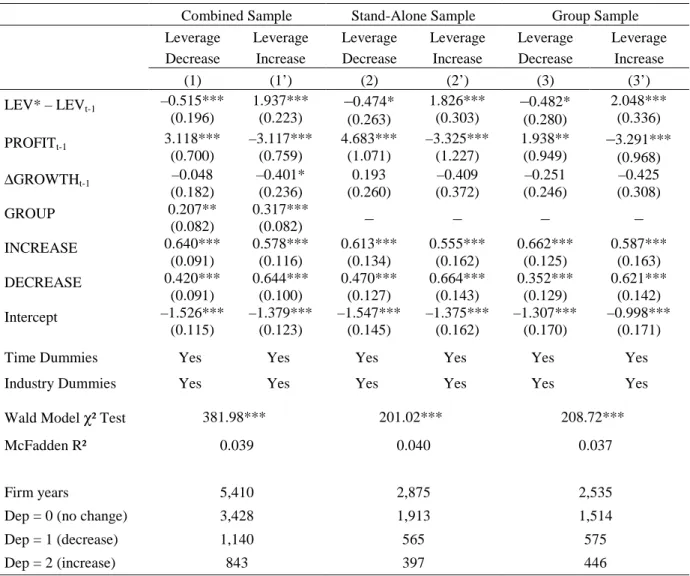
We now turn to multinomial logistic regressions which simultaneously model the determinants of the probability that a company substantially increases or decreases its total leverage (following the definition outlined in Section 5.1) versus the probability of no change in leverage. The models include the company’s deviation from the optimum as the difference between this year’s target (LEV*, estimated in the previous sub-section) and the actual level of leverage in the previous firm year (LEVt-1). The company level control variables in the increase/decrease models are related to pecking order theory, according to which strong (weak) profitability (PROFIT) causes a company to reduce (increase) its level of leverage and changes in leverage may also coincide with changes in growth opportunities (∆GROWTH). In addition, we include dummies which indicate whether or not there was an increase or decrease of leverage in the previous period (INCREASE and DECREASE). Leary and Roberts (2005) argue that if companies do not adjust their capital structure as long as their level of leverage remains within certain upper and lower bounds – set according to the trade-off between the benefits of adjusting and the costs of doing so – an increase (decrease) in the previous period will automatically bring leverage closer to the upper (lower) bound and hence will raise the likelihood of a leverage decrease (increase) in
the current period. The first system of equations reported in Table V is estimated on the combined sample including both stand-alone and group affiliated companies and also contains the group membership dummy (GROUP). Given the panel structure of our data set, inferences are based on cluster robust standard errors (CRSE) which allow for potential within-cluster (i.e. company specific or group specific) correlation of the error terms.11
************************ Table V about here ************************
In the first system of equations, the deviation from the target (i.e. the predicted value from Table IV model 3 for the stand-alone companies and Table IV model 4 for the group affiliates)12 is a very important determinant of both the total leverage decrease (equation 1) and the total leverage increase decision (equation 1’), with the expected signs. For instance, if LEV* – LEVt-1 is positive the company’s leverage is below its target level, which reduces the probability of a leverage decrease and raises
11
Note that there are two levels of potential error clustering in the group sample: within company-specific clusters and within group-company-specific clusters. Given there is no transference of ownership of sample companies across groups in our sample, the two levels of clustering are nested, and the highest level of clustering (i.e. the group level) should be used to compute the CRSE (cf. Cameron et al., 2006).
12 Several types of robustness checks on the model specification were performed: (i) different target
leverage ratios (based on Table IV model 1 or Table IV model 2); (ii) allowing for a different
coefficient for deviation to the target (LEV* – LEVt-1) across affiliates and stand-alones and (iii)
allowing for different coefficients for all explanatory variables across affiliates and stand-alones. Findings remain qualitatively unchanged.
the probability of an increase in leverage in the current period. This result is consistent with trade-off theory, but there is also evidence supporting pecking order: strong net profitability (PROFIT) increases the probability of a leverage decrease decision and lowers the likelihood that the company will raise the level of leverage. The change in growth opportunities (∆GROWTH) is only significant (at the 10% level) in equation 1’: companies with an increase in growth opportunities are less likely to increase their total leverage ratio. Overall, the results are in line with those of e.g. Hovakimian et al. (2004) who also document elements of both trade-off and pecking order behavior. More important from the point of view of this paper’s research questions however, is the fact that the GROUP dummy is significantly related to both leverage increase and decrease probabilities. This confirms the univariate results from Section 5.1: ceteris paribus, group member companies are more likely to adjust their leverage than comparable stand-alone firms (H2). In terms of marginal effects, a group member company has a 5.52% lower probability of not adjusting its leverage (the multinomial logit model’s base case), using mean values for all other explanatory variables. A final point of interest is that, contrary to Leary and Roberts’ (2005) findings for U.S. quoted companies a leverage increase (decrease) in the previous period does not only lead to a better chance of a decrease (increase) in leverage in the next period. Any given change in leverage also significantly raises the probability of another adjustment in the same direction. This could indicate that, given the fact that the privately held companies in our sample have more limited access to financing than quoted firms, some of them may need to adjust their capital structures gradually through time in order to make major changes. The second and third systems of equations in Table V are estimated for the
stand-alone sample and group sample separately. If we compare equations 2 and 2’ or 3 and 3’ to equations 1 and 1’ we observe that most results are analogous.
************************ Table VI about here ************************
While Table V examines changes in total leverage, Table VI focuses on external leverage (EXTLEV). Table VI only reports estimates for the combined sample and the group sample, as all leverage is by definition external for stand-alones, which implies that the results of the second system of equations in Table V still apply. In equations 1 and 1’ (combined sample), we use the predicted target leverage ratios from Table IV model 3 (stand-alones) and Table IV model 6 (affiliates) as proxies for the target external leverage ratio (EXTLEV*).13 Results are very similar to those of equations 1 and 1’ in Table V concerning total leverage. The positive and highly significant coefficients of the GROUP dummy support hypothesis H3, which states that subsidiaries also adjust their external leverage more frequently than stand-alone companies. A marginal effects analysis shows that a group member company has a 12.81% lower probability of not adjusting its external leverage, using mean values for all other explanatory variables. In order to examine whether or not external leverage changes are related to the financial health of the group (measured by an Altman Z”-score, see Altman, 1993) the models in Table VI also contain a dummy variable (BADGROUP) which has a value of 1 if the company is an affiliate
of a group in the bottom 5% of group health within our sample.14 Equation 1 shows that being an affiliate of a group in poor financial health – after controlling for the distance to the target, profitability, changes in growth opportunities, etc. – has no effect on the likelihood of an external leverage decrease. However, it does have a significant negative impact on the probability of an increase in external leverage (equation 1’): affiliates of business groups in poor financial health are not able to benefit from the group’s reputation and are likely to be more restricted in their access to external financing compared to strong groups’ affiliates. The total effect of belonging to a group in poor financial health compared to being a stand-alone company is the sum of the coefficients for GROUP and BADGROUP, which is negative, but not significant at the 10% level. In other words, ceteris paribus, the probability of an external leverage increase for an affiliate of a weak group does not differ from that of a stand-alone company.
The second system of equations reported in Table VI (3 and 3’) takes a closer look at the external leverage adjustment process within the group sample. Compared to the results of equations 2 and 2’ in Table V for the total leverage ratio of stand-alone companies, there are two main differences. First, strong profitability raises the probability of a leverage decrease (PROFIT is significant at the 1% in equation 2 in Table IV), while it is not significant for a decrease in external leverage in the group sample. Moreover, strong profitability reduces the likelihood of an increase in leverage for both stand-alone and group member companies, but the effect seems
14 Results are robust for a 7.5 or 10% cutoff. Higher cutoffs are unlikely to be appropriate for
identifying groups in poor financial health because the general financial condition of Belgian business groups is quite strong (historical failure rates are well below 1% per year).
stronger for stand-alones. The evidence supporting pecking order theory is therefore weaker for group companies: due to the availability of funding through the internal capital market, affiliates’ external leverage decisions are not necessarily related to their short term profitability. A second major difference is that an increase in external leverage (EXTINCREASE) during the previous fiscal year is not significantly related to the probability of another external leverage increase and a decrease (EXTDECREASE) during the previous year only raises the likelihood of another decrease in external leverage at the 10% level. The pattern of external leverage increases and decreases (increase followed by decrease and vice versa) suggests that group affiliates have less restricted access to external financing than stand-alone companies allowing them to engage in dynamic trade-off behavior more comparable to that observed in public companies (cf. hypothesis H3). This effect is also consistent with our finding that the average change in external leverage is much larger for affiliates than for stand-alones (see Section 5.1). If the size of an adjustment is larger, the likelihood of overshooting the target increases, which could lead to a sequence of adjustments in opposite directions. The results w.r.t. the financial health of the group are comparable to those from the first system of equations in Table VI: no significant effect on the leverage decrease probability (equation 2), but a significantly negative coefficient for BADGROUP in the leverage increase equation (equation 2’).
5.4. ROBUSTNESS: PARTIAL ADJUSTMENT MODELS
In addition to the various robustness checks regarding sample composition, variable definitions and model specifications which were already discussed (see for instance footnotes 7, 12, 13 and 14), this sub-section explores another important type of robustness issue: an alternative methodology, i.e. partial adjustment models.
As mentioned in Section 2, the main alternative for the discrete choice estimation technique in Section 5.3 is a partial adjustment (PA) model. The basic form of a one step PA model (see Flannery and Rangan, 2006 for an overview of different model types) is:
LEVi,t = (1 – λ) LEVi,t-1 + (λβ) Xi,t (1) where λ is the speed of adjustment and Xi is a vector of company characteristics that determine the optimal level of leverage. In a perfect market with no adjustment costs,
λ would always be equal to 1, implying all companies would be at their optimal level at all times. In practice, due to the existence of non-trivial adjustment costs (e.g. transaction costs, fees, searching costs, etc.), a company will only gradually adjust to its optimal leverage level over time. As long as |λ| < 1, LEV will converge to the optimum, (λβ) X if t →∞.
************************ Table VII about here ************************
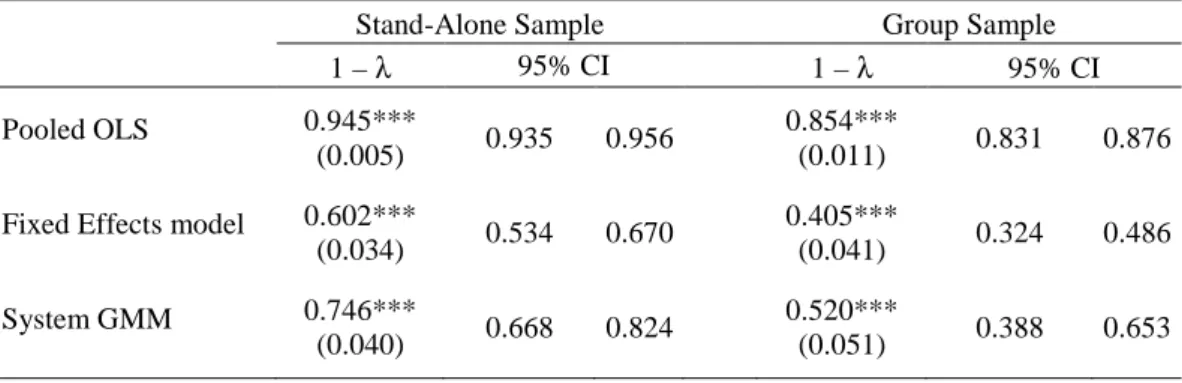
Table VII reports results from partial adjustment models based on three different estimation techniques: pooled OLS, fixed firm effects and an Arellano-Bover/Blundell-Bond-type system GMM estimation. The models include all available company specific control variables (SIZE, TANG, GROWTH, VOLATILITY, PROFIT and ∆GROWTH), but only the coefficients for the lagged leverage ratio (i.e. the estimates of 1 – λ) are reported to limit the size of the Table. The models in Table VII focus on external leverage adjustments; i.e. the dependent variables are the total leverage ratio (LEV) – which equals the external leverage ratio – for stand-alones and
the external leverage ratio (EXTLEV) for group companies. The estimates for (1 – λ) differ substantially across estimation techniques, which has often been observed in the literature. Based on pooled OLS (which ignores firm specific effects), estimates for the speed of adjustment (λ) are biased downwards, while fixed effects models are likely to suffer from short panel bias and lead to upward biased estimates of λ. The system GMM estimates for λ are typically in between those of OLS and fixed effects and should be most reliable (cf. Flannery and Hankins, 2010). Most important from the point of view of this paper is that the estimates of (1 – λ) are significantly lower in the group sample than in the stand-alone sample: the 95% confidence intervals reported in Table VII do not overlap, regardless of the estimation technique. This is consistent with our hypotheses: group member companies face lower adjustment costs and will more quickly close the gap between their actual and optimal level of external leverage (48.0% per year based on system GMM) than stand-alone companies (25.4% per year).
6. Conclusions
We find significant differences in the use and the determinants of leverage and the leverage adjustment process between samples of non-financial affiliates of Belgian private business groups and stand-alone companies. We show that group affiliates not only have higher levels of leverage, but that they also adjust their capital structure more frequently and in larger steps than stand-alones. Group affiliates have significantly higher target levels of leverage than stand-alones and the optimal leverage level of an affiliate is driven by both company level and group level characteristics.
Using multinomial logistic regressions we show that – controlling for company, time and industry effects – group companies are significantly more likely to substantially increase or decrease their leverage than stand-alones. For both types of companies, the distance to the optimal leverage level is significantly related to the probability of a leverage adjustment, which is consistent with trade-off theory. The overall evidence for short term pecking order behaviour (adjusting leverage according to net earnings) is stronger for stand-alone companies than for group affiliates. Finally, our evidence suggests that the flexibility in group companies’ capital structure is not solely driven by the use of internal leverage: group affiliates more frequently adjust their external leverage as well, unless the group is in poor financial health, in which case the affiliates’ probability of attracting external leverage is severely reduced. Our results are robust to changes in methodology, model specifications and variable definitions.
The higher financing flexibility of group companies compared to that of stand-alone competitors may be one of the reasons why private business groups continue to flourish in many parts of the world without apparently feeling the need to become publicly quoted. In this respect, an interesting topic for further research could be comparing the leverage adjustment process of the affiliates of groups with a publicly quoted holding company and those of private business groups.
References
Almeida, H. And Wolfenzon, D. (2006) Should business groups be dismantled? The equilibrium costs of efficient internal capital markets, Journal of Financial
Economics 79, 99-144.
Altman, E.I. (1993) Corporate Financial Distress and Bankruptcy: A Complete Guide to Predicting and Avoiding Distress and Profiting from Bankruptcy, 2nd ed., John Wiley & Sons, New York.
Bancel, F. and Mittoo, U.R. (2004) Cross-Country Determinants of Capital Structure Choice: A Survey of European Firms, Financial Management 33, 103-132.
Berger, P.G. and Ofek, E. (1995) Diversification’s Effect on Firm Value, Journal of
Financial Economics 37, 39-65.
Bianco, M. and Nicodano, G. (2006) Pyramidal groups and debt, European Economic
Review 50, 937-961.
Brav, O. (2009) Access to Capital, Capital Structure, and the Funding of the Firm,
Journal of Finance 64, 263-308.
Brounen, D., de Jong, A. and Koedijk, K. (2006) Capital Structure Policies in Europe: Survey Evidence, Journal of Banking and Finance 30, 1409-1442.
Cameron, A.C., Gelbach, J.B. and Miller, D.L. (2006) Robust Inference with Multi-Way Clustering, Working Paper (NBER Technical Working Paper 327).
Chang, S.J. and Hong, J. (2000) Economic Performance of Group-Affiliated Companies in Korea: Intragroup Resource Sharing and Internal Business Transactions, Academy of Management Journal 43, 429-448.
DeAngelo, H. and Masulis, R.W. (1980), Optimal Capital Structure under Corporate and Personal Taxation, Journal of Financial Economics 8, 3-29.
de Haas, R. and Peeters, M. (2006) The Dynamic Adjustment towards Target Capital Structures of Firms in Transition Economies, Economics of Transition 14, 133-169.
de Miguel, A. and Pindado, J. (2001) Determinants of Capital Structure: New Evidence from Spanish Panel Data, Journal of Corporate Finance 7, 77-99. Deloof, M. (1998) Internal Capital Markets, Bank Borrowing and Financing
Constraints: Evidence from Belgian Firms, Journal of Business Finance and
Accounting 25, 945-968.
Deloof, M. and Jegers, M. (1999) Trade Credit, Corporate Groups, and the Financing of Belgian Firms, Journal of Business Finance and Accounting 26, 945-966. Desai, M.A., Foley, C.F. and Hines, J.R. (2004) A Multinational Perspective on
Capital Structure Choice and Internal Capital Markets, Journal of Finance 59, 2451-2487.
Dewaelheyns, N. and Van Hulle, C. (2006) Corporate Failure Prediction Modelling: Distorted by Business Groups’ Internal Capital Markets?, Journal of Business
Finance and Accounting 33, 909-931.
Dewaelheyns, N. and Van Hulle, C. (2010) Internal Capital Markets and Capital Structure: Bank versus Internal Debt, European Financial Management, forthcoming, doi: 10.1111/j.1468-036X.2008.00457.x
Drobetz, W. and Wanzenried, G. (2006) What Determines the Speed of Adjustment to the Target Capital Structure?, Applied Financial Economics 16, 941-958. Faccio, M., Lang, L.H.P. and Young, L. (2001) Debt and Corporate Governance,
Working Paper (University of Notre Dame).
Fama, E.F. and French, K.R. (2002) Testing Trade-Off and Pecking Order Predictions about Dividends and Debt, Review of Financial Studies 15, 1-33.
Faulkender, M. and Petersen, M.A. (2006), Does the Source of Capital Affect Capital Structure?, Review of Financial Studies 19, 45-79.
Fischer, E.O., Heinkel, R. and Zechner, J. (1989), Dynamic Capital Structure Choice: Theory and Tests, Journal of Finance 44, 19-40.
Flannery, M.J. and Hankings, K. (2010) Estimating Dynamic Models in Corporate Finance, Working Paper.
Flannery, M.J. and Rangan, K.P. (2006) Partial Adjustment toward Target Capital Structures, Journal of Financial Economics 79, 469-506.
Frank, M.Z. and Goyal, V.K. (2004) The Effect of Market Conditions on Capital Structure Adjustment, Finance Research Letters, 1, 47-55.
Gadhoum, Y., Lang, L.H.P. and Young, L. (2005) Who Controls US?, European
Financial Management 11, 339-363.
Gaud, P., Jani, E., Hoesli, M. and Bender, A. (2005) The Capital Structure of Swiss Companies: an Empirical Analysis Using Dynamic Panel Data, European
Financial Management 11, 51-69.
Ghatak, M. and Kali, R. (2001) Financially Interlinked Business Groups, Journal of
Economics and Management Strategy 10, 591-619.
Gertner, R.H., Scharfstein, D.S. and Stein, J.C. (1994) Internal versus External Capital Markets, Quarterly Journal of Economics 109, 1211-1230.
Graham, J.R. and Harvey, C.R. (2001) The Theory and Practice of Corporate Finance: Evidence from the Field, Journal of Financial Economics 60, 187-243. Heshmati, A. (2001) The Dynamics of Capital Structure: Evidence from Swedish
Micro and Small Firms, in I. Hassan and W.C. Hunter (eds.), Research in Banking and Finance, Vol. 2. Elsevier Science, Oxford, pp. 199-241.
Hoshi, T., Kashyap, A. and Scharfstein, D. (1990) The Role of Banks in Reducing the Costs of Financial Distress in Japan, Journal of Financial Economics 27, 67-88. Hovakimian, A., Hovakimian, G. and Tehranian, H. (2004) Determinants of Target
Capital Structure: the Case of Dual Debt and Equity Issues, Journal of Financial
Economics 71, 517-540.
Hovakimian, A., Opler, T. and Titman, S. (2001) The Debt-Equity Choice, Journal of
Financial and Quantitative Analysis 36, 1-24.
Huizinga, H., Laeven, L. and Nicodeme, G. (2008) Capital Structure and International Debt Shifting, Journal of Financial Economics 88, 80-118.
Huyghebaert, N. and Van Hulle, C. (2006), Structuring the IPO: Empirical Evidence on the Portions of Primary and Secondary Shares, Journal of Corporate Finance 12, 296-320.
Javilvand, A. and Harris, R.S. (1984) Corporate Behaviour in Adjusting to Capital Structure and Dividend Targets: An Econometric Study, Journal of Finance 39, 127-145.
Jensen, M.C. (1986) Agency Costs of Free Cash Flow, Corporate Finance, and Takeovers, American Economic Review 76, 323-329.
Jensen, M.C. and Meckling, W.H. (1976) Theory of the Firm: Managerial Behaviour, Agency Costs and Ownership Structure, Journal of Financial Economics 3, 305-360.
Jung, K., Kim, B. and Kim, B. (2009) Tax Motivated Income Shifting and Korean Business Groups, Journal of Business Finance and Accounting 36, 552-586.
Kim, H., Heshmati, A. and Aoun, D. (2006) Dynamics of Capital Structure: The Case of Korean Listed Manufacturing Companies, Asian Economic Journal 20, 275-302.
Korajczyk, R.A. and Levy, A. (2003) Capital Structure Choice: Macroeconomic Conditions and Financial Constraints, Journal of Financial Economics 68, 75-109.
Leary, M.T. and Roberts, M.R. (2005) Do Firms Rebalance their Capital Structures?,
Journal of Finance 60, 2575–2619.
Lee, J-W., Lee, Y-S. and Lee, B-S. (2000) The Determination of Corporate Debt in Korea, Asian Economic Journal 14, 333-356.
Manos, R., Murinde, V. and Green, C.J. (2007) Leverage and Business Groups: Evidence from Indian Firms, Journal of Economics and Business 59, 443-465. Marsh, P. (1982) The Choice Between Equity and Debt: An Empirical Study, Journal
of Finance 37, 121-144.
Masulis, R.W., Pham, P.K. and Zein, J. (2009) Family Business Groups around the World: Costs and Benefits of Pyramids, ECGI Finance Working Paper 249. McConnell, J.J. and Servaes, H. (1995) Equity Ownership and the Two Faces of
Debt, Journal of Financial Economics 39, 131-157.
Modigliani, F. and Miller, M.H. (1963) Corporate Income Taxes and the Cost of Capital: A Correction, American Economic Review 53, 433-443.
Myers, S.C. (1984) The Capital Structure Puzzle, Journal of Finance 39, 575-592. Myers, S.C. and Majluf, N.S. (1984) Corporate Financing and Investment Decisions
When Firms Have Information the Investors Do Not Have, Journal of Financial
Economics 13, 187-221.
Ozkan, A. (2001) Determinants of Capital Structure and Adjustment to Long Run Target: Evidence from UK Company Panel Data, Journal of Business Finance
and Accounting 21, 175-198.
Piga, C.A.G. (2002) Debt and Firms’ Relationships: The Italian Evidence, Review of
Industrial Organization 20, 267-282.
Schiantarelli, F. and Sembenelli, A. (2000) Form of Ownership and Financial Constraints: Panel Data Evidence from Leverage and Investment Equations,
Empirica 27, 175-192.
Shin, H-H. and Stulz, R.M. (1998) Are Internal Capital Markets Efficient?, Quarterly
Journal of Economics 113, 531-550.
Shyam-Sunder, L. and Myers, S.C. (1999) Testing Static Tradeoff Against Pecking Order Models of Capital Structure, Journal of Financial Economics 51, 219-244. Stein, J.C. (1997) Internal Capital Markets and the Competition for Corporate
Resources, Journal of Finance 52, 83-109.
Rajan, R.G. and Zingales, L. (1995) What Do We Know About Capital Structure: Some Evidence from International Data, Journal of Finance 50, 1421-1460. Taggart, R.A. (1977) A Model of Corporate Financing Decisions, Journal of Finance
32, 1467-1484.
Titman, S. and Tsyplakov, S. (2007) A dynamic model of optimal capital structure,
Review of Finance 11, 401-451.
Titman, S. and Wessels, R. (1988) The Determinants of Capital Structure Choice,
Journal of Finance 43, 1-19.
Van Auken, H.E. (2005) A Model of Small Firm Capital Acquisition Decisions,
International Entrepreneurship and Management Journal 1, 335-352.
Verschueren I. and Deloof, M. (2006) How does Intragroup Financing Affect Leverage? Belgian Evidence, Journal of Accounting, Auditing and Finance 21, 83-108.
Table I. Sample Properties
SIZE is defined as ln(total assets) with total assets in real terms (base = January 1996); TANG is defined as tangible fixed assets plus inventory over total assets; GROWTH is defined as the average annual sales growth of the last three firm years (in %); VOLATILITY is defined as the standard deviation of net earnings over total assets of the last three firm years (in %); PROFIT is defined as net earnings over total assets; ∆GROWTH is defined as the change in annual sales growth; Equality tests across group and stand-alone samples: t-statistics for t-tests (equality of means) and Wilcoxon Mann-Whitney tests (equality of medians); *** denotes significance at the 1% level; ** denotes significance at the 5% level.
Panel A: Industry Composition
Industry Number of Firms in Group
and Stand-Alone Samples %
Food 67 13.7
Manufacturing 186 38.1
Construction 54 11.1
Trade (Wholesale & Retail) 118 24.2
Transportation 51 10.5
Other 12 2.5
488
Panel B: Company Characteristics
Median Mean Stand-Alone Sample Group Sample Equality Test Stand-Alone Sample Group Sample Equality Test SIZE 9.087 9.300 8.174*** 9.123 9.434 12.247*** TANG 0.455 0.376 11.657*** 0.455 0.386 11.834*** GROWTH 0.037 0.030 1.939** 0.042 0.041 0.196 VOLATILITY 0.0170 0.024 11.214*** 0.026 0.035 9.273*** PROFIT 0.023 0.022 1.349 0.032 0.029 1.438 ∆GROWTH -0.004 -0.001 0.788 0.010 0.004 0.553