An Open Framework to Deploy Heterogeneous
Wireless Testbeds for Cyber-Physical Systems
Marcin Szczodrak
Columbia University [email protected]Yong Yang
Philips Research North America yong.yang [email protected]
Dave Cavalcanti
Philips Research North AmericaLuca P. Carloni
Columbia University [email protected]Abstract—We present an open framework for the efficient deployment of heterogeneous wireless testbeds for Cyber-Physical Systems (CPS). The testbed architecture, which can be configured and optimized for each particular deployment, consists of a low-power wireless network (LPWN) of embedded devices, a backbone network, and a server back-end. Our framework, whose source code is publicly available, includes a comprehensive set of software tools for deploying, testing, reconfiguring, and evaluating the CPS application software and the supporting firmware. We discuss the architecture, the framework properties, and the hardware resources that are necessary to deploy an experimental testbed. We present two case studies built with our framework: an outdoor lighting installation in a commercial parking lot and an indoor university building instrumentation. Using the two deployments, we present experiments normally conducted by CPS engineers to better understand the environment in which the CPS is deployed. The results of these experiments show the feasibility of the proposed framework in assisting CPS research and development.
I. INTRODUCTION
Many cyber-physical system (CPS) [24] applications involve the deployment of low-power wireless networks (LPWN). These networks consist of a set of embedded devices (motes) that combine computation and communication infras-tructures with sensing and actuating capabilities to interact with the physical environment. A typical mote has limited computation, communication, and memory resources [13], [23], [30] and minimal operating system support [7], [8], [17]. The interaction of the cyber infrastructure with the physical world is controlled by a distributed, concurrent, and heterogeneous system [5], [26]. The design of such system and the programming of the application software is a complex engineering task [15], [28], which includes a critical validation step [14], [22] that requires physical implementation.
During new system installation, CPS engineers and re-searchers can find only limited help in the use of network simulators [16], [21] and remote network testbeds [2], [4], [6], [11], [18], [29]. Even the most advanced models of wireless communication and hardware architecture do not offer a testing environment that can capture all the system design aspects that impact reliability and operation. In fact, many issues only become apparent in real deployments. Hence, the correct execution of an application and the evaluation of the scalability and robustness of the networking properties are performed on remote LPWN testbeds. As illustrated in Fig. 1(a), a LPWN testbed allows an engineer to remotely deploy a new firmware image on every mote through a web-interface. However, due to the increasing demand from development teams and to the
INTERNET DB
WEB 010100100...
ERROR
(a) Testbed Control
Server Back-end Testbed Managem ent Backbone Network OPEN TESTBED FRAMEWORK (b) Testbed Framework Fig. 1. (a) An engineer tests a program on a remote testbed. (b) High-level structure overview of the framework.
small number of LPWN testbeds, there is a limited time to run experiments on them.
Furthermore, neither simulators nor remote testbeds can capture the CPS design peculiarities. These include under-standing and processing signals from the actual interaction with the physical world, the intrinsic property of any CPS application. To conduct their research, many CPS developers set up their own local testbeds for early prototyping and system evaluation. These testbeds need to provide a good degree of deployment flexibility and support various services for system reconfiguration and experimental evaluation. Given the broad spectrum of CPS applications and the evolution of software during the development process, the testbeds should also accommodate various sensors and actuators deployed on heterogeneous network architectures supporting, for instance, both the IEEE 802.11 (WiFi) and the IEEE 802.15.4 standards. To design and deploy from scratch a testbed that meets all these criteria is a challenging task that requires a significant amount of work, which greatly influences productivity and time-to-market. Indeed, the lack of open tools for creating local LPWN testbeds slows down the progress of CPS research and development. To address this challenge, we present a framework consisting of a set of tools for rapid deployment of a testbed for CPS applications. As shown in Fig. 1(b), the framework comprises of three main components:
• the server back-end, which stores information about
the status of the testbed, collects logging messages sent by the LPWN motes, and provides a web-based interface for remote testbed control;
• the backbone network, which connects the installed
LPWN with the user-interface, thus allowing the re-mote control and diagnostics of all the sensor re-motes;
• the testbed management unit, which provides tools
and mechanisms for deploying CPS applications, re-configuring firmware on the LPWN motes, and for monitoring the testbed’s performance.
We demonstrate the feasibility of the proposed framework in assisting the development of CPS applications. In particular, we study how well the WiFi-based backbone network can sus-tain testbed control and high-frequency sensor data collection. We evaluate the network throughput of the testbed’s LPWN by providing statistics on how frequently the sensors can be sampled to collect data over the IEEE 802.15.4 radio. Then, based on examples of sensor events detection in CPS appli-cations, we show tradeoffs between the size of the collected sensor data and the quality of information retrieved from that data. This step is critical to optimize the performance of the CPS application, e.g. in adaptive lighting regulated by traffic sensors - one of our case studies. We illustrate the properties of the framework with two examples of the testbed deployments. The first testbed is installed on the private outdoor parking lot of a commercial building to monitor the occupancy and traffic of cars in this space. The second testbed is deployed inside a university building to experiment with algorithms for people-occupancy estimation.
The proposed framework constitutes a new approach in assisting researchers and engineers with deploying testbeds, which are instrumental for the development of CPS applica-tions relying on wireless communication. It addresses several common challenges. First, it is easy to setup, thus allowing engineers from multiple disciplines to follow the best practices as they quickly deploy their own and local CPS testbeds. Second, the flexibility of the WiFi-based backbone network enables the fast testbed re-deployment and node-by-node plug-and-play testbed extension. Third, the relatively low hardware costs, $169 per node, allow researchers in academia and industry to start with a small investment in a few nodes and to quickly obtain a preliminary set of results before deciding to which extent one should augment the deployment.
The rest of the paper is organized as follows. Section II discusses related work. Section III describes the framework’s components, while Section IV presents the two case studies. Section V provides sample testbed statistical information for early stage CPS prototyping.
II. RELATEDWORK
Over the years two simulators have gained popularity in the LPWN research community: TOSSIM [16] and COOJA [21]. With TOSSIM, it is possible to simulate the execution of software applications written in the nesC language [9] running on a network of motes on top of the TinyOS operating system environment [17] and communicating through the IEEE 802.15.4 wireless standard. Once successfully tested, the same programs can be deployed on any hardware platform supported by TinyOS. With COOJA, it is possible to simulate a wireless network where each mote contains a complete firmware image built for TinyOS and programmed in nesC or built for the Contiki operating system [7] and programmed in C. Both of these simulators, however, offer limited support to test applications that extensively interact with the physical world through sensors and actuators. In fact, the development of CPS applications and the design of wireless infrastructure to support them cannot prescind from the use of testbeds.
Motelab was one of the first successful LPWN testbeds [29]. Through a web-based interface, an engineer could reserve the network for a few hours, upload a com-plete firmware image running on every mote, and collect logging messages, which were providing information about the
network performance. At first, the testbed setup at Harvard consisted of twenty-six Crossbow Mica2 nodes connected together through Ethernet and the Crossbow MIB600 backbone infrastructure that helped to manage firmware deployment and logs collection. Then, the testbed grew up to 190 Tmote Sky platform nodes, but it is not operating anymore.
Three other LPWN testbeds, which were deployed in a similar fashion as Motelab, are currently available for experi-ments through remote programming. Deployed at Ohio State University, Kansei consists of over 700 nodes [2]. Through its web-based interface, it allows engineers to run experi-ments on networks supporting various wireless communica-tion standards, e.g. 802.11, 802.15.4, and 900 MHz Chipcon CC1000 radios, as well as various types of motes, including XSM, TelosB [23], Imote2 and Stargates. Spanning across three floors of a building at TU Berlin, Twist is an indoor testbed that comprises of 204 TelosB motes connected through a network of USB cables to 46-single-board wall-powered NSLU2 computers [11]. It provides a web-based interface for programming and debugging the motes. Finally, Indriya is a testbed with 139 TelosB motes, deployed across three floors of the Computer Science building at the National University of Singapore [6]. With a backbone infrastructure consisting of 6 Mac Mini PCs and a network of USB hubs and cables, Indriya is geographically the largest LPWN testbed, covering an area equal to 23500m3.
The above testbeds enable engineers from all over the world to run embedded program prototypes on fairly large LPWNs. The significant number of nodes makes these testbeds particularly suitable to execute communication-oriented ex-periments, i.e. new network routing and MAC protocols are extensively evaluated on these testbeds to assess their robust-ness and scalability. CPS researchers and engineers, however, cannot completely evaluate their work on these testbeds be-cause CPS applications require continuous interaction with the physical world. Therefore, during the CPS instrumentation one must have access to the target environment of deployment as well as to the sensors and actuators. In particular, since a great part of this effort typically involves the positioning, configuring, and fine tuning of motes hosting various sensors and actuators, the direct access to a local testbed is critical. In the following section we present the framework that we built to assist engineers and researchers in the deployment of their own local testbeds supporting the development of CPS applications.
III. THEOPENTESTBEDFRAMEWORK
In this section we describe the components of the frame-work for deployment of CPS testbeds with heterogeneous wireless infrastructures. We briefly discuss how to set up each testbed component and point to online resources for more detailed documentation. All presented software is open-source and publicly available. Specifically, the source code of the presented tools is licensed under GNU General Public Licence, thus allowing everyone to freely use and modify the programs. Fig. 2 shows the complete architecture of a testbed that can be deployed and controlled with our framework. A collection of various LPWN motes, such as TelosB or Z1 motes, is controlled through a backbone network of WiFi routers from a server back-end. The server and the WiFi routers can be connected either through a private network or the Internet. The testbed management software running on the server provides a
USB Apache USB ETHERNET USB WIFI MESH
Fig. 2. General architecture of a testbed that can be deployed with the proposed framework.
user interface and a set of mechanisms to configure the testbed according to the characteristics of the particular applications. Each LPWN mote, which can host a particular set of sensors and actuators, is connected to a router through a USB cable. The application software and the operating system firmware running on the motes can be efficiently uploaded, tested, and configured through the backbone network.
The presence of the wireless backbone network is a dis-tinctive element of our approach that significantly increases design productivity. Once the development phase is completed and the specific CPS is ready to be released and produced, the backbone network can either be removed or scaled down as appropriate.
A. Server Back-End
The server is setup with the Ubuntu operating system. In our current deployment, we have configured it with the 32-bit Ubuntu Server 12.04 LTS, which is a long-term release with support guaranteed by Canonical Ltd. for five years, starting from April 2012. The back-end includes also a database server (MySQL, version 5.5.24) and a web server (Apache, version 2.2.22). The database server stores information about the testbed configuration and debugging messages collected from the LPWN motes. Depending on the size of the data and the data processing algorithms, the sensor measurements are either saved in the same MySQL database, in a local file on the server, or are sent to Hadoop for distributed processing.
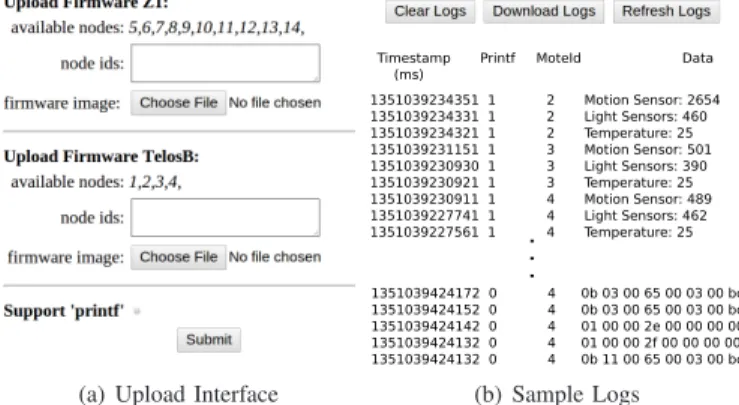
Fig. 3 shows two screen-shots of the web-interface running on the server. Fig. 3(a) shows the firmware uploading interface. From the list of available nodes, the user can specify the IDs of those nodes that should be reprogrammed. In the
firmware image field, the user can choose the location on a computer where a new firmware for a given mote architecture is be stored. Before starting the experiment, the user tells the framework the format in which the logging statements are sent from the program under design. A log message can be either a plain text statement or a byte-encoded report. After reconfiguring the testbed and starting an experiment with the new firmware, the user-interface switches to reporting online logging messages, as shown in Fig. 3(b). The figure shows two different experiment runs: one set of logs is sent in form of plain ASCII text messages and the other is encoded as a sequence of bytes. Each log statement starts with a timestamp that is marked by a WiFi router when it receives a log message from the corresponding mote attached through the USB connection. A copy of the logs can be downloaded from the server into a local computer.
(a) Upload Interface
1351039234351 1 2 Motion Sensor: 2654 1351039234331 1 2 Light Sensors: 460 1351039234321 1 2 Temperature: 25 1351039231151 1 3 Motion Sensor: 501 1351039230930 1 3 Light Sensors: 390 1351039230921 1 3 Temperature: 25 1351039230911 1 4 Motion Sensor: 489 1351039227741 1 4 Light Sensors: 462 1351039227561 1 4 Temperature: 25
Timestamp Printf MoteId Data (ms) 1351039424172 0 4 0b 03 00 65 00 03 00 bc 1351039424152 0 4 0b 03 00 65 00 03 00 bc 1351039424142 0 4 01 00 00 2e 00 00 00 00 1351039424132 0 4 01 00 00 2f 00 00 00 00 1351039424132 0 4 0b 11 00 65 00 03 00 bc . . . (b) Sample Logs
Fig. 3. Screen-shots of the framework’s user interface for new firmware installation and downloading logs.
A complete server configuration, including the operating system, database, and web-interface, can be downloaded as a virtual machine image.The virtual machine format allows us to deploy the server image on most computers and cloud systems. For example, the server can be easily started through VMware Player or VMware Workstation 9.0 on a Windows or Linux PC, or through Fusion 5.0 on a OS X computer. Alternatively, it can be started as a virtual server on an ESX Server cloud infrastructure. Once the server is running, it can be accessed through its IP address. Hence, by simply typing the server’s IP address in the URL field of a web-browser, the user can see the welcome page of the framework.
B. Backbone Network
The testbed backbone network connects together the server and all the WiFi routers. The routers can be attached to a wired network or form a wireless mesh network with other routers. Furthermore, the backbone network can be setup as a combination of both.
When the routers are connected to the wired network, the server communicates directly with each router through its assigned IP address. When routers together create the ad-hoc WiFi mesh network, the server reaches a particular router through a multi-hop path across other routers and a gateway router: in this case, at least one router is attached to either a private network or the Internet. Hence, at a minimum, the backbone network requires only one router to be connected to the server back-end. Since the backbone network serves as the ad-hoc mesh network, the testbed can be efficiently re-deployed in various places and new routers can be seamlessly merged with other routers’ network. The routers, however, need to be connected to a power source. Nevertheless, the testbed is simpler and faster to deploy than most existing LPWN testbeds because the routers do not require any form of additional wired connection.
The WiFi routers are running the OpenWrt Linux-based operating system. The OpenWrt project1 provides tools to build complete firmware images for various WiFi routers and for multiple embedded hardware architectures. The project combines a Linux kernel with a set of tools that are commonly used in wireless networking. In particular, the framework is setup with the Optimized Link State Routing (OLSR) protocol to organize the ad-hoc mesh network among the WiFi routers. Each router is time-synchronized through the Network Time Protocol.
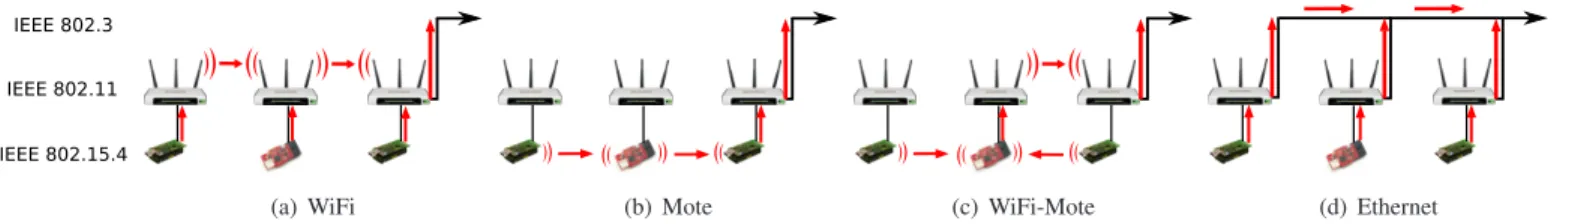
IEEE 802.15.4 IEEE 802.11
IEEE 802.3
(a) WiFi (b) Mote (c) WiFi-Mote (d) Ethernet
Fig. 4. The sensor data collection experiment configurations on the framework built with heterogeneous network standards.
Support for Heterogeneous Network Architectures.The existing testbed architectures preclude experimenting with various wireless networks because they are solely based on a wired backbone. While the WiFi routers provide wireless communication according to the IEEE 802.11 standard, motes such as TelosB and Z1 offer wireless communication based on the IEEE 802.15.4 standard. With such communication heterogeneity, an engineer can test a program in a network solely operating within the IEEE 802.11 domain, utilizing only the IEEE 802.15.4 communication, or with combination of the two protocols. Thus, our proposed WiFi-based backbone network architecture allows us to evaluate embedded software in multiple configurations of wireless network standards.
Fig. 4 shows four configurations of wireless networks supported by the framework. Fig. 4(a) shows a configuration where all sensor data are sent from each mote through USB directly to the attached WiFi router, and then the data are routed to the server through WiFi mesh network. Fig. 4(b) shows a configuration of the testbed with one mote collecting sensor data from other motes and sending the collected data to the attached WiFi routers that forward the data to the server. Fig. 4(c) show one of the possible combinations of the testbed configurations, where multiple motes collect sensor data from other motes. The collected data are sent to the attached WiFi router and further to the server through the WiFi mesh network. By attaching each router directly to Ethernet, as shown in Fig. 4(d), the testbed operates in the same fashion as existing wired-based testbeds. As we will show in Section V, for CPS development a testbed operating only on the wireless backbone is as good as the testbed relying on the wired backbone.
The network architecture configuration for a given ex-periment depends on the application scenario. For example, consider the task of collecting sensor measurements for a CPS application. An engineer might be required to test an embedded program for various sensors, some connected through wires and others employing wireless communication (IEEE 802.11 or IEEE 802.15.4). As shown in Fig. 4(a), to experiment with CPS sending sensor measurements through WiFi network only, the testbed needs to be configured with every mote sending data over the USB connection to the attached router. For many CPS applications, however, engineers do not have the luxury of deploying a wired network for sensor-data collection. In some applications, even WiFi is only allowed for testing and debugging, but not in the final version of the system deployment. Hence, it is important to evaluate a CPS prototype within the restricted domain of LPWN, as shown in Fig. 4(b). During the CPS design time, an embedded software en-gineer is responsible for building a firmware consisting of a sensor data collection application supported by a multi-hop ad-hoc network routing among the motes. The sensor measurements are routed to a collector using network protocol
such as the Collection Tree Protocol (CTP) [10], which runs on top of the IEEE 802.15.4 MAC protocol. The collector further forwards the sensor data to a database or a program parsing sensor data logs. In some applications, however, where the number of sensor motes is large, the LPWN itself may not sustain the whole network traffic (see CTP study in Section V). Then, one may want to consider a CPS implementation with a two-tier network. At the lower-tier, the ad-hoc mesh network is setup among one or more collectors. At the higher-tier, the collectors are connected together through a network consisting of the WiFi routers, as shown in Fig. 4(c).
Deployment Flexibility.The flexible framework architec-ture allows us to adjust the placement of the LPWN motes dur-ing the CPS design and prototype evaluation phase. Once the target application is defined, it is necessary to establish where and how many sensors and actuators should be installed. At the beginning, the blue-print of a new cyber architecture is guided by intuition and experience. Later on, through the iterations of experiments on the CPS deployment on an actual testbed, the cyber architecture becomes more precisely characterized until the number and position of the motes with the specific sensor and actuators is completely determined. During these adjustments, the flexible testbed architecture enables engineers to reorganize the placement of the nodes and to attach more nodes where needed.
The proposed framework simplifies the task of finding critical parameters of the system under design. For instance, the design of a new CPS application requires to specify how often a sensor should sample a given physical entity. This question is usually difficult to answer. On the one hand, higher frequency sampling rates provide more data about the surrounding environment. On the other hand, low-power embedded wireless devices have limited bandwidth and are constrained by power resources that are mostly consumed by collecting sensors’ measurements and transmitting data over the radio. Therefore, each CPS deployment must find the right balance for the particular system implementation. One needs to find the minimum sampling frequency that guarantees correct interaction with the physical world and the maximum sampling frequency that the cyber infrastructure can maintain (Section V). The heterogeneous testbed architecture that we propose helps define the CPS sampling parameters. A CPS architect can first rely only on the WiFi network collecting sensor samples at a higher rate than the LPWN can sustain. Then, by studying the collected sensor samples, the lower sampling frequencies can be identified together with the values of the system parameters impacting its responsiveness, correctness, and lifetime. Once the new sampling frequency parameters are determined, the CPS application software can be migrated into the motes architecture and validated using the same testbed deployment.
C. Testbed Management Unit
Our framework provides a set of tools connecting together the third-party software running on the WiFi routers and the back-end server. Software programs running on each router manage the interaction between the motes and the back-end server. When a new mote firmware image is being uploaded from the server, each router flushes the firmware into the mote’s program Flash memory and reports back to the server the status of the mote. The router receives logs messages from the program executing on the mote and stores them locally in its own memory before they are downloaded into the server. The tools operating on the WiFi routers are compatible with the Open PacKaGe Management (opkg), a lightweight pack-age manpack-agement system for embedded Linux devices. This software-distribution format permits installation and system updating over the Internet without interrupting the testbed services.
The framework tools running on the server offer a web-based user interface to communicate with the routers. Partic-ularly, this interface comprises of two programs. When a user uploads a new firmware through the web-interface, the first program checks the correctness of the user’s input, verifies network connectivity with the WiFi routers, and initiates a secure SSH-encrypted connection with each router. The secure connection with the WiFi routers increases the safety of the intellectual property of the software and the privacy of the data containing sensor measurements and actuator control signals. While an experiment is running, the second program periodically checks the status of the testbed and informs the user when a misbehavior is observed. Every minute, the testbed server securely downloads the log messages from the motes which have been buffered on each router. The logs are stored in the database server and the latest log update is continuously displayed on the user interface. The source code of the testbed OpenWrt packages and the source code of the set of the tools running on the server are available online2.
IV. TESTBEDDEPLOYMENTEXAMPLES
In this section we present two case studies of actual deployments made by using the proposed framework: the first example is an outdoor testbed deployment in a commercial environment while the second example is an indoor testbed deployment in a university building.
A. Outdoor Parking Lot Testbed
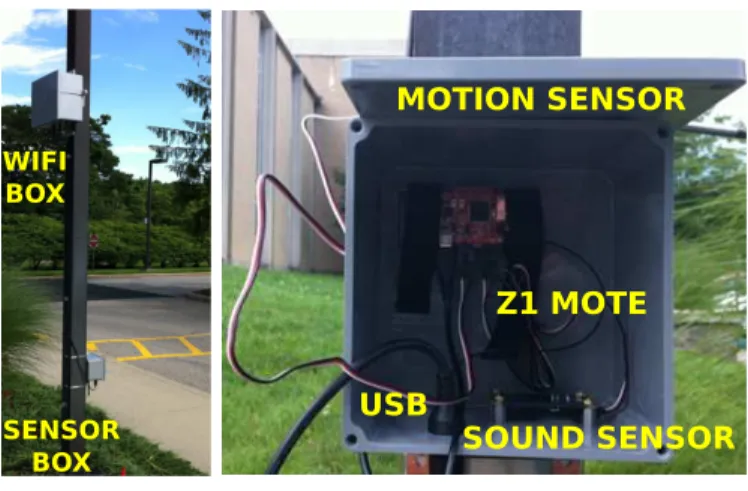
We deployed an outdoor testbed in the parking lot at Philips Research North America in Briarcliff Manor, New York. Cur-rently, fourteen light poles, spanning an area of 80x100 meters, are instrumented with the testbed hardware. The testbed is used to evaluate prototypes of Intelligent Outdoor Lighting Control applications. These applications focus on detecting traffic (e.g., vehicles and pedestrians) and actuating on the system composed of the outdoor lighting network to improve energy efficiency and to meet safety and user requirements. For instance, our application allows autonomous light-dimming based on the presence of people or on the movement of cars. Hardware Infrastructure. Fig. 5(a) shows the mounting of the the testbed hardware on one of the light poles. Each pole comprises of one WiFi box and one sensor box. Each WiFi box contains a TP-LINK 1043ND WiFi router with a
2Project Repository: https://github.com/mszczodrak/otf
SENSOR BOX WIFI BOX
(a) Light Pole
Z1 MOTE
SOUND SENSOR USB
MOTION SENSOR
(b) Inside Sensor Box Fig. 5. Testbed deployment on a parking lot.
400MHz microcontroller and 8MB of Flash and 32MB of RAM memories. The router is secured inside a plastic box. To maintain strong WiFi signal reception, all three router’s antennas are extended outside of the box. To create the USB connection with motes, the router’s USB port is extended outside of the box. In total, three industrial USB cables are used in order to decouple the WiFi box from the sensor box, for installation and maintenance purposes. Each WiFi box draws AC power from the light pole.
Fig. 5(b) shows an opened sensor box. The box contains a Zolertia Z1 [30] mote, connected to different sensors depend-ing on the particular application. For example, in this figure the Z1 mote is connected to a sound sensor mounted at the bottom of the box and to a motion sensor monitoring the street through a secured hole in the front cover of the box. The sensor box has attached a USB cable that is connected to the Z1 mote and with the WiFi box. Each sensor box is powered through USB.
The WiFi box and the sensor box are assembled out of com-mercial off-the-shelf components. Each box is professionally assembled and tightly sealed to protect the electronic devices from water damage. The WiFi boxes are framed with metal blades, allowing us to screw each box into a light pole. The sensor boxes have metal stripes for an installation on various poles. The testbed has been running for over a year and it has survived diverse extreme weather conditions.
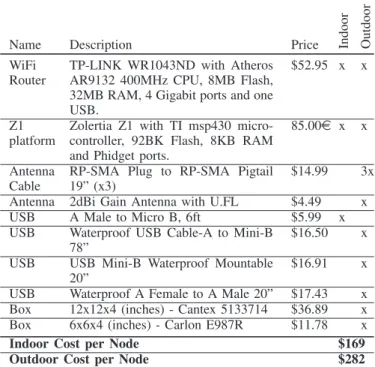
Table I lists the testbed hardware and its cost3 per node
deployed outdoor. Each testbed node is assembled with three units of antenna extension cables and one unit of the rest of the items listed in the table. The total cost of a single node deployed outdoor is approximately $282, with $113 spent to secure the electronic hardware equipment. However, the actual total cost of a single light pole instrumentation is higher due to the labor of the technicians preparing the boxes and soldering the external antenna, and the electricians mounting the boxes and connecting them to the power source out of each light pole. Despite that, the costs of our testbed quickly pay back in terms of increased productivity.
Software Infrastructure. The testbed server is deployed on a private cloud infrastructure. The OpenWrt embedded Linux operating system is installed on all the WiFi routers. In particular, the routers are operating on the OpenWrt Back-fire 10.03.1 stable release with Linux kernel 2.6.32. When
Name Description Price Ind o o r O u td o o r WiFi Router
TP-LINK WR1043ND with Atheros AR9132 400MHz CPU, 8MB Flash, 32MB RAM, 4 Gigabit ports and one USB.
$52.95 x x
Z1 platform
Zolertia Z1 with TI msp430 micro-controller, 92BK Flash, 8KB RAM and Phidget ports.
85.00e x x
Antenna Cable
RP-SMA Plug to RP-SMA Pigtail 19” (x3)
$14.99 3x
Antenna 2dBi Gain Antenna with U.FL $4.49 x
USB A Male to Micro B, 6ft $5.99 x
USB Waterproof USB Cable-A to Mini-B 78”
$16.50 x
USB USB Mini-B Waterproof Mountable 20”
$16.91 x
USB Waterproof A Female to A Male 20” $17.43 x Box 12x12x4 (inches) - Cantex 5133714 $36.89 x
Box 6x6x4 (inches) - Carlon E987R $11.78 x
Indoor Cost per Node $169
Outdoor Cost per Node $282
TABLE I. OUTDOOR AND INDOOR TESTBED HARDWARE AND COST. powered-on, the routers automatically configure the ad-hoc mesh network through the OLSR protocol. One router is placed inside a building and serves as the gateway to other routers mounted on the light poles.
Research and Development Practice. The presented framework enables us to prototype embedded software running on the LPWN and to enhance lighting control performance by testing various system configurations. The framework offers three key advantages. First, the WiFi-based flexible backbone network architecture represents the least invasive testbed de-ployment approach for a commercial outdoor environment. Whereas any wire-based approach would require laying down wires across the street and parking lot, the wireless solution only needs a connection to a power-source which in most industrial environments can be found in proximity. In the deployments of the outdoor CPS applications, the light-pole is a good infrastructure to connect to a power source. Second, thanks to our framework we can remotely update the firmware of all fourteen Z1 motes within less than thirty seconds. Without the framework, updating firmware of just one mote would take over ten minutes because it would be necessary to go to the field, open the enclosure, and connect it to the development computer. Third, the online logs that are gathered from the firmware running on the Z1 motes, enable continuous debugging of the sensing firmware while collecting actual sensor measurements, and provide quick feedback about the system performance.
B. Indoor Office Testbed
We deployed an indoor testbed at the Computer Science Department of Columbia University. The testbed spans an area of 10x18 meters, placed across labs and offices of one floor.
Hardware Infrastructure. We use two models of the WiFi routers: TP-LINK WR1043ND and TP-LINK TL-WDR4300. Out of 16 routers, 2 are mounted far from any power source and, therefore, are powered through Power-over-Ethernet (PoE), following the IEEE 802.3af standard. During
POWER SUPPLY USB TP-LINK 1043ND WIRELESS ROUTER ZOLERTIA Z1 PHIDGET PIR SENSOR PHIDGET SOUND SENSOR
Fig. 6. An indoor testbed node assembled with the TP-Link 1043ND WiFi router, Zolertia Z1 mote, and two Phidget sensors.
the experiments these routers are not using Ethernet, so the WiFi mesh network is supported with only one gateway node. One of the routers is connected to two motes. The routers are installed with the OpenWrt Attitude Adjustment 12.09 stable release with Linux kernel 3.3.8. The routers are connected to 17 motes: 4 are TelosB and 13 are Zolertia Z1.
The testbed server was first deployed as a virtual machine running on a laptop computer and then migrated to the department IT cloud, where it has assigned a unique IP address and DNS record: this allows us to connect to the server through its own URL address. The virtual machine is configured with a single-core 1GHz processor and 1GB of RAM.
All seventeen motes create a LPWN collecting sensor mea-surements, which are then stored in a database and processed as part of CPS applications for smart-buildings, such as room-environment monitoring and people-occupancy estimation. The TelosB motes gather information on temperature, humidity, and light through a set of integrated sensors. The Z1 motes are factory-assembled with a 3-axis digital accelerometer and a low-power digital temperature sensor. In addition to these sensors, each Z1 mote is connected to two Phidget sensors, which can provide the following sensing capabilities depending on the given application: touch, distance, infrared reflective, sound, vibration, passive infrared motion, magnetic, thin force, and precision light.
Fig. 6 shows one of the deployed testbed nodes: the TP-LINK 1043ND WiFi router is connected to the power source and to the Z1 mote through a USB cable. The Z1 mote is connected to two sensors, PIR (motion detection), through the available Phidget ports. Combined, the assembly of one testbed node and the uploading of the OpenWrt firmware takes approximately five minutes. As part of the node-installation process, each mote’s corresponding router is connected to a power source and the sensors’ placement and orientation are adjusted. When a node is turned on, it automatically becomes part of the testbed network. The wireless backbone network and the firmware-upgrade capabilities allow users to remotely control the testbed without interrupting the work of people who are present in the area of deployment.
The hardware and its costs per single testbed node de-ployed indoor are reported in Table I. The complete testbed-installation cost depends on the number of nodes and the price
for deploying the testbed’s virtual server. A single node, as the one shown in Fig. 6, costs $249 ($169 without the sensors). Depending on their quality, sensors and actuators cost in a range of $0.99-$45.00 per item.
Software Infrastructure.The motes run applications that are developed using the Swift Fox programming language on top of the Fennec Fox framework [27] and TinyOS [17]. Combined, these provide the necessary software support for configuring the LPWN multi-hop message routing and for designing applications interacting with sensors and actuators.
Research and Development Practice.The indoor testbed is used for research and development of smart-building ap-plications and for educational purposes to allow students to acquire hands-on experience with these hardware and soft-ware. The deployed sensor network is currently collecting sensor measurements for occupancy-estimation applications in commercial buildings. Our framework effectively supports CPS research by providing the following advantages. First, the remote firmware reconfiguration enables us to install various embedded programs without interrupting the work of people occupying the space under monitoring. Second, because WiFi routers require only a single wire, either a power-cable or PoE, testbed installation becomes more flexible. Wiring additional cables would increase deployment cost and might depend on obtaining permits, which would delay the testbed deployment. Third, the flexible testbed infrastructure makes it possible to quickly move sensors around the building as we look for the most appropriate places for gathering sensor measurements and for monitoring the areas of the highest interest. This is particularly important in establishing ground truths for the development of event-detection algorithms.
The heterogeneous wireless backbone network allows us to proceed with the CPS deployment in two steps. In the first step, the firmware running on the motes sends data over the USB to the attached router which forwards messages over the WiFi to the testbed’s server. The high bandwidth of the WiFi routers enables us not only to collect enough data to establish ground truths but also to determine the key parameters that influence the results of the interaction with the physical world. After studying the environment, in the second step, we ran the same embedded program as in the first step, but this time we used LPWN’s multi-hop communication, instead of sending messages over the USB and WiFi routers. Recompiling the firmware to use LPWN instead of the USB connection and installing it across all the LPWN motes takes less than a minute. Setting the communication type parameter (USB or wireless) and tuning the system performance parameters is as simple as changing their corresponding values in the Swift Fox [27] program that configures the embedded firmware.
V. TESTBEDEVALUATION
In this section we present an evaluation of the two testbed deployments introduced in Section IV, and on these examples we show how to implement a testbed for CPS prototyping. First, we show how much sensor data can be collected by a single mote. Then, we present the exemplary performance of the WiFi mesh network throughput measured while routing the sensors’ data in indoor and outdoor deployments. These experiments confirm that the WiFi-based testbed’s backbone network is sufficient to collect sensors’ samples. After studying WiFi throughput, we show measurements of the LPWN net-work throughput. These experiments indicate the data rates that
can be sustained by IEEE 802.11 and IEEE 802.15.4 standards. Finally, we present examples of CPS instrumentation that finds the sensor sampling frequency necessary to detect an event. Based on motion and distance sensor data traces, we provide empirical results on how frequently these sensors need to gather samples to support applications such as occupancy estimation and parking movement detection.
Maximum Sensor Sampling Frequency. We start the evaluation by asking how the framework helps us better un-derstand the environment which the CPS application interacts with. This problem comes from the questions that often arise at the beginning of many CPS developments: how the events of interest look like, how much data is necessary to detect an event, what is the sensor frequency sampling, and how often the sensor samples should be collected. To answer these questions, CPS engineers start with collecting as much data as possible. Therefore, it is crucial to estimate how much sensor data a single mote can generate.
The maximum rate at which a mote can collect the sensor samples is limited by the mote’s architecture, i.e. the maximum throughput of the USB connection between a mote and a WiFi router. During the first test, we sent 8000-bytes of application data payload per second (62.5Kbps) over UART. This is equivalent to a CPS application collecting 2-byte samples from 4 sensors every 1ms. First, we established the limitations of two sensor platforms. The Z1 platform, operating on 16MHz, can send 80-bytes of sensor measurements every 10ms. The TelosB platform, operating on 8MHz, can send 96-bytes of sensor measurements every 12ms (the larger data size amortizes the serial packet header’s overhead). Next, we measured the actual speed at which sensor samples can be collected. Using the faster Z1 platform, we observed a delay of 18-20ms in receiving the measurements from the Phidget motion and Phidget distance sensors attached to the mote through ADC; this is analogous to an application sending data at the rate of 1.735Kbps. We conclude that in those testbed configurations where every mote sends data over USB to the attached router, as shown in Fig. 4(d), the bandwidth requirements for data collection are orders of magnitude lower than the Ethernet bandwidth. Therefore, the testbeds relying on the wired backbone network infrastructure do not utilize the Ethernet bandwidth resources. Next, we verify that the backbone network consisting of wireless infrastructure can also sustain the data flow generated by all motes transmitting over UART at the maximum rate.
One of the concerns of the framework is how well the backbone network operating on IEEE 802.11 ad-hoc mode can collect data from all sensor motes reporting simultaneously, especially in an indoor deployment where other WiFi networks are present. We tested the throughput of the WiFi mesh by downloading 1GB file from a server located right next to the network’s gateway. On a single WiFi router, we observed download rates oscillating between 21.12Mbps and 20.73Mbps for indoor and outdoor deployments, respectively. When all routers were downloading at the same time, depending on each router’s distance from the gateway, download rates ranged from 0.99Mbps to 2.17Mbps for the indoor deployment, and from 1.1Mbps to 4.451Mbps for the outdoor deployment.
During the experiments with all the routers downloading simultaneously, we observed one of the indoor deployed WiFi routers sporadically stalling downloads, whereas in the outdoor
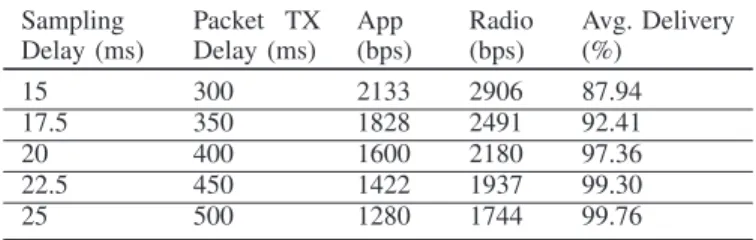
Sampling Delay (ms) Packet TX Delay (ms) App (bps) Radio (bps) Avg. Delivery (%) 15 300 2133 2906 87.94 17.5 350 1828 2491 92.41 20 400 1600 2180 97.36 22.5 450 1422 1937 99.30 25 500 1280 1744 99.76
TABLE II. AVERAGE DELIVERY OF PACKETS AT THE SINK NODE. deployment 2 to 4 routers were always pausing downloading for few seconds. The network throughput variation on each router resulted from the dynamics in the network routing topology computed by the OLSR. In the indoor deployment, the routes were more stable, and only one out of 16 routers was more than one hop away from the gateway. Instead, in the outdoor deployment, 5 out of 14 routers were two hops away from the gateway. Despite the variations in the WiFi ad-hoc network routing topology, in both testbed deployments we observed that the wireless communication bandwidth was orders of magnitude larger than the limits at which motes collect sensors’ samples. The size of the presented testbeds does not allow us to evaluate the WiFi mesh network scalability of collecting the sensor data through a single gateway or to exactly estimate when more routers need to be connected to Ethernet to serve as gateways. We can confirm, however, that the presented examples of the network backbone resources are sufficient to collect sensor data. We conducted a 3-hour experiment with all motes sending data over USB at the max-imum rate (62.5Kbps). During the experiment, all messages were successfully transmitted to the testbed server. Then, for over a year, both testbeds have been successfully collecting sensor data sampled at the rate of 10Hz.
These presented experiments show that the framework can support sensor sampling at the maximum rate at which the existing mote architecture can generate measurements, while relying solely on the WiFi-based backbone network, as shown in Fig. 4(a). While high-frequency sensor sampling is helpful in understanding the testbed’s surrounding environment, it is not practical for many CPS production deployments, which require both the IEEE 802.11 and the IEEE 802.15.4 wireless communication standard. Moreover, in many CPS deployments designers do not have the luxury of using WiFi at the final product version, i.e. WiFi installation may be too expensive or impractical to deploy due to power constraints.
Collecting Data Through LPWN.We continued the expe-riments and studied when CPS can collect sensor data through the LPWN infrastructure itself, as shown in Fig. 4(b), instead of using the WiFi network. We compiled a firmware for Z1 and TelosB motes with an application simulating the collection of 2-byte sensor measurements from 2 sensors of each mote. Once 80-bytes of sensor samples are collected, the application running on each mote sends over the network a packet with the sensors’ measurements to one mote designated as the data sink. The sink mote operates as the LPWN’s gateway to the WiFi network. The sensor data is routed by the Collection Tree Protocol (CTP) [10], running over the CSMA MAC protocol and radio following the IEEE 802.15.4 standard.
Table II reports the results of the experiments with 17 sensor motes collecting measurements through LPWN at one sink mote. Starting from the leftmost column the table reports: the rate at which each of the 2 sensors sampled measurements,
the rate at which packets with 80-bytes of sensor data payload were sent over the network, the bandwidth generated by the application’s data, and the bandwidth at which the radio sent packets - this includes sensor data payload together with the application, network protocol, and MAC protocol headers: a total of 109-bytes. The rightmost column of the table reports the network average delivery defined as a percentage of packets that were received at the sink mote. Each line of the table contains the average result of a separate one hour experiment. We compared the results of the data collection experiments with the results reported in literature. CTP operating on CSMA MAC delivers 94.7-99.9% of the packages, depending on the testbed deployment [10]. In our experiments, we achieved above 97% of delivery when each of the 17 motes sent 109-byte long packets not faster than every 400ms. When the packet transmission delay increased, the average network delivery increased as well up to 99.75% for packets sent every 500ms. Next, we analyzed the network data throughput. For an application sampling sensors at the rate of 20, 22.5 and 25ms, the network sent data at the rate of 36.1, 32.1 and 28.9Kbps, with the delivery rate of 97.36, 99.30 and 99.76%, respectively. As a reference, the theoretical upper bound of the single-hop throughput for IEEE 802.15.4 is 225Kbps [20] (the standard defines bandwidth of 250Kbps). This physical limit is further impacted by the CSMA MAC protocol with unslotted random-access to the channel [1]. Further, the throughput decreases due to the overhead of the network and MAC protocols (peri-odic beacons, message acknowledgements, packet transmission back-off delays), motes’ hardware limitations [20] and the dynamics in the wireless channel with links between the motes being bursty (shifting between good and poor quality) [3], [25]. We presented the application data collection and network throughput statistics showing how much sensor data can be collected through 17-mote LPWN, deployed within the framework in an indoor environment. These results provide a reference point for a user deploying the framework and collecting sensor data through the motes’ wireless network instead of WiFi. While these results are sensor data agnostic, in the following examples we show traces of physical world measurements together with an analysis of how much sensor data is needed to detect physical events of interest.
Sensing for Event Detection. In the last set of the experiments we show examples of using the framework to understand how much sensor data has to be gathered to detect an event. Some events, such as change in temperature, do not require frequent sensor sampling. Thus collecting sensor measurements every one, three or even fifteen minutes is suffi-cient to detect such events. For other events, however, such as motion detection or occupancy estimation, the adequate sensor sampling frequency is not that straightforward to estimate. Next, we show tradeoffs between the number of taken sensor samples and the accuracy of the detected events.
On all the motes we deployed a firmware with an applica-tion detecting if a person walked through a doorway. In related work, motion and door sensors were used to detect occupancy in a home [19]. In another work, multiple distance sensors were used to track people walking between the rooms of a house [12]. In our indoor deployment we used two Phidget sensors attached to Zolertia Z1 motes: motion sensor and distance sensor, operating on 5V and 3V, respectively, and mounted on top of the door and facing downward.
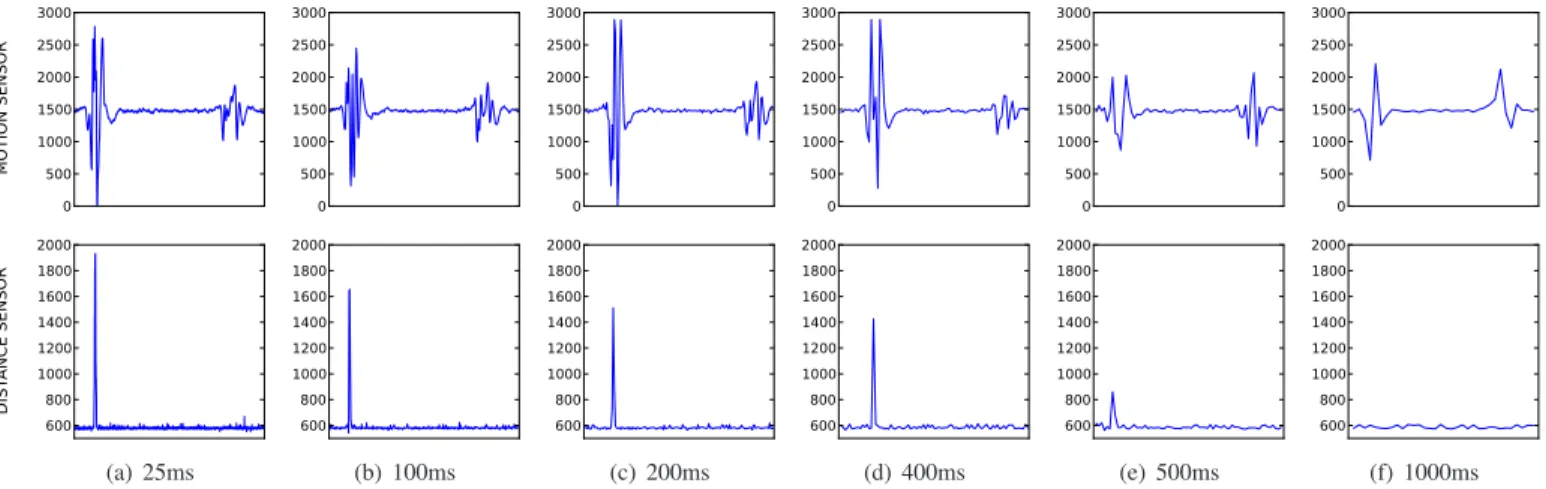
MOTION SENSOR DIST ANCE SE NSOR 0 500 1000 1500 2000 2500 3000 600 800 1000 1200 1400 1600 1800 2000 (a) 25ms 0 500 1000 1500 2000 2500 3000 600 800 1000 1200 1400 1600 1800 2000 (b) 100ms 0 500 1000 1500 2000 2500 3000 600 800 1000 1200 1400 1600 1800 2000 (c) 200ms 0 500 1000 1500 2000 2500 3000 600 800 1000 1200 1400 1600 1800 2000 (d) 400ms 0 500 1000 1500 2000 2500 3000 600 800 1000 1200 1400 1600 1800 2000 (e) 500ms 0 500 1000 1500 2000 2500 3000 600 800 1000 1200 1400 1600 1800 2000 (f) 1000ms Fig. 7. Motion and distance measurements from sensors detecting people walking through a doorway, for various sampling frequencies. In each experiment a person first walks through a doorway and then walks along the hallway next to the door. The motion sensor detects both events, while the distance sensor only detects a person walking through a doorway.
MOTION SENSOR 0 2000 4000 6000 8000 10000 Time (ms) 0 500 1000 1500 2000 2500 3000
(a) Office Doorway
0 2000 4000 6000 8000 10000 Time (ms) 0 500 1000 1500 2000 2500 3000 (b) Parking (person 6ft) 0 2000 4000 6000 8000 10000 Time (ms) 0 500 1000 1500 2000 2500 3000 (c) Parking (person 12ft) 0 2000 4000 6000 8000 10000 Time (ms) 0 500 1000 1500 2000 2500 3000 (d) Parking (car)
Fig. 8. Motion sensor measurements samples every 200ms in indoor and outdoor deployments. The traces show sensor measurements when a person walks at a various distances from the sensor and when a car drives in front of the sensor.
The goal of these experiments was to determine the fre-quency at which the two sensors should collect samples. In a work focusing on detecting the height of a person walking through a door, Hnat et al. observed that a head moving at a speed of 3 meters per second passes the sensing region of the distance sensor in about 100ms [12]. In our experiments, we started with sampling every 25ms because that is the highest rate at which 99.76% of packets are successfully delivered, as reported in Table II. Then, we continued the experiments with longer sampling delays, studying the trade offs between the number of collected sensor data samples and the quality of the data for the event detection based on the visual observation. Fig. 7 shows sample results from six experiments with the motion and distance sensors detecting if a person walked through a door. For each experiment, the sensors’ sampling frequency varies from 25ms up to 1000ms. During each experiment a person walked through a door and then, after a short delay, another person passed by the door. As shown on the upper graphs of the figure, the motion sensor detected people walking both through the door and by the door. For sampling rates of 25, 100, 200, and 400ms, the observed events could be positively classified between the two cases. When the motion sensor took samples every 500ms or longer, the measurements were not sufficient to distinguish if a person walked through the doorway or not.
The lower graphs of the Fig. 7 show the measurements from the distance sensor. The distance sensor only detected people walking through the doorway, not people walking on the hallway. As the sampling frequency decreased, the amplitude value of the distance sensor raw measurement
decreased as well, from 1973 to 1414 for 25 and 400ms delays, respectively. When sampling at the rate of 500ms or more, the distance measurements either did not indicate a walk through the doorway or, as shown in the figure, the sensing value was very low, often not distinguishable from the noise.
The indoor deployment case-study highlights the need for minimizing the impact of false-negative and false-positive events in CPS. In designing CPS, it is thus necessary to find the sampling rate that will lower the chance of miss-recognizing events. In some applications, like occupancy-estimation, it is crucial to use multiple sensor modalities to cross-validate the occurrence of events.
Understanding the Physical Phenomena. In the last experiment, we compare the motion sensor measurements from the indoor testbed deployment with the motion sensor measurements from the outdoor testbed deployment.
Fig. 8 shows traces sampled every 200ms for the same Phidget motion sensor (operating on 3V) detecting four events in the indoor and outdoor testbed deployments. Each chart shows 50 motion sensor measurements collected for a period of 10 seconds and with each single measurement marked as a dot. Fig. 8(a) shows a trace of measurements from the motion sensor mounted on top of the door and recording when a person walked through the doorway. The remaining charts show traces of measurements gathered by the motion sensor installed 3 feet from the ground, on the parking’s light pole. Fig. 8(b) and Fig. 8(c) show traces of measurements collected when a person walked in front of the sensor at the distance of 6 feet and 12 feet, respectively. Fig. 8(d) shows a trace of measurements taken when a car was passing in front of the motion sensor.
As shown in Fig. 8, the values of the motion sensor measurements depend on the distance between the sensor and an object of interest, the speed at which the object moves, and the context of deployment. In the first three charts, we notice that people who walked in front of the motion sensor at a further distance spent more time in the sensing area, which resulted in longer event measurements with higher amplitudes. The last three charts compare different speeds at which objects moved in front of the sensor, indicating shorter event time and lower amplitude values for the car’s motion detection than for peoples’ motion detection, because cars move faster and consequently spend less time in front of the sensor. Finally, we compare the first chart from Fig. 8(a) with the last one from Fig. 8(d). The charts show similar measurements with events occurring for a similar period of time (approximately 3 seconds) in two different scenarios: a person walking through the doorway and a car driving on the parking lot.
The outdoor deployment case-study makes evident how critical the understanding of the context of the sensor deploy-ment is to successfully detect and classify the event. Informa-tion such as the sensor’s posiInforma-tion, orientaInforma-tion and distance from objects of interest as well as the physical models of events need to be combined with the sensor’s data. The meta-data describing the context of the deployment is as essential as the sensors’ measurements themselves.
In conclusion, the experimental results presented in Fig. 7 and Fig. 8 confirm the importance of deploying CPS testbeds to understand the physical environment together with the behav-ior of the events of interest. Depending on the CPS application, the placement of sensors and their sampling frequency, the traces of events of interest have different characteristics and need to be studied at the beginning of the CPS development. High-frequency sensor sampling and measurement data collec-tion are crucial not only for understanding the environment in which CPS is deployed but also for quantifying the quality of information retrieved from the sensors. Our tests show that early stage CPS prototyping and deployment is necessary to understand both the information impacting the control of CPS and the cyber technology tradeoffs, which influence the cost and the quality of CPS products. Therefore, the local testbed deployment process boosts both research and business in developing CPS applications.
VI. CONCLUSION
We presented a new framework to assist engineers and researchers in the efficient deployment of heterogeneous wire-less testbeds for CPS applications. Our framework addresses prevalent issues in multi-disciplinary CPS projects which rely on the actual deployment of control systems utilizing sensor and actuator peripherals connected together in a network of low-power wireless embedded devices. It provides software tools that simplify the setup of flexible testbed architectures for relatively low hardware costs. We presented the functionality of the framework on testbed deployments in outdoor and indoor environments, in industry and academia, respectively. The tools are shared through an open source project, thus allowing the research community to use the framework and encouraging contributions to its further development.
Acknowledgements: This project is partially supported by the
National Science Foundation under Awards #644202 and #931870 and by an ONR Young Investigator Award. We thank Dhananjay Palshikar for testing the testbed framework.
REFERENCES
[1] N. Abramson. The Aloha system: another alternative for computer communications. In Proc. of the AFIPS Conf., pages 281–285, Nov. 1970.
[2] A. Arora et al. Kansei: A high-fidelity sensing testbed. In Internet Computing, IEEE, volume 10, pages 35–47, Mar. 2006.
[3] A. Cerpa et al. Temporal properties of low power wireless links: modeling and implications on multi-hop routing. In Proc. of the MobiHoc Symp., pages 414–425, May 2005.
[4] G. Coulson et al. Flexible experimentation in wireless sensor networks. Commun. ACM, 55(1):82–90, Jan. 2012.
[5] D. Culler, D. Estrin, and M. Srivastava. Guest editors’ introduction: Overview of sensor networks. Computer, 37:41–49, Aug. 2004. [6] M. Doddavenkatappa, M. Chan, and A. Ananda. Indriya: A low-cost,
3D wireless sensor network testbed. InTRIDENTCOM, pages 302–316, Apr. 2011.
[7] A. Dunkels, B. Gronvall, and T. Voigt. Contiki - a lightweight and flexible operating system for tiny networked sensors. InProc. of the IEEE LCN Conf., pages 455–462, Nov. 2004.
[8] A. Eswaran, A. Rowe, and R. Rajkumar. Nano-RK: An energy-aware resource-centric RTOS for sensor networks. InProc. of the RTSS, pages 256–265, Dec. 2005.
[9] D. Gay et al. The nesC language: A holistic approach to networked embedded systems. InProc. of the PLDI, pages 1–11, May 2003. [10] O. Gnawali et al. Collection tree protocol. InProc. of the ACM SenSys
Conf., pages 1–14, Nov. 2009.
[11] V. Handziski et al. Twist: a scalable and reconfigurable testbed for wireless indoor experiments with sensor networks. InProc. of Work. REALMAN, pages 63–70, May 2006.
[12] T. W. Hnat et al. Doorjamb: unobtrusive room-level tracking of people in homes using doorway sensors. InProc. of the ACM SenSys Conf., pages 309–322, Nov. 2012.
[13] R. Jurdak et al. Opal: A multiradio platform for high throughput wireless sensor networks. Embedded Systems Letters, 3(4):121–124, 2011.
[14] P. Kumar et al. A hybrid approach to cyber-physical systems verifica-tion. InProc. of the Design Automation Conf., pages 688–696, June 2012.
[15] E. A. Lee. Cyber physical systems: Design challenges. InProc. of the IEEE ISORC Symp., pages 363–369, May 2008.
[16] P. Levis et al. TOSSIM: accurate and scalable simulation of entire TinyOS applications. InProc. of the ACM SenSys Conf., pages 126– 137, Nov. 2003.
[17] P. Levis et al. TinyOS: An operating system for sensor networks. In Ambient Intelligence, pages 115–144, Nov. 2004.
[18] R. Lim et al. FlockLab: a testbed for distributed, synchronized tracing and profiling of wireless embedded systems. InProc. of the IPSN Conf., pages 153–166, Apr. 2013.
[19] J. Lu et al. The smart thermostat: using occupancy sensors to save energy in homes. InProc. of the ACM SenSys Conf., pages 211–224, Nov. 2010.
[20] F. ¨Osterlind and A. Dunkels. Approaching the maximum 802.15.4 multi-hop throughput. InProc. of the HotEmNets, June 2008. [21] F. ¨Osterlind et al. Cross-level sensor network simulation with COOJA.
InProc. of the LCN Conf., pages 641–648, Nov. 2006.
[22] A. Pinto. Methods and tools to enable the design and verification of intelligent systems.AIAA Infotech at Aerospace, 2012.
[23] J. Polastre, R. Szewczyk, and D. Culler. Telos: enabling ultra-low power wireless research. InProc. of the IPSN Conf., pages 364–369, Apr. 2005.
[24] R. Rajkumar et al. Cyber-physical systems: the next computing revolution. InProc. of the Design Automation Conf., pages 731–736, June 2010.
[25] K. Srinivasan et al. An empirical study of low-power wireless. ACM Trans. Sen. Netw., 6(2):16:1–16:49, Mar. 2010.
[26] J. A. Stankovic et al. Opportunities and obligations for physical computing systems. Computer, 38:23–31, Nov. 2005.
[27] M. Szczodrak, O. Gnawali, and L. P. Carloni. Dynamic reconfiguration of wireless sensor networks to support heterogeneous applications. In Proc. of IEEE DCOSS Conf., pages 52–61, May 2013.
[28] J. Sztipanovits et al. Toward a science of cyber-physical system integration.Proceedings of the IEEE, 100(1):29–44, 2012.
[29] G. Werner-Allen, P. Swieskowski, and M. Welsh. Motelab: a wireless sensor network testbed. InProc. of the IPSN Conf., Apr. 2005. [30] Zolertia. Z1 platform. [Online] http://www.zolertia.com.