Human Sciences Development Policy Sociology of Work Research Council Research Unit Unit
RESEARCH CONSORTIUM
________________________________________________________________
ARTISANS/TRADES
Scarce and critical skills
Research Project
MARCH 2008
RESEARCH COMMISSIONED BY
DEPARTMENT OF LABOUR
PROFESSIONS CASE STUDY REPORT: ARTISANS/TRADES
March 2008
RESEARCH CONDUCTED BY
CONTENTS
ACRONYMS...5
INTRODUCTION...7
Aims of the study ...7
Background and context ...7
Scarce and critical skills...8
Methodology...10
The Demand for Artisans ...12
the Supply of Artisans ...25
History of artisan training in South Africa ...40
1800s-1920s ...41
1930s-60s ...43
1970s-1990s ...45
2 000 and beyond ...50
Role of government and the private sector in artisan training ...51
Government ...51
Private sector ...53
Factors behind the decline of apprenticeship...54
State of economy and an inadequate national artisan training commitment: ...55
Role of government (and SOEs) in the delivery of artisans: ...56
Business approach to training: ...57
Social partnership and strategic engagement: ...57
Dilution of workplace learning:...58
Image of the artisan: ...58
Lose of focus on intermediary skills:...59
Incentives/funding:...59
Transformation of the industrial relations system: ...59
Demand-side responses to declining apprenticeship training ...60
Implementation of the Skills Development Act (SDA)...60
DoL initiatives ...62
Learning pathways for artisans: ...62
Initiatives to increase artisan numbers:...62
JIPSA...64
Recommendations ...65
High level and strategic recommendations...65
The need for finalisation of regulation governing artisan development ...65
Resolution of the National Qualifications Framework (NQF) ...66
Recommendations related to improving the effectiveness of the current institutional arrangements...66
Conclusions...67
LIST OF TABLES
Table 1: Total numbers of craft and related trades workers from the OHS and the LFS
databases (1996 – 2005)...12
Table 2: Sectoral distribution of Craft and related trades workers...15
Table 3: Craft and related trades workers by sub-major group occupation and sector (2005)...16
Table 4: Craft and related trades workers by population group (1996 – 2005)...18
Table 5: Gender distribution of all employed people (1996 – 2005)...20
Table 6: Craft and related trades workers by gender (1996 – 2005)...20
Table 7: Age distribution of Craft and related trades workers (1996 – 2005)...21
Table 8: Highest level of education obtained by craft and related trades workers according to the OHS and the LFS databases (1996 – 2005)...22
Table 9: Highest level of education obtained by craft and related trades workers by population group (1996 – 2005)...23
Table 10: Age distribution of all Craft and related trades workers (1996 – 2005)...24
Table 11: Education levels of craft and related trades workers younger than 40 years (2000 – 2005)...24
Table 12: Population group distribution of “qualified” craft and related trades workers younger than 40 (2000 – 2005)...25
Table 13: Proportion of under 40’s workers by occupation (2005)...25
Table 14: Employed and unemployed craft and related trades workers, by level of education (2000 – 2005)...26
Table 15: Education levels of unemployment craft and related trades workers (2000 – 2005)...26
Table 16: Unemployment rate of craft and related trades workers by level of education (2000 – 2005)...27
Table 17: Total number of apprentices qualifying as artisans, 1970 – 2004...28
Table 18: Estimated age distribution of artisans (2004)...28
Table 19: Total number of Apprenticeships (S13 and S28), 1 April 2001 to 31 March 2005...29
Table 20: Types of programmes offered at Public FET colleges...33
Table 21: Enrolment in FET Colleges in 2004...34
Table 22: FET Level 0 enrolments and passes (1996 – 2005)...35
Table 23: FET Level 1-3 enrollments and passes in Engineering studies (1996 – 2005) ...36
Table 24: Occupation field in which Level 1 – 3 learners in engineering studies have
passed exams (total accumulated: 1996 – 2005)...37
Table 25: FET Level 4-6 enrollments and passes in Engineering studies (1996 – 2005) ...38
Table 26: Occupation field in which Level 4 – 6 learners in engineering studies have passed exams (total accumulated: 1996 – 2005)...39
Table 27: Apprentices registered: 1977-1981...51
Table 28: Apprentices and artisans, historical trends, 1985-1994...52
Table 29: New apprenticeship contracts, 1990-1999, prior to the Learnership era...52
LIST OF FIGURES Figure 1: Occupation distribution at a sub-major group level of craft and related trades workers...14
Figure 2: Craft and related trades workers by population group (1996 – 2005)...18
Figure 3: Level of education of craft and related trades workers (1996 – 2005)...23
Figure 4: FET colleges Level 0 enrolments, exam writers and passes (1996 – 2005)...34
Figure 5: FET Level 1-3 passes in Engineering studies (1996 – 2005)...35
ACRONYMS
ANC African National Congress
ASGISA Accelerated and Shared Growth Initiative
CEO Chief Executive Officer
COSATU Congress of South African Trade Union
COTT Central Organisation of Technical Training
DoE Department of Education
DoL Department of Labour
FET Further Education and Training
GDS Growth and Development Summit
HSRC Human Sciences Research Council
ITB Industry Training Board
ISCO International Standards Classification of Occupations
JIPSA Joint Initiative on Priority Skills Acquisition
JIT Just in Time
LFS Labour Force Survey
MERSETA Manufacturing Engineering and Related Services SETA
MQA Mining Qualifications Authority
MTA Manpower Training Act
NMC National Manpower Commission
NQF National Qualifications Framework
NSA National Skills Authority
NSDS National Skills Development Strategy
NTB National Training Board
NTSI National Training Strategy Initiative
NUMSA National Union of Metalworkers of South Africa
OFO Organising Framework for Occupations
OHS October Household Survey
QCTO Quality Council for Trades and Occupations
RPL Recognition of Prior Learning
SAQA South African Qualifications Authority
SASCO South African Standard Classification of Occupations
SDA Skills Development Act
SDF Skill Development Facilitator
SETA Sector Education and Training Authority
SOE State Owned Enterprise
SSP Sector Skills Plans
VET Vocational Education and Training
INTRODUCTION
Aims of the study
This study is part of a range of research projects commissioned by the Department of Labour on aspects of the National Skills Development Strategy (NSDS: 1 April 2005 – 31 March 2010) and on aspects of the labour market and skills development policies of the Department of Labour (DoL). It constitutes Phase 2 of a study to ascertain scarce skills needed in South Africa, namely: Project 4.1: A multiple source identification and verification of scarce and critical skills in the South African labour market. In support of the challenge to address skills shortages in South Africa, the main objective of this study is to identify, collate, interpret and verify information on artisanal skills currently available within the South African labour market.
The aim of the research is to give the Department of Labour a clear idea about the shortage of artisans in South Africa, thereby enhancing the department’s ability to promote skills development towards sustainable growth, development and equity.
This research will make an assessment and provides a view on whether artisans are in shortage in the country, and if so, the type of shortage being experienced and the reasons for the shortage.
Background and context
The South African government’s target as set out in 2004 is to half poverty and unemployment by 2014. During the first 10 years of democracy, growth averaged about 3%. Since 2004 growth has tended to exceed 4% per year, reaching about 5% in 2005. In view of the deficiencies and capabilities of the economy, a two phase target has been set. Between 2005 and 2009, an annual growth rate that averages 4.5% and higher has been set. In the second phase, between 2010 and 2014, the government seeks an average growth rate of 6% of GDP.
The government’s Accelerated and Shared Growth Initiative for South Africa (Asgisa) has identified skilled artisans and vocational skills as critical for sustained growth. In a period of growth it is evident that the South African labour market lacks sufficient skilled professionals, managers and artisans, and that those parts of the legacy of apartheid remains a contributory factor.
The short supply of well qualified, competent and experienced artisans is frequently highlighted in the media with comments from government, employers and unions. While the effect of skill shortage on the economy is not well defined, it is widely believed that the skills crunch will severely hinder South Africa’s ability to deliver an economic growth rate of six percent per annum.
The expansion of intermediate artisan and technical skills for the growing economy has been identified as one of the five main areas for targeted intervention by the Joint Initiative on Priority Skills Acquisition (JIPSA) which was launched by the government on 27 March 2006. The JIPSA initiative argues that for both the public infrastructure and the private investment programmes, the single greatest impediment is the shortage of technically skilled labour at the intermediate level. This is being worsened by the government’s massive investment in
the infrastructure sector in preparations for the 2010 FIFA World Cup. The shortage of skills in key technical fields has been fueled by a drastic decline in number of trained artisans over the last decades.
This shortage of artisans exists alongside a massive expansion of FET college enrolments in engineering studies (in the FET context Artisan related skills are clustered under engineering). According to Patel (2007), a total of 280 000 graduated in engineering studies in 2000 but only 34% found jobs in industry. It is primarily because most of these engineering students are not employer sponsored and that FET courses are not aligned to industry requirements.
The surplus of unemployed FET college engineering graduates is exacerbated by the increase in the number of learners who have enrolled in learnerships since April 2001. According to Kraak (2007), a total of 134 223 learners enrolled for learnerships in the period between 1 April 2001 and 31 March 2005. Research has revealed that most of these learnerships are in non-technical fields and until recently, have tended to be focused at very low skills levels than those that would be required for artisanal work. As a result, this learnership initiative has not sufficiently resolved the shortage of technical skills at the intermediate level.
These factors, among many others, have contributed to the malfunctioning labour market for artisanal skilled labour. It is important to note that artisans fall under the Major Occupational Group 7: Craft and related trade workers and this report uses ‘craft and related workers’ to refer to artisans although not all craft and related trade workers are qualified artisans.
Scarce and critical skills
There are different perspectives attached to the term skills shortages. This report uses the definition of a skills shortage from Shah and Burke (2003):
A skill shortage exists when the demand for workers for a particular occupation is greater than the supply of workers who are qualified, available and willing under existing market conditions.
A distinction is made between the concepts of skills shortages with recruitment difficulties and skills gap. Recruitment difficulties refer to the situation where a business finds it difficult to fill a vacancy in spite of an adequate supply of skilled workers. This may be due to the characteristics of the business, location, remuneration being offered, poor working conditions or the skill set required for the position. Skills gap occurs when existing staff at a given company or industry do not have the skills for the required positions.
In support of the challenge to address skills shortages in South Africa, the vision of the National Skills Development Strategy (NSDS: 1 April 2005 – 31 March 2010) is to develop skills for sustainable growth, development and equity. Through Objective 1 of the NSDS, the Department of Labour commits itself and Sector Education and Training Authorities (SETAs) to prioritise and communicate critical skills.
SETAs are required to identify scarce and critical skills in the research, development and submission of their Sector Skills Plans (SSPs). The Department of Labour used the data on scarce and critical skills contained in Chapter 4 of the SSPs submitted by SETAs early 2006 to develop a list of scarce and critical skills in South Africa. The DoL has prepared this national list of scarce skills “to provide a more concrete and less anecdotal picture of skills
shortages that have been identified as contributing to blocking economic growth and development” (DoL, 2006a:1).
According to the DoL’s Guide for the Development of Five Year Sector Skills Plans and Annual Updates for 2005 to 2010 (Department of Labour 2005), the term scarce skill refers to those occupations in which there is a demand of qualified and experienced people to fill particular roles or occupations in the labour market. Such scarcity can be current or anticipated for the future but it is always associated with a skills shortage which is prohibiting economic activity and growth, and may be because people are not available (absolute) or are available but do not meet other employment criteria (relative), for example geographical locations and employment equity considerations.
The term critical skill refers to a particular skill within an occupation. The concept critical skills, can refer to a) key, generic or fundamental skills such as cognitive skills (problem solving and learning to learn), language and literacy skills, mathematical skills, ICT skills and working in teams as well as b) the occupationally specific “top-up” skills required for performance within that occupation to fill a ‘skills gap’ that might have arisen as a result of changing technology, new forms of work organisation or insufficient training before entering the job market.
A number of sources are signaling the shortage of qualified and experienced artisans in the South African labour market, for example
• In the last two years, Seifsa has approved and developed the accelerated artisan training model at the Fundi training centre in a bid to expand the pool of artisans available in the steel and engineering industry by reducing the training programme to 80 weeks
• Murray & Roberts Cementation advertising artisan positions offering a R20 000 commencement bonus
• Bombela Concession Company appointing about 100 artisans from Philippines, India and the Southern African Development Community for the Gautrain project
• Sasol importing 900 skilled artisans from Asia to undertake maintenance work in September 2006
• A recent additional requirement of the Department of Labour (DoL) is that all SETAs should use their discretionary funds to identify scarce and critical skills in their respective sectors. Reporting of these skills shortages has to be done at the specific occupational level, and occupations have to be defined in terms of the organising framework for occupations (OFO), which is a new occupational classification system However some of the claims about the shortage of artisans and the numbers given are not based on empirical evidence. In other words, most of the figures highlighted in the media and government reports are doubted on methodological grounds. According to the chairperson of the immigration and refugee-law committee of the Law Society of South Africa it appears that not much research was done in developing Home Affairs’ work-permit categories and quotas (Creamer Media, 2006). The Department of Home Affairs expects to update its immigration quota list from the Consolidated Scarce Skills Master List to be developed by the Departments of Labour and Trade and Industry.
Furthermore, SETA quantification of scarce skills is reported insufficient. Patel (2007) reported a low % industry contribution to workplace skills plans (WSPs).
This study is designed to rely on a process of triangulation involving the use of secondary literature; data obtained through previous HSRC, other studies and from Statistics South Africa; and in-depth interviews with a selection of enterprises, industry experts/stakeholders,
education and training institutions and professional bodies. These sources of information will all be drawn together to identify and verify whether artisans are in short supply.
The rest of the report is structured as follows:
• Section two presents the methodology adopted for this study
• Section three gives an overview of the demand for artisans in the South African labour market. It will show an increase in the number of workers reportedly employed as craft and related trade workers from 1,2 million in 1996 to nearly 1.8 million in 2005, constituting a compound annual growth rate of 4,36 % in employment over the ten year period. The greatest and growing demand for Craft and related trades worker skills is for Extraction and building trade workers in the Construction sector. This can attributed to the infrastructure boom ahead of 2010.
• Section four provides an overview of the supply-side of the equation. This will show trends in supply from the traditional apprenticeship route, the learnership route and from public FET colleges. It will also show the misalignment of these routes which result in a large number of people who do not have the artisan ticket but are working as artisans.
• Section five provides a brief history of artisan training in South Africa from the late 1800s until the current period. The historical overview will highlight how artisan development has been influenced by changes in the workplace and the economy as well as by socio-political factors. Drawing on the historical overview and on other data sources,
• Section six discusses the factors behind the decline of apprenticeship training and help to explain the current shortages of artisans.
• Section seven discusses a number of interventions put in place to alleviate the shortages.
• Section eight summarises all the salient points of the study and specific recommendations are made in section nine.
METHODOLOGY
The research methodology adopted for this study drew mainly from the one that was used by Breier and Wildschut (2006) to study the professions and education of medical practitioners. Both quantitative and qualitative methodologies were used in their research.
The focus of this case study on artisans, then, was the relationship between artisanal shortages and the operational effectiveness of labour market processes and institutions. The concern was with the entire labour market process for artisan development, ranging from the way in which demand is manifested through entry into training and ultimate placement on the job.
The following factors were examined-with reference to their effect on labour supply and on demand-supply relationships:
• Factors affecting occupational choice
• The content and length of training programmes
• The financing of training
• The organisation of training
• Labour market information
• Employer hiring and utilization practices, as well as wages trends Research questions
In terms of the above, the key questions that this study aimed to address include the following:
• What skills/forms of knowledge are important, and why?
• What are the skills/knowledge requirements for artisanal work?
• What are the dominant trends in curriculum and pedagogy in the education and training for artisans? To what extent do apprenticeship and learnership programmes prepare learners for the workplace?
• How are firms coping skill/knowledge mismatches and tight labour markets?
• Does immigration play a significant role?
• Can certification schemes help signal skills to employers?
• What are the relative incentives and barriers for upgrading skills?
Drawing on the above considerations, the following activities were undertaken to fulfill the requirements of this project:
Interviews
• A series of interviews were conducted with a number of individuals who had knowledge about artisan development in South Africa.
• In addition to this face-to-face or telephonic interviews were conducted with skills development managers from all the SETAs involved in artisan formation.
• Face-to-face interviews were conducted with two SETA CEOs.
• Face-to-face or telephonic interviews were also conducted with selected members of the Department of Labour (DoL)’s Artisan Development Committee.
• Telephonic interviews were conducted with fifteen registered apprentices
• In addition to the above, telephonic interviews were conducted with skills development facilitators (SDFs) from companies such as Eskom, Sasol, South African railways (Spoornet) and Seifsa.
Documentation
• A review of the documents that have written about the history of artisan development in South Africa from the late 1800’s until the current period;
• Documents (including relevant legislation) pertaining to the statutory framework relating to apprenticeships and learnerships.
• A review of various reports compiled by the DoL on artisan development and on the SETAs.
• Documents from the SETAs; SSPs for the 2005-2009/10 period; Annual reports for the periods 2004-2005 and 2005-2006.
• Reports from the DoL for the periods 2004-2005, 2005-2006 and 2006-2007.
• A wide range of secondary sources referenced in the text of this report were also used
• In addition to this, a dataset was also consulted of employment statistics of the Major Occupational Group 7: Craft and related trades workers according to the South
African Standard Classification of Occupations (SASCO) created from OHS and LFS data.
Methodological challenges
With regards to the data obtained from the above sources a number of issues need to be borne in mind in the reading of this report:
Difficulties were encountered in many cases with the validity and reliability of the data
While there was an attempt to verify this data with other data sources, the validity and reliability of data obtained from these sources was also questionable.
Despite the above, however, an analysis of these pieces of data could at least illuminate the mismatch between the demand and supply of artisanal skills in the country
THE DEMAND FOR ARTISANS
The demand for skills can be derived from changing patterns of sectoral employment due to shifts in the demand for goods and services and changing ways in the production of goods and services (LSC, 2005). For the purposes of quantifying the demand for Artisans, a dataset of employment statistics1 of the Major occupational group 7: Craft and related trades workers
according to the South African Standard Classification of Occupations (SASCO) was created from OHS and LFS data.2 Spanning a 10 year period (1996 – 2005), the information extracted from the OHS (1996-1999) and the LFS (2000-2005 September cycle) is presented in the following sections. The overview covers the distribution of workers with regard to occupations and sectors, race and gender and level of education.
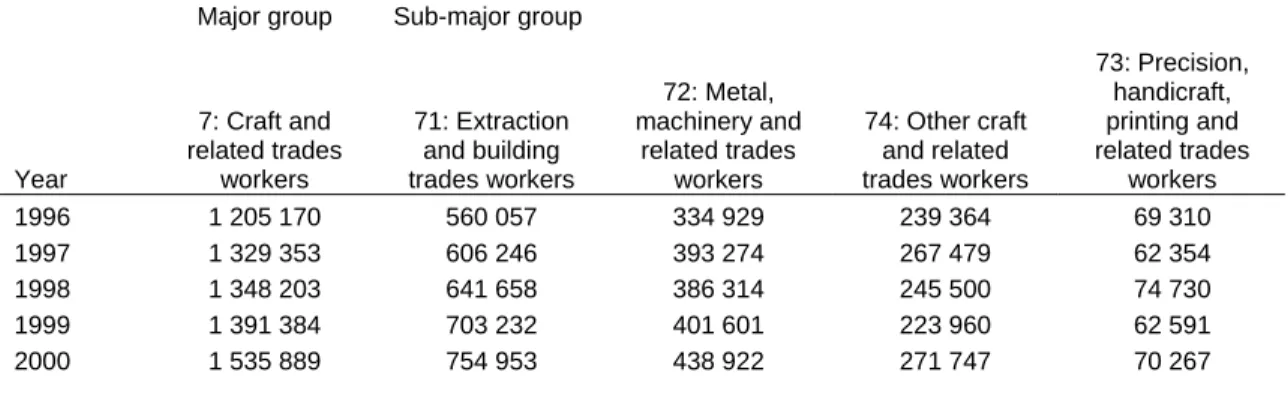
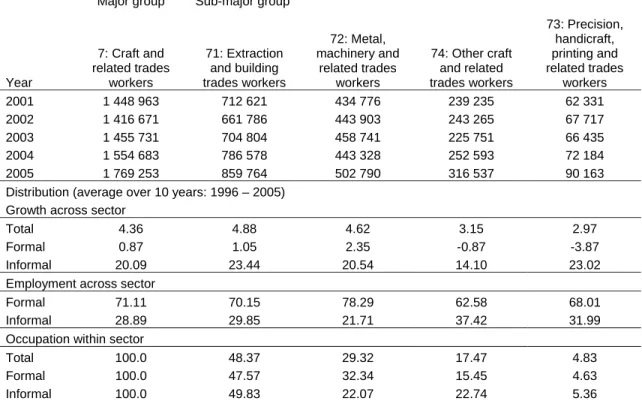
The number of workers reportedly employed as craft and related trades workers increased from 1,2 million in 1996 to nearly 1,8 million in 2005, constituting a compound annual growth rate (CAGR) of 4,36 per cent in employment over the 10 year period (Table 1). The increase in demand occurred across all broad occupational categories, but more so for Extraction and building trades workers (4,88 per cent) and for Metal, machinery and related trades workers (4,62 per cent) than for Other craft and related trades workers (3,15 per cent) and for Precision, handicraft, printing and related trades workers (2,97 per cent).
Table 1: Total numbers of craft and related trades workers from the OHS and the LFS databases (1996 – 2005)
Major group Sub-major group
Year 7: Craft and related trades workers 71: Extraction and building trades workers 72: Metal, machinery and related trades workers 74: Other craft and related trades workers 73: Precision, handicraft, printing and related trades workers 1996 1 205 170 560 057 334 929 239 364 69 310 1997 1 329 353 606 246 393 274 267 479 62 354 1998 1 348 203 641 658 386 314 245 500 74 730 1999 1 391 384 703 232 401 601 223 960 62 591 2000 1 535 889 754 953 438 922 271 747 70 267 1
The number of people employed is used as a proxy for the demand for labour. 2
Labour force statistics are collected by Statistics South Africa (StatsSA) through its household surveys (OHS annually 1994 – 1999 and LFS twice-yearly since 2000). OHS = October Household Survey, LFS = Labour Force Survey
Major group Sub-major group Year 7: Craft and related trades workers 71: Extraction and building trades workers 72: Metal, machinery and related trades workers 74: Other craft and related trades workers 73: Precision, handicraft, printing and related trades workers 2001 1 448 963 712 621 434 776 239 235 62 331 2002 1 416 671 661 786 443 903 243 265 67 717 2003 1 455 731 704 804 458 741 225 751 66 435 2004 1 554 683 786 578 443 328 252 593 72 184 2005 1 769 253 859 764 502 790 316 537 90 163 Distribution (average over 10 years: 1996 – 2005)
Growth across sector
Total 4.36 4.88 4.62 3.15 2.97
Formal 0.87 1.05 2.35 -0.87 -3.87
Informal 20.09 23.44 20.54 14.10 23.02
Employment across sector
Formal 71.11 70.15 78.29 62.58 68.01
Informal 28.89 29.85 21.71 37.42 31.99
Occupation within sector
Total 100.0 48.37 29.32 17.47 4.83
Formal 100.0 47.57 32.34 15.45 4.63
Informal 100.0 49.83 22.07 22.74 5.36
However, it has to be noted that job growth occurred mainly in the informal sector of the economy (one reason for this is the increasing use of casual labour). Formal employment of craft and related trades workers fluctuated over the period under review: from 1,1 million in 1996, down to 0,92 million in 2001, and up to nearly 1,2 million jobs in 2005 (at a CAGR of 0,87 per cent). Employment growth in the formal sector of the economy was lower than the overall growth rate for Extraction and building trades workers (1,05 per cent) and for Metal, machinery and related trades workers (2,35 per cent), while formal employment for Other craft and related trades workers and for Precision, handicraft, printing and related trades workers showed negative growth. Informal sector employment of craft and related trades workers showed significant growth across all sub-major group level occupations (at a CAGR of around 20 per cent). On average, more than a quarter of all craft and related trades workers were employed in the informal sector between 1996 and 2005.
Figure 1 show that nearly half of all craft and related trades workers were classified as Extraction and building trades workers (of which the majority was building trades workers). Around a third of all craft and related trades workers were employed as Metal, machinery and related trades workers (of which nearly two-thirds were Machinery mechanics and fitters). Less than a fifth fell in the category of Other craft and related trades workers and around five percent worked as Precision, handicraft, printing and related trades workers.
Figure 1: Occupation distribution at a sub-major group level of craft and related trades workers 46.47 27.79 19.86 5.75 48.59 28.42 17.89 5.10 0 10 20 30 40 50 60 71: Extraction and building trades workers 72: Metal, machinery and related trades
workers
74: Other craft and related trades workers
73: Precision, handicraft, printing and related trades
workers %
1996 2005
Table 2 provides an overview of trends in employment opportunities for Craft and related trades workers in different industry sectors. Strong growth in the employment of Craft and related trades workers occurred in the Construction sector and in Wholesale and retail trade: repair of motor vehicles, motor cycles and personal and household goods; hotels and restaurants (at a CAGR of above 8 per cent). The Agriculture, hunting, forestry and fishing sector; Manufacturing; and Mining and quarrying sectors also showed growth in the demand for Craft and related trades workers. The number of employment opportunities for Craft and related trades workers in Electricity, gas and water supply and in Financial intermediation, insurance, real estate and business services declined at an compound annual rate of 4 per cent between 1996 and 2005. The number of Craft and related trades workers has declined marginally in the Transport, storage and communication sector and has stayed relatively constant in the Community, social and personal services sector.
Table 2: Sectoral distribution of Craft and related trades workers Year Total 1: Agriculture, hunting, forestry and fishing 2: Mining and quarrying 3: Manufac-turing 4: Electricity, gas and water supply 5: Construct-ion 6: Wholesale and retail trade: repair of motor vehicles, motor cycles and personal and household goods; hotels and restaurants 7: Transport, storage and communi-cation 8: Financial interme-diation, insurance, real estate and business services 9: Community, social and personal services 0: Private households, exterritorial organisa-tions, representa-tives of foreign governments and other activities not adequately defined 10: Not applicable and Unspecified 1996 1201157 14383 109642 395858 49563 287643 172876 36900 36139 58627 39526 0 1997 1324940 21156 123605 405753 46346 331620 210058 38206 47616 61515 39065 0 1998 1331947 23447 157306 384186 32692 356726 237526 38507 32157 50692 16868 1838 1999 1383963 29227 172173 390196 22332 375152 249461 47238 24574 58077 15170 363 2000 1535889 17639 176660 463332 24100 450454 307174 31005 20263 42596 2667 0 2001 1448963 15432 173033 440801 24049 429673 272444 38562 17288 37527 155 0 2002 1416671 14555 161967 469953 25758 400682 253633 31753 14643 39476 4250 0 2003 1455731 20631 162978 460271 26172 414307 277712 23341 24258 44754 967 340 2004 1554683 20114 134159 463543 27153 524051 273296 32931 30038 46996 2166 236 2005 1769253 20404 120171 545192 32807 581571 354993 31873 24379 57097 766 0 CAGR 4.40 3.96 1.02 3.62 -4.48 8.14 8.32 -1.61 -4.28 -0.29 1996 100.00 1.20 9.13 32.96 4.13 23.95 14.39 3.07 3.01 4.88 3.29 0.00 1997 100.00 1.60 9.33 30.62 3.50 25.03 15.85 2.88 3.59 4.64 2.95 0.00 1998 100.00 1.76 11.81 28.84 2.45 26.78 17.83 2.89 2.41 3.81 1.27 0.14 1999 100.00 2.11 12.44 28.19 1.61 27.11 18.03 3.41 1.78 4.20 1.10 0.03 2000 100.00 1.15 11.50 30.17 1.57 29.33 20.00 2.02 1.32 2.77 0.17 0.00 2001 100.00 1.07 11.94 30.42 1.66 29.65 18.80 2.66 1.19 2.59 0.01 0.00 2002 100.00 1.03 11.43 33.17 1.82 28.28 17.90 2.24 1.03 2.79 0.30 0.00 2003 100.00 1.42 11.20 31.62 1.80 28.46 19.08 1.60 1.67 3.07 0.07 0.02 2004 100.00 1.29 8.63 29.82 1.75 33.71 17.58 2.12 1.93 3.02 0.14 0.02 2005 100.00 1.15 6.79 30.81 1.85 32.87 20.06 1.80 1.38 3.23 0.04 0.00
Table 3: Craft and related trades workers by sub-major group occupation and sector (2005) 71: Extraction and building trades workers 72: Metal, machinery and related trades workers 73: Precision, handicraft, printing and related trades workers 74: Other craft and related trades workers
1: Agriculture, hunting, forestry and fishing 875 7139 194 12195 2: Mining and quarrying 89472 28665 1640 393 3: Manufacturing 107043 162515 69145 206490 4: Electricity, gas and water supply 25530 7203 75 0 5: Construction 549396 25601 5338 1236 6: Wholesale and retail trade: repair of motor vehicles, motor cycles and personal and household goods;
hotels and restaurants 42336 222227 6567 83863 7: Transport, storage and communication 5005 26868 0 0 8: Financial intermediation, insurance, real estate and business services 5371 10465 4090 4453 9: Community, social and personal services 33971 12107 3113 7906 0: Private households, exterritorial organisations, representatives of foreign governments and other activities
not adequately defined 766 0 0 0
10: Not applicable and Unspecified 0 0 0 0
Total 859764 502790 90163 316537
Percentage distribution
1: Agriculture, hunting, forestry and fishing 0.10 1.42 0.22 3.85 2: Mining and quarrying 10.41 5.70 1.82 0.12 3: Manufacturing 12.45 32.32 76.69 65.23 4: Electricity, gas and water supply 2.97 1.43 0.08 0.00
5: Construction 63.90 5.09 5.92 0.39
6: Wholesale and retail trade: repair of motor vehicles, motor cycles and personal and household goods;
hotels and restaurants 4.92 44.20 7.28 26.49 7: Transport, storage and communication 0.58 5.34 0.00 0.00 8: Financial intermediation, insurance, real estate and business services 0.62 2.08 4.54 1.41 9: Community, social and personal services 3.95 2.41 3.45 2.50 0: Private households, exterritorial organisations, representatives of foreign governments and other activities
not adequately defined 0.09 0.00 0.00 0.00 10: Not applicable and Unspecified 0.00 0.00 0.00 0.00
Strong growth in certain sectors and slower growth or decline in other sectors resulted in shifts in the distribution of Craft and related trades workers across the different sectors. For example, in 1996 the Manufacturing sector was the largest employer (two-thirds of all Craft and related trades workers) but by 2005 the Construction sector employed two-thirds of all Craft and related trades workers. A fifth of all Craft and related trades workers were employed in the Wholesale and retail trade sector (mainly in the repair of motor vehicles, motor cycles and personal and household goods) in 2005, while in 1996 it was 14 per cent. Nearly two-thirds (63,90 per cent) of all Extraction and building trades workers were employed in the Construction sector in 2005 (Table 3). A further 12,45 per cent was employed in the Manufacturing sector and 10,41 per cent in Mining and quarrying. Forty-four percent of all Metal, machinery and related trades workers were employed in the Wholesale and retail trade sector (mainly in the repair of motor vehicles, motor cycles and personal and household goods), followed by the Manufacturing sector (32,32 per cent). The majority (76,69 per cent) of Precision, handicraft, printing and related trades workers were employed in Manufacturing. Two-thirds of all Other craft and related trades workers have worked in the Manufacturing sector and a quarter in Wholesale and retail trade.
It can be deducted from the above information that the greatest (and growing) demand for Craft and related trades worker skills is for Extraction and building trades workers in the Construction sector. This can be ascribed to the infrastructure boom in preparation for the 2010 FIFA World Cup. This includes building or improving the 10 stadiums to be used, and investment in the environs and access to the stadiums.
The second largest demand is for Metal, machinery and related trades workers in the repair of motor vehicles, motor cycles and personal and household goods and in the Manufacturing sector. This can be attributed to the massive increase of new car sales in the South African motor industry for the past three years. Manufacturing, Engineering and Related Services Seta (merseta) CEO Raymond Patel said that, with 35 000 new vehicle units hitting South African roads every month, it would be a difficult task to ensure that there were enough skilled people to service them (Personal communication, 17 July 2007).
We will see in the supply-side section that the demand in these areas in reinforced by the government’s allocation of R1,9 billion to the re-capitalisation of FET colleges over the period 2006/7 to 2008/9. R50 million is provided for the planning of the re-capitalisation of the colleges. This planning includes the development of curricula for eleven priority skills programmes to be offered from 2007 and replace the N1-N6 programmes. The 11 programmes or vocational fields of study fall into the priority areas identified by Asgisa, including civil engineering and building construction, electrical infrastructure construction, engineering and related design.
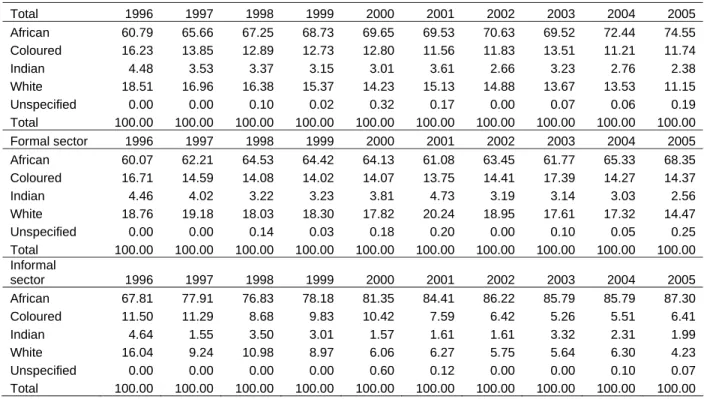
The share of African Craft and related trades workers have increased with 14 percentage points from 60,79 per cent in 1996 to 74,55 per cent in 2005 (Table 4/Figure 2). Consequently the share of coloured, Indian and white Craft and related trades workers has declined. The share of African Craft and related trades workers in the formal economy have increased with 8 percentage points from 60,07 per cent in 1996 to 68,35 per cent in 2005. the table also shows that there are more African Craft and related trades workers (than other races) active in the informal economy. This can be ascribed to South Africa’s historical deep-seated inequalities where Africans were the most marginalized.
Table 4: Craft and related trades workers by population group (1996 – 2005) Total 1996 1997 1998 1999 2000 2001 2002 2003 2004 2005 African 60.79 65.66 67.25 68.73 69.65 69.53 70.63 69.52 72.44 74.55 Coloured 16.23 13.85 12.89 12.73 12.80 11.56 11.83 13.51 11.21 11.74 Indian 4.48 3.53 3.37 3.15 3.01 3.61 2.66 3.23 2.76 2.38 White 18.51 16.96 16.38 15.37 14.23 15.13 14.88 13.67 13.53 11.15 Unspecified 0.00 0.00 0.10 0.02 0.32 0.17 0.00 0.07 0.06 0.19 Total 100.00 100.00 100.00 100.00 100.00 100.00 100.00 100.00 100.00 100.00 Formal sector 1996 1997 1998 1999 2000 2001 2002 2003 2004 2005 African 60.07 62.21 64.53 64.42 64.13 61.08 63.45 61.77 65.33 68.35 Coloured 16.71 14.59 14.08 14.02 14.07 13.75 14.41 17.39 14.27 14.37 Indian 4.46 4.02 3.22 3.23 3.81 4.73 3.19 3.14 3.03 2.56 White 18.76 19.18 18.03 18.30 17.82 20.24 18.95 17.61 17.32 14.47 Unspecified 0.00 0.00 0.14 0.03 0.18 0.20 0.00 0.10 0.05 0.25 Total 100.00 100.00 100.00 100.00 100.00 100.00 100.00 100.00 100.00 100.00 Informal sector 1996 1997 1998 1999 2000 2001 2002 2003 2004 2005 African 67.81 77.91 76.83 78.18 81.35 84.41 86.22 85.79 85.79 87.30 Coloured 11.50 11.29 8.68 9.83 10.42 7.59 6.42 5.26 5.51 6.41 Indian 4.64 1.55 3.50 3.01 1.57 1.61 1.61 3.32 2.31 1.99 White 16.04 9.24 10.98 8.97 6.06 6.27 5.75 5.64 6.30 4.23 Unspecified 0.00 0.00 0.00 0.00 0.60 0.12 0.00 0.00 0.10 0.07 Total 100.00 100.00 100.00 100.00 100.00 100.00 100.00 100.00 100.00 100.00
It was stated earlier that although growth in the employment of Craft and related trades workers took place, it mainly occurred in the informal sector of the economy. This growth can be attributed to a substantial increase in the number of Africans who were employed as craft and related trades workers (from 75 525 in 1996 to 505 205 in 2005). The share of African craft and related trades workers in the informal sector of the economy thus have increase with 20 percentage points from 67,81 percent in 1996 to 87,30 per cent in 2005.
Figure 2: Craft and related trades workers by population group (1996 – 2005)
Women have increased their share amongst the employed from 39,93 per cent in 1996 to 42,55 per cent in 2005 (Table 5). In comparison with total employment, only 16,75 per cent of
0% 20% 40% 60% 80% 100% 1996 1998 2000 2002 2004
1: African 2: Coloured 3: Indian/Asian 4: White
0% 20% 40% 60% 80% 100% 1996 1998 2000 2002 2004
1: African/Black 2: Coloured 3: Indian/Asian 4: White
all Craft and related trades workers were women in 2005 (down from 17,97% in 1996). It is only as Other craft and related trades workers that women dominate. By far the majority of Extraction and building trades workers (94,47 per cent); Metal, machinery and related trades workers (96,34 per cent) and of Precision, handicraft, printing and related trades workers (62,51 per cent) are men.
Table 5: Gender distribution of all employed people (1996 – 2005) 1996 1997 1998 1999 2000 2001 2002 2003 2004 2005 All employed 100.00 100.00 100.00 100.00 100.00 100.00 100.00 100.00 100.00 100.00 Male 60.07 61.01 60.22 57.96 54.50 55.91 56.18 55.44 58.32 57.41 Female 39.93 38.99 39.78 41.97 45.49 44.09 43.79 44.56 41.64 42.55 Unspecified 0.00 0.00 0.00 0.07 0.01 0.00 0.03 0.00 0.04 0.04
Table 6: Craft and related trades workers by gender (1996 – 2005)
1996 1997 1998 1999 2000 2001 2002 2003 2004 2005 7: Craft and related trades workers 100.00 100.00 100.00 100.00 100.00 100.00 100.00 100.00 100.00 100.00 Male 82.03 82.70 85.76 84.56 84.74 83.42 83.53 84.20 84.65 83.25 Female 17.97 17.30 14.24 15.40 15.26 16.58 16.47 15.80 15.35 16.75 Unspecified 0.00 0.00 0.00 0.05 0.00 0.00 0.00 0.00 0.00 0.00 71: Extraction and building trades workers 100.00 100.00 100.00 100.00 100.00 100.00 100.00 100.00 100.00 100.00 Male 93.29 94.61 97.02 95.95 95.45 93.69 94.80 92.49 94.55 94.47 Female 6.71 5.39 2.98 3.96 4.55 6.31 5.20 7.51 5.45 5.53 Unspecified 0.00 0.00 0.00 0.09 0.00 0.00 0.00 0.00 0.00 0.00 72: Metal, machinery and related trades workers 100.00 100.00 100.00 100.00 100.00 100.00 100.00 100.00 100.00 100.00 Male 94.40 96.15 97.84 95.94 97.68 96.99 96.83 96.21 96.58 96.34 Female 5.60 3.85 2.16 4.06 2.32 3.01 3.17 3.79 3.42 3.66 Unspecified 0.00 0.00 0.00 0.00 0.00 0.00 0.00 0.00 0.00 0.00 73: Precision, handicraft, printing and related trades workers 100.00 100.00 100.00 100.00 100.00 100.00 100.00 100.00 100.00 100.00 Male 72.32 70.54 70.82 70.19 72.52 62.33 61.96 55.70 62.06 62.51 Female 27.68 29.46 29.18 29.81 27.48 37.67 38.04 44.30 37.94 37.49 Unspecified 0.00 0.00 0.00 0.00 0.00 0.00 0.00 0.00 0.00 0.00 74: Other craft and related trades workers 100.00 100.00 100.00 100.00 100.00 100.00 100.00 100.00 100.00 100.00 Male 41.10 38.75 41.89 32.41 37.22 33.65 34.60 42.30 39.38 37.89 Female 58.90 61.25 58.11 67.59 62.78 66.35 65.40 57.70 60.62 62.11 Unspecified 0.00 0.00 0.00 0.00 0.00 0.00 0.00 0.00 0.00 0.00
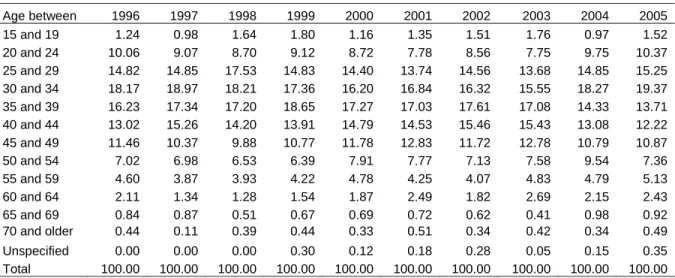
In general Craft and related trades workers are relatively young: around 80 per cent are younger than 50. This can be attributed to the large number of matriculants and FET college graduates entering the occupation and this will be highlighted in the supply section. But it will be seen later on that qualified artisans are older.
Table 7: Age distribution of Craft and related trades workers (1996 – 2005)
Age between 1996 1997 1998 1999 2000 2001 2002 2003 2004 2005 15 and 19 1.24 0.98 1.64 1.80 1.16 1.35 1.51 1.76 0.97 1.52 20 and 24 10.06 9.07 8.70 9.12 8.72 7.78 8.56 7.75 9.75 10.37 25 and 29 14.82 14.85 17.53 14.83 14.40 13.74 14.56 13.68 14.85 15.25 30 and 34 18.17 18.97 18.21 17.36 16.20 16.84 16.32 15.55 18.27 19.37 35 and 39 16.23 17.34 17.20 18.65 17.27 17.03 17.61 17.08 14.33 13.71 40 and 44 13.02 15.26 14.20 13.91 14.79 14.53 15.46 15.43 13.08 12.22 45 and 49 11.46 10.37 9.88 10.77 11.78 12.83 11.72 12.78 10.79 10.87 50 and 54 7.02 6.98 6.53 6.39 7.91 7.77 7.13 7.58 9.54 7.36 55 and 59 4.60 3.87 3.93 4.22 4.78 4.25 4.07 4.83 4.79 5.13 60 and 64 2.11 1.34 1.28 1.54 1.87 2.49 1.82 2.69 2.15 2.43 65 and 69 0.84 0.87 0.51 0.67 0.69 0.72 0.62 0.41 0.98 0.92 70 and older 0.44 0.11 0.39 0.44 0.33 0.51 0.34 0.42 0.34 0.49 Unspecified 0.00 0.00 0.00 0.30 0.12 0.18 0.28 0.05 0.15 0.35 Total 100.00 100.00 100.00 100.00 100.00 100.00 100.00 100.00 100.00 100.00
Not all craft and related trades workers are qualified Artisans. There are five regulatory conditions that govern ‘successful completion’ of an apprenticeship. These conditions are prescribed by the Minister (from Government Gazette No. 2527 of 9 September 1977):
• Entry requirements: the minimum age and educational qualifications for commencing apprenticeship shall be 16 years and Standard 7- although Section 17 allows for 15 year old persons to become apprentices
• Period of apprenticeship: from 3 to 5 years depending on the designated trade
• Formal qualifications: National Certificate, Part 2. (Nated 190/191- N1-N6)
• Workplace experience: as prescribed by the Minister and linked to the period of apprenticeship
• External assessment: successful completion of a qualifying trade test
Although the highest level of education3 is enumerated by Stats SA during surveys, no specific provision is made for the identification of workers who have passed a trade test or for example those who have obtained a Government Certificate of Competency (Government Ticket).
In an attempt to estimate the number of qualified artisans currently working in the South African labour market, the highest level of education captured in the OHS and the LFS databases (1996 – 2005) were recoded to form four broad categories of qualifications, namely:
• “Unqualified”: which includes "No Schooling"; Grade 1 up to Grade 11 with no additional Certificate/Diploma
• Matriculants: which includes Grade 12/Std 10/Matric with no additional Certificate/Diploma or Degree
• “Under qualified”: this category includes NI-NIII, Diploma/Certificate with less than Grade 12/Std 10
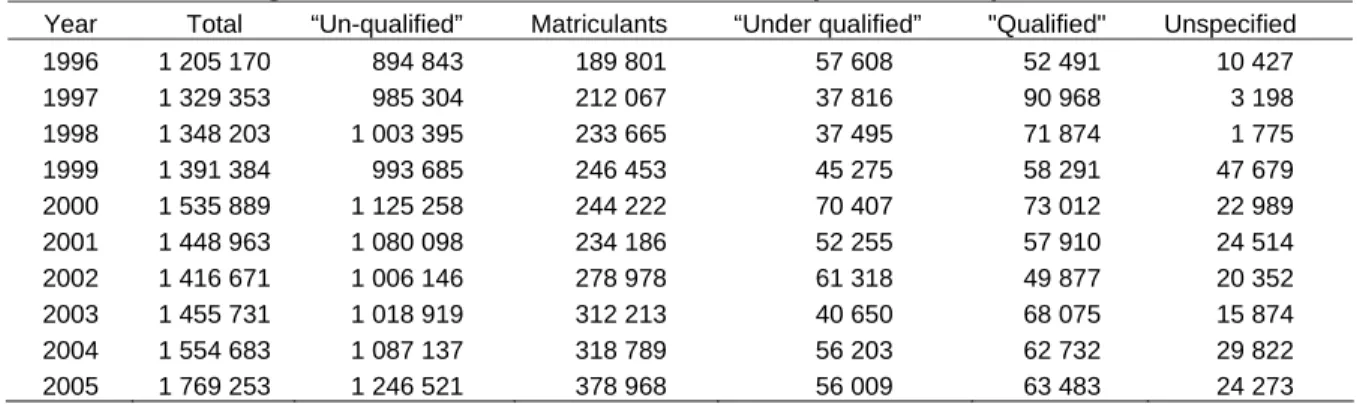
• “Qualified”: which includes Grade 12/Std 10 plus Diploma/Certificate or Degree The number of craft and related trades workers was cross tabulated with the newly created highest level of education variable (presented in Table 8).
Table 8: Highest level of education obtained by craft and related trades workers according to the OHS and the LFS databases (1996 – 2005)
Year Total “Un-qualified” Matriculants “Under qualified” "Qualified" Unspecified 1996 1 205 170 894 843 189 801 57 608 52 491 10 427 1997 1 329 353 985 304 212 067 37 816 90 968 3 198 1998 1 348 203 1 003 395 233 665 37 495 71 874 1 775 1999 1 391 384 993 685 246 453 45 275 58 291 47 679 2000 1 535 889 1 125 258 244 222 70 407 73 012 22 989 2001 1 448 963 1 080 098 234 186 52 255 57 910 24 514 2002 1 416 671 1 006 146 278 978 61 318 49 877 20 352 2003 1 455 731 1 018 919 312 213 40 650 68 075 15 874 2004 1 554 683 1 087 137 318 789 56 203 62 732 29 822 2005 1 769 253 1 246 521 378 968 56 009 63 483 24 273
Based on a narrow definition for “qualified” artisans (i.e. Grade 12/Std 10 plus Diploma/ Certificate or Degree), it is estimated that there were a total of 63 483 qualified artisans who have practiced their skills in both the formal and informal economy of the country in 2005.
A person can enter his/her theoretical training to become an artisan (i.e. at a technical college or training institute) with a Grade 10/Standerd 8 qualification with Mathematics, Physical Science and a Language as the minimum requirement. A further 56 009 craft and related trades workers reported in 2005 having obtained an NI-NIII qualification, or a Diploma/Certificate with less than Grade 12/Std 10. If this group is also accepted to be qualified artisans then a total of 119 492 were working in the country in 2005. This might be an under estimation if compared to the total number of artisans who have passed their trade test over the years and who still might be practicing in 2005 (see below).
It has to be noted, that on average, the number of qualified artisans stayed constant (attributable to the decline i.e. since 1985 in the number of artisans who have passed the trade test – see section on supply), while the number of “unqualified” people and matriculants who were employed as craft and related trades workers have increased over the 10 years under review (Figure 2). The stagnation in the supply of qualified artisans, while there is a clear indication of an increase in the demand based on employment explains the claims made that there is a “dire” need for qualified artisans in the country.
Figure 3: Level of education of craft and related trades workers (1996 – 2005)
Craft and related trades workers R2 = 0.7458
0 200000 400000 600000 800000 1000000 1200000 1400000 1600000 1800000 1996 1997 1998 1999 2000 2001 2002 2003 2004 2005 Total employed 1 "Unqualified" 2 Matriculants 3 "Underqualified" 4 "Qualified" Linear (Total employed)
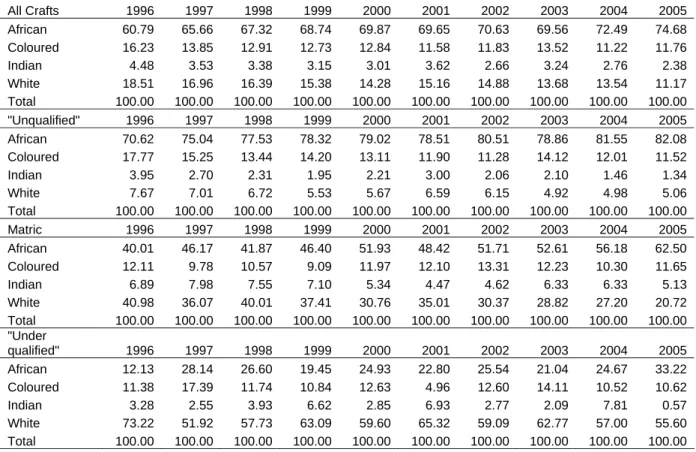
Furthermore, “under qualified’ and “qualified” Artisans are mainly white and are aging, while the “Unqualified” and Matric craft and related trade workers are mainly African. This can be explained by the historical legacies of the apartheid training system where most Blacks were excluded from the apprenticeship system. However, the fact that they are decreasing (by 2005 African “Qualified” constituted nearly half of all Artisans) may point at whites not entering the occupation and/or they are aging.
Table 9: Highest level of education obtained by craft and related trades workers by population group (1996 – 2005)
All Crafts 1996 1997 1998 1999 2000 2001 2002 2003 2004 2005 African 60.79 65.66 67.32 68.74 69.87 69.65 70.63 69.56 72.49 74.68 Coloured 16.23 13.85 12.91 12.73 12.84 11.58 11.83 13.52 11.22 11.76 Indian 4.48 3.53 3.38 3.15 3.01 3.62 2.66 3.24 2.76 2.38 White 18.51 16.96 16.39 15.38 14.28 15.16 14.88 13.68 13.54 11.17 Total 100.00 100.00 100.00 100.00 100.00 100.00 100.00 100.00 100.00 100.00 "Unqualified" 1996 1997 1998 1999 2000 2001 2002 2003 2004 2005 African 70.62 75.04 77.53 78.32 79.02 78.51 80.51 78.86 81.55 82.08 Coloured 17.77 15.25 13.44 14.20 13.11 11.90 11.28 14.12 12.01 11.52 Indian 3.95 2.70 2.31 1.95 2.21 3.00 2.06 2.10 1.46 1.34 White 7.67 7.01 6.72 5.53 5.67 6.59 6.15 4.92 4.98 5.06 Total 100.00 100.00 100.00 100.00 100.00 100.00 100.00 100.00 100.00 100.00 Matric 1996 1997 1998 1999 2000 2001 2002 2003 2004 2005 African 40.01 46.17 41.87 46.40 51.93 48.42 51.71 52.61 56.18 62.50 Coloured 12.11 9.78 10.57 9.09 11.97 12.10 13.31 12.23 10.30 11.65 Indian 6.89 7.98 7.55 7.10 5.34 4.47 4.62 6.33 6.33 5.13 White 40.98 36.07 40.01 37.41 30.76 35.01 30.37 28.82 27.20 20.72 Total 100.00 100.00 100.00 100.00 100.00 100.00 100.00 100.00 100.00 100.00 "Under qualified" 1996 1997 1998 1999 2000 2001 2002 2003 2004 2005 African 12.13 28.14 26.60 19.45 24.93 22.80 25.54 21.04 24.67 33.22 Coloured 11.38 17.39 11.74 10.84 12.63 4.96 12.60 14.11 10.52 10.62 Indian 3.28 2.55 3.93 6.62 2.85 6.93 2.77 2.09 7.81 0.57 White 73.22 51.92 57.73 63.09 59.60 65.32 59.09 62.77 57.00 55.60
"Qualified" 1996 1997 1998 1999 2000 2001 2002 2003 2004 2005 African 20.03 25.11 29.38 32.11 30.17 29.14 30.47 33.70 40.35 46.20 Coloured 12.72 6.37 12.40 5.45 10.28 8.11 10.48 10.68 3.06 8.56 Indian 6.31 2.60 4.56 4.58 7.82 8.32 4.80 7.38 3.93 9.00 White 60.94 65.91 53.66 57.85 51.73 54.44 54.25 48.24 52.65 36.23 Total 100.00 100.00 100.00 100.00 100.00 100.00 100.00 100.00 100.00 100.00 Age distribution
From Table 10 it can be seen that around 60 per cent of all craft and related trades workers were younger than 40 years between 1996 and 2005.
Table 10: Age distribution of all Craft and related trades workers (1996 – 2005)
Age between 1996 1997 1998 1999 2000 2001 2002 2003 2004 2005 15 and 19 1.24 0.98 1.64 1.80 1.16 1.35 1.51 1.76 0.97 1.52 20 and 24 10.06 9.07 8.70 9.12 8.72 7.78 8.56 7.75 9.75 10.37 25 and 29 14.82 14.85 17.53 14.83 14.40 13.74 14.56 13.68 14.85 15.25 30 and 34 18.17 18.97 18.21 17.36 16.20 16.84 16.32 15.55 18.27 19.37 35 and 39 16.23 17.34 17.20 18.65 17.27 17.03 17.61 17.08 14.33 13.71 40 and 44 13.02 15.26 14.20 13.91 14.79 14.53 15.46 15.43 13.08 12.22 45 and 49 11.46 10.37 9.88 10.77 11.78 12.83 11.72 12.78 10.79 10.87 50 and 54 7.02 6.98 6.53 6.39 7.91 7.77 7.13 7.58 9.54 7.36 55 and 59 4.60 3.87 3.93 4.22 4.78 4.25 4.07 4.83 4.79 5.13 60 and 64 2.11 1.34 1.28 1.54 1.87 2.49 1.82 2.69 2.15 2.43 65 and 69 0.84 0.87 0.51 0.67 0.69 0.72 0.62 0.41 0.98 0.92 Age 65 + 0.44 0.11 0.39 0.44 0.33 0.51 0.34 0.42 0.34 0.49 Unspecified 0.00 0.00 0.00 0.30 0.12 0.18 0.28 0.05 0.15 0.35 Total 100.00 100.00 100.00 100.00 100.00 100.00 100.00 100.00 100.00 100.00 Younger 40 60.51 61.21 63.28 61.76 57.75 56.73 58.56 55.81 58.18 60.22 40 and older 38.21 37.82 35.82 36.83 41.12 41.87 40.20 43.31 40.35 38.00 Points to note:
• Unqualified craft and related trades workers are older
• Craft and related trades workers with Matrics are young and it will be shown in supply section below that the proportion of Matrics working as Craft and related trades workers have increased from 15,20 per cent of all craft and related trades workers in 2000 to 21,20 per cent in 2005.
• “Qualified” Artisans are relatively young: 67,14 per cent were younger than 40 years in 2005. This may relate to the FET output – see supply section below. However, Indlela data on the apprentices who have passed their trade test (see supply section) shows that Artisans are aging: it is estimated that nearly three-quarters (72,94 per cent) of Artisans are 40 years and older.
Table 11: Education levels of craft and related trades workers younger than 40 years (2000 – 2005)
Younger than 40 2000 2001 2002 2003 2004 2005
All Craft and related trades workers 57.75 56.73 58.56 55.81 58.18 60.22
Unqualified 52.88 51.80 53.96 49.79 52.98 55.58
Matric 78.43 76.74 75.79 74.69 74.70 74.74
“Under qualified” 62.38 63.79 65.88 69.55 62.97 59.77
“Qualified” 61.67 62.95 52.46 53.10 65.46 67.14
The fact that Artisans are ageing mainly applies to white craft and related trades workers. Mainly whites who were allowed to qualify as Artisans – before blacks were allowed – are indeed getting old now (Table 12). Encouraging to see majority of African and coloured craft and related trades workers are younger than 40 (although no increases in recent output of Artisans, but increases in FET output) it does point to blacks getting opportunities to qualify as Artisans.
Table 12: Population group distribution of “qualified” craft and related trades workers younger than 40 (2000 – 2005)
“Qualified” and younger than 40 2000 2001 2002 2003 2004 2005
African 69.49 77.30 78.12 56.93 81.58 78.64
Coloured 52.05 70.45 74.33 65.09 71.07 92.71
Indian 42.36 60.74 49.61 73.40 96.34 64.79
White 60.62 52.90 33.32 44.89 48.43 49.83
Total 61.67 62.95 52.46 53.10 65.46 67.14
Compared to workers in other occupations, “qualified” craft and related trades workers are relatively young.
Table 13: Proportion of under 40’s workers by occupation (2005)
Under 40 All workers "Qualified"
All Occupation groups 63.78 58.78
1: Legislators, senior officials and managers 44.00 47.41
2: Professionals 55.81 55.60
3: Technicians and associate professionals 56.36 54.86
4: Clerks 65.57 76.16
5: Service workers and shop and market sales workers 70.39 72.95 6: Skilled agricultural and fishery workers 43.20 44.66 7: Craft and related trades workers 60.22 67.14 8: Plant and machine operators and assemblers 52.78 68.16
9: Elementary occupations 56.71 68.85
THE SUPPLY OF ARTISANS
The current supply of labour includes all those who are either working or looking for work, that is, all those who are participating in the labour force (GNB, 1998, LSC, 2005). Unemployed people with qualifications relevant to the profession under review may point to an oversupply of skills or to a mismatch in the provision of skills. The supply of skills can also be derived from graduation trends and availability. Graduation trends refer to the number of qualifications awarded within a specific academic year. The number of graduates of working-age (15 – 65 year old) that have accumulated over the years provides an indication of the current availability of the number of people with qualifications in a particular occupation.
Supply derived from employed and unemployed Craft and related trades workers
of Artisans (employed and unemployed): The highest level of education captured in the LFS databases (2000 – 2005) were recoded to form four broad categories of qualifications, namely unqualified; matriculants; under qualified and qualified. Unemployed Craft and related trades workers were identified by using the “previous occupation” variable on the LFS.
The number of workers who have worked or who have seek employment as craft and related trades workers have increased from 1,8 million in 2000 to 2 million in 2005 (LFS September 2000 and 2005) (Table 14). However, it was shown in the Section on demand that the majority of the employed craft and related trades workers could not be accepted as qualified Artisans. The combined profile of employed and unemployed craft and related trades workers is similar: nearly two-quarters were unqualified in 2005. A fifth of all craft and related trades workers in 2005 have obtained a Matriculation qualification. Matrics working or seeking work as craft and related trades workers have increased from 15,20 per cent in 2000 to 21,20 per cent in 2005.
Table 14: Employed and unemployed craft and related trades workers, by level of education (2000 – 2005) 2000 2001 2002 2003 2004 2005 Unqualified 1382273 1374361 1259881 1243434 1292926 1434833 Matric 275471 268282 317454 351482 360202 419759 Under qualified 73846 58546 65373 42647 60323 60262 Qualified 80542 63718 54650 73605 65418 65052 Total 1812132 1764907 1697358 1711168 1778869 1979906 % Distribution 2000 2001 2002 2003 2004 2005 Unqualified 76.28 77.87 74.23 72.67 72.68 72.47 Matric 15.20 15.20 18.70 20.54 20.25 21.20 Under qualified 4.08 3.32 3.85 2.49 3.39 3.04 Qualified 4.44 3.61 3.22 4.30 3.68 3.29 Total 100.00 100.00 100.00 100.00 100.00 100.00
According to LFS (September) data, there were 234 925 craft and trade trades workers who could not find employment in 2005. The question is: can the unemployed craft and related trades workers plug the shortage of Artisan skills? Unlikely, if it is considered that 80,16 per cent of all craft and related trades workers who was unemployed in 2005 was “unqualified” which includes "No Schooling"; Grade 1 up to Grade 11 with no additional Certificate/Diploma. A further 17,36 per cent only had Matric. The fact that very few “under qualified” and “qualified” craft and related trades workers were unemployed confirms the demand for Artisans: only 2,48 per cent of all unemployed craft and related trades workers have obtained NI-NIII, Diploma/Certificate with less than Grade 12/Std 10 or Grade 12/Std 10 plus Diploma/Certificate or Degree.
Table 15: Education levels of unemployment craft and related trades workers (2000 – 2005) 2000 2001 2002 2003 2004 2005 Unqualified 257015 294263 253735 224515 205789 188312 Matric 31249 34096 38476 39269 41413 40791 Under qualified 3439 6291 4055 1997 4120 4253 Qualified 7530 5808 4773 5530 2686 1569 Total 299233 340458 301039 271311 254008 234925
2000 2001 2002 2003 2004 2005 Unqualified 85.89 86.43 84.29 82.75 81.02 80.16 Matric 10.44 10.01 12.78 14.47 16.30 17.36 Under qualified 1.15 1.85 1.35 0.74 1.62 1.81 Qualified 2.52 1.71 1.59 2.04 1.06 0.67 Total 100.00 100.00 100.00 100.00 100.00 100.00
The increase in the demand for craft and related trades workers – at a compound annual growth rate (CAGR) of 4,36 per cent reported in the previous section on demand – has contributed to a decrease in the number of unemployed craft and related trades workers. In 2000, nearly 300 000 craft and related trades workers were reported to have been actively looking for a job. This figure dropped to 235 000 in 2005, signifying a compound annual decrease of -4,7 per cent in unemployment among craft and related trades workers.
Clearly the demand for craft and related trades workers is immense (even though they are not qualified Artisans). Table 16 shows that the unemployment rate among “unqualified” craft and related trades workers have dropped from 18,59 per cent in 2000 to 13,12 per cent in 2005. The unemployment rate among Matrics who were looking for craft and related trades work decreased from 11,34 per cent to 9,72 per cent. The unemployment rate among “qualified” craft and related trades workers dropped significantly (from 9,35 per cent in 2000 to 2,41 per cent in 2005). Although the unemployment rate for “under qualified” craft and related trades workers showed an increase (from 4,66 per cent to 7,06 per cent) the increase in numbers was low (from 3 439 workers in 2000 to 4 253 workers in 2005).
Table 16: Unemployment rate of craft and related trades workers by level of education (2000 – 2005) Unemployment rate 2000 2001 2002 2003 2004 2005 Unqualified 18.59 21.41 20.14 18.06 15.92 13.12 Matric 11.34 12.71 12.12 11.17 11.50 9.72 Under qualified 4.66 10.75 6.20 4.68 6.83 7.06 Qualified 9.35 9.12 8.73 7.51 4.11 2.41 Total 16.51 19.29 17.74 15.86 14.28 11.87
Although the pressing demand for artisan skills creates employment opportunities for lower qualified craft and related trades workers there still were a total of 229 103 unemployed workers who have worked as craft and related trades workers before and who were looking for a job in 2005. If it is considered that around 2 million people were working – or wanted to work as craft and related trades workers in 2005 but that 93,67 per cent were not qualified artisans then there were around 125 000 craft and related trades workers who have obtained NI-NIII, Diploma/Certificate with less than Grade 12/Std 10 qualifications or a Grade 12/Std 10 plus Diploma/Certificate or Degree.
Availability of Artisans
Availability refers to the accumulated number of individuals over a period of time that has obtained qualifications in a particular field of study. One source that can be used to estimate the number of artisans in the country is the Indlela register of the number of people for whom trade testing was arranged and those who have passed the trade test. It has to be noted that trends data is not available in terms of race, gender, age, or field of qualification.
From Table 17 it can be seen that a total of 270 586 apprentices have qualified as artisans between 1970 and 2004. An effort to quantify the number of artisans that might be available to practice their skills in the country has to consider the perceived aging of the pool of artisans. In theory it might take a person up to six years to qualify as an artisan (if it is considered that a person can enter into an apprenticeship at the age of 17, receive three years of theoretical training, obtain workplace experience for a further three years before a trade test is arranged). It is therefore safe to set the average age for a person to qualify as an artisan at 25 years. If this assumption is accepted then the Class of 1972 has reached retirement age (60) and the Class of 1982 would have been around 50 years old in 2007. If the 97 750 artisans that have qualified between 1970 and 1982 (36.13% of all artisans on the Indlela register) are excluded on the basis that they are aging, then an estimated 172 836 artisans might be available to the country.
It has to be acknowledged that a large number of artisans might have been lost due to migration and that a large number of artisans might be working overseas due to the global shortage of artisans. If it is assumed that around 50 000 of the artisans that have qualified since 1983 have left the country or are working abroad then there could be around 120 000 qualified artisans in the country: a figure very close to the number estimated based on the analysis of Stats SA data.
Table 17: Total number of apprentices qualifying as artisans, 1970 – 2004
Year Arranged Passed Total Year Arranged Passed Total 1970 14 500 5 500 20 000 1988 18 000 11 000 29 000 1971 16 500 6 050 22 550 1989 15 500 8 000 23 500 1972 16 000 7 000 23 000 1990 15 000 7 500 22 500 1973 15 950 7 000 22 950 1991 14 900 7 200 22 100 1974 18 100 8 000 26 100 1992 15 050 8 000 23 050 1975 18 500 8 050 26 550 1993 16 000 9 550 25 550 1976 17 000 8 050 25 050 1994 11 800 7 000 18 800 1977 18 000 8 500 26 500 1995 9 000 5 000 14 000 1978 19 000 9 500 28 500 1996 5 000 3 000 8 000 1979 18 400 9 600 28 000 1997 8 910 4 874 13 784 1980 18 400 10 000 28 400 1998 9 403 4 933 14 336 1981 18 300 10 500 28 800 1999 9 517 5 145 14 662 1982 19 500 11 000 30 500 2000 11 000 5 600 16 600 1983 22 100 12 000 34 100 2001 5 552 3 191 8 743 1984 22 500 12 000 34 500 2002 6 448 2 916 9 364 1985 26 000 13 500 39 500 2003 6 343 2 779 9 122 1986 24 950 13 100 38 050 2004 6 157 2 548 8 705 1987 23 000 13 000 36 000 Total 530 280 270 586 800 866 Source: Indlela
Table 18 below shows that qualified artisans are ageing and this could be attributed to the decline in apprenticeship training overtime.
Table 18: Estimated age distribution of artisans (2004) Age between Passed Distribution Arranged Distribution 26 and 29 11 434 4.31 24 500 4.75 30 and 34 23 552 8.88 43 830 8.50 35 and 39 36 750 13.86 66 750 12.94 40 and 44 52 600 19.84 96 450 18.70 45 and 49 59 000 22.26 108 400 21.02
Age between Passed Distribution Arranged Distribution 50 and 54 45 650 17.22 90 800 17.60 55 and 59 36 100 13.62 85 050 16.49 Total 26 - 59 265 086 100.00 515 780 100.00 26 and 39 71 736 27.06 135 080 26.19 40 and 59 193 350 72.94 380 700 73.81
A second source from which availability and graduation trends can be obtained is SETAs through the Skills Development Act (SDA), finally promulgated in 1998. The Act proposed that learnerships would incorporate traditional apprenticeships but did not say that apprenticeships would no longer be allowed. It repealed a number of the sections of the 1990 Manpower Training Act but retained a number of sections relating to apprenticeship training. As a result, apprentices continue to be trained under the two routes of the Manpower Training Act of 1981: S (13) MTA and S (28) MTA.
• Chapter 2, Section 13 of the Manpower Training Act of 1981 refers to people who have been formally indentured as apprentices, who meet the age criteria, who serve the full time period and who pass the trade test as prescribed by the Minister.
• Chapter 2, Section 28 of the Manpower Training Act of 1981 refers to people not indentured under Section 13 but who satisfy the Registrar of Training that they have gained sufficient work experience over an adequate period of time, and can therefore write a trade test, after which (if they pass), they can become qualified artisans.
Table 18 thus highlights the number of apprenticeships enrolled in these two routes during the period 1 April 2001 until 31 March 2005. This period constitutes the four-year period of the First Phase of the implementation of the National Skills Development Strategy (NSDS). A total of 21 237 learners were indentured as apprentices in the four year period, and counted together with the number of employed people enrolled in apprenticeships (S28) during the same four year period, gives a grant total of 36 703.
Table 19: Total number of Apprenticeships (S13 and S28), 1 April 2001 to 31 March 2005
SETA:
Apprenticeships enrolled between 1 April 2001 and 31 March 2005
Section 13, MTA
Apprenticeships enrolled between 1 April 2001 and 31 March 2005 Section (28) MTA Total number of apprentices enrolled between 1 April 2001 and 31 March 200 Sections 13 and 28 FASSET 0 0 0 BANKSETA 0 0 0 CHIETA 929 929 1858 CTFL 88 35 123 CETA 351 0 351 DIDTETA 1529 0 1529 ETDPSETA 0 0 0 ESETA 568 191 759 FOODBEV 90 0 90 FIETA 586 55 641 HWSETA 0 0 0 ISETT 0 0 0
SETA:
Apprenticeships enrolled between 1 April 2001 and 31 March 2005
Section 13, MTA
Apprenticeships enrolled between 1 April 2001 and 31 March 2005 Section (28) MTA Total number of apprentices enrolled between 1 April 2001 and 31 March 200 Sections 13 and 28 LGWSETA 1991 619 2610 MAPPP 1408 167 1575 MQA 3494 402 3896 MERSETA 6935 5642 12577 POSLEC 0 0 0 PAETA 5 92 97 PSETA 20 5887 5907 SETASA 38 0 38 SERVICES 808 789 1597 THETA 0 0 0 TETA 2397 658 3055 W&RSETA 0 0 0 TOTAL 21237 15466 36703 AVERAGE ENROLMENT PER ANNUM 5309 3866 9175
Source: Department of Labour, 2006a Trends in supply from public FET colleges
Further Education and Training (FET) colleges are another important avenue for technical skills development at the intermediate level, with Minister of Education, Naledi Pandor describing them as having taken a central role to the delivery of priority skills needed in South Africa. The new curriculum for FET colleges that will lead to National Certificate (Vocational) (NC (V)) qualification is a comprehensive and coordinated response to this skills development agenda.
The Department of Education research shows that the previous programmes have some value, but are generally outdated, including the National Technical Education, better known as Nated programmes (N1 to N6), some of which have not be revised since the 1980s. the following underpin this;
• the current programmes cause a separation of theory and practice, giving rise to irrelevant programmes that fail to meet the needs of students and the changing demands of the economy;
• the poorly articulated programmes and qualifications inhibit student mobility across programmes and providers or learning sites; and
• students exiting the system have to repeat passed subjects when they enter the system.
Other programmes to be replaced are the National Certificate Orientation or N1, which was the orientation programme used to bridge the maths and science gap some students might suffer from.; the National Intermediate Certificate, which is parallel to grade 11, and the National Senior Certificate, parallel to the Senior Certificate, commonly known as “matric”.
In replacing these programmes, the NC (V) is a response to scarce and high-demand skills, and also heeds calls from employers saying they want “thinking” employees. In