Technological University Dublin Technological University Dublin
ARROW@TU Dublin
ARROW@TU Dublin
Dissertations School of Computing
2020
Customer Churn Prediction
Customer Churn Prediction
Deepshikha WadikarTechnological University Dublin
Follow this and additional works at: https://arrow.tudublin.ie/scschcomdis
Part of the Computer Engineering Commons, and the Computer Sciences Commons
Recommended Citation Recommended Citation
Wadikar, D. (2020). Customer churn prediction. Masters Dissertation. Technological University Dublin. DOI:10.21427/kpsz-x829
This Dissertation is brought to you for free and open access by the School of Computing at ARROW@TU Dublin. It has been accepted for inclusion in Dissertations by an authorized administrator of ARROW@TU Dublin. For more information, please contact
[email protected], [email protected], [email protected].
This work is licensed under a Creative Commons Attribution-Noncommercial-Share Alike 3.0 License
Customer Churn Prediction
Deepshikha Wadikar
D17128916
A dissertation submitted in partial fulfilment of the requirements of
Technological University Dublin for the degree of
M.Sc. in Computer Science (Data Analytics)
DECLARATION
I certify that this dissertation which I now submit for examination for the award of MSc in Computing (Data Analytics), is entirely my own work and has not been taken from the work of others save and to the extent that such work has been cited and acknowledged within the test of my work.
This dissertation was prepared according to the regulations for postgraduate study of the Technological University Dublin and has not been submitted in whole or part for an award in any other Institute or University.
The work reported on in this dissertation conforms to the principles and requirements of the Institute’s guidelines for ethics in research.
Signed: Deepshikha Wadikar
ABSTRACT
Churned customers identification plays an essential role for the functioning and growth of any business. Identification of churned customers can help the business to know the reasons for the churn and they can plan their market strategies accordingly to enhance the growth of a business. This research is aimed at developing a machine learning model that can precisely predict the churned customers from the total customers of a Credit Union financial institution.
A quantitative and deductive research strategies are employed to build a supervised machine learning model that addresses the class imbalance problem handled feature selection and efficiently predict the customer churn. The overall accuracy of the model, Receiver Operating Characteristic curve and Area Under the Receiver Operating Characteristic Curve is used as the evaluation metrics for this research to identify the best classifier.
A comparative study on the most popular supervised machine learning methods – Logistic Regression, Random Forest, Support Vector Machine (SVM) and Neural Network were applied to customer churning prediction in a CU context. In the first phase of our experiments, the various feature selection techniques were studied. In the second phase of our study, all models were applied on the imbalance dataset and results were evaluated. SMOTE technique is used to balance the data and then the same models were applied on the balanced dataset and results were evaluated and compared. The best over-all classifier was Random Forest with accuracy almost 97%, precision 91% and recall as 98%.
Key words: Credit Union, Churn Prediction, Supervised Machine Learning, Classification, Sampling, Feature Selection.
ACKNOWLEDGEMENTS
I would first like to express my sincere thanks to my supervisor Prof. Vincent McGrady for providing me with the data for my research. His immense knowledge, continuous support, guidance and advice throughout the project helped me and encouraged me a lot to do better in my thesis writing. You are an amazing mentor and without your support, this thesis would not have been possible.
I would also like to thank DIT and Prof. Luca Longo, M.Sc. thesis coordinator, for providing me with the opportunity to work on this thesis.
Finally, I would like to thank all my friends and family for all their encouragement, support and motivation during my studies. Special gratitude to my parents Pradeep
and Chetna, and my husband Nitin for their love, support and encouragement throughout my studies. This accomplishment would not have been possible without them.
TABLE OF CONTENTS
ABSTRACT ... II ACKNOWLEDGEMENTS ... III TABLE OF FIGURES ... VII TABLE OF TABLES ... VIII LIST OF ACRONYMS ... IX 1. INTRODUCTION ... 1 1.1 BACKGROUND ... 1 1.2 RESEARCH PROJECT ... 2 1.3 RESEARCH OBJECTIVES ... 3 1.4 RESEARCH METHODOLOGIES ... 4
1.4.1 Based on type: Primary Vs. Secondary Research ... 4
1.4.2 Based on objective: Qualitative Vs. Quantitative Research ... 5
1.4.3 Based on form: Exploratory Vs. Constructive Vs. Empirical ... 5
1.4.4 Based on reasoning: Deductive Vs. Inductive Research ... 6
1.5 SCOPE AND LIMITATIONS ... 7
1.6 DOCUMENT OUTLINE ... 7
2. LITERATURE REVIEW ... 9
2.1 BACKGROUND ... 9
2.2 CUSTOMER CHURN PREDICTION ... 9
2.3 DATA EXPLORATION AND PRE-PROCESSING ... 11
2.3.1 Class Imbalance... 12
2.3.2 Feature Selection ... 14
2.4 MACHINE LEARNING ... 15
2.4.1 Supervised Machine Learning ... 16
2.5 MACHINE LEARNING TECHNIQUES ... 17
2.5.1 Logistic Regression ... 17
2.5.2 Random Forest... 18
2.5.3 Support Vector Machine ... 18
2.6 MODEL EVALUATION ... 20
2.7 HISTORIC CUSTOMER CHURN PREDICTION ... 20
2.8 CUSTOMER CHURN PREDICTION USING MACHINE LEARNING ... 21
2.9 APPROACHES TO SOLVE THE PROBLEM ... 22
2.10 SUMMARY,LIMITATIONS AND GAPS IN THE LITERATURE SURVEY ... 25
3. DESIGN AND METHODOLOGY ... 27
3.1 BUSINESS UNDERSTANDING ... 28
3.2 DATA UNDERSTANDING ... 29
3.3 DATA PREPARATION ... 29
3.3.1 Handling Missing Values ... 30
3.3.2 Normalizing Data ... 30 3.3.3 Feature Selection ... 31 3.3.4 Encoding ... 31 3.3.5 Data Sampling ... 32 3.4 MODELLING ... 33 3.4.1 Logistic Regression ... 33 3.4.2 Random Forest... 34
3.4.3 Support Vector Machine ... 35
3.4.4 Neural Network ... 36
3.5 EVALUATION ... 37
3.6 STRENGTHS AND LIMITATION ... 38
4. IMPLEMENTATION AND RESULTS ... 39
4.1 DATA UNDERSTANDING ... 39
4.1.1 Dataset ... 39
4.1.2 Correlation Analysis ... 47
4.1.3 Outlier Analysis ... 48
4.2 DATA PRE-PROCESSING ... 50
4.2.1 Handling Missing Values ... 50
4.2.2 Normalizing the Data ... 51
4.2.3 Feature Selection ... 51
4.2.4 Encoding ... 52
4.2.6 Data Splitting ... 54
4.3 MODELLING ... 55
4.3.1 Logistic Regression ... 55
4.3.2 Random Forest... 56
4.3.3 Support Vector Machine ... 57
4.3.4 Neural Network ... 57
4.4 RESULTS ... 59
4.5 SECONDARY RESEARCH ... 60
5. EVALUATION AND DISCUSSION ... 62
5.1 EVALUATION OF THE RESULTS ... 62
5.2 HYPOTHESIS EVALUATION ... 64
5.3 STRENGTHS OF THE RESEARCH... 64
5.4 LIMITATIONS OF THE RESEARCH ... 65
6. CONCLUSION ... 66
6.1 RESEARCH OVERVIEW ... 66
6.2 PROBLEM DEFINITION ... 67
6.3 DESIGN,EVALUATION AND RESULTS ... 67
6.4 CONTRIBUTIONS AND IMPACT ... 68
6.5 FUTURE WORK AND RECOMMENDATIONS ... 69
BIBLIOGRAPHY ... 70
APPENDIX A ... 76
TABLE OF FIGURES
Figure 1.1: Inductive Vs. Deductive Reasoning………...6
Figure 2.1: The phases of the CRISP-DM data mining model……….11
Figure 2.2: Effects of Sample methods……….12
Figure 2.3: Feature Selection Category………14
Figure 2.4: Machine Learning Techniques – Unsupervised and Supervised Learning………15
Figure 2.5: Supervised Machine Learning Model………17
Figure 2.6: Logistic Regression Formula……….17
Figure 2.7: Support Vector Machine………19
Figure 2.7: Churn Rate Prediction using Machine Learning………22
Figure 3.1: CRISP_DM Process………...27
Figure 3.2: Logistic Regression………34
Figure 3.3: Random Forest………...35
Figure 4.1: Age variable Histogram……….40
Figure 4.2: AgeAtJoining variable Histogram……….41
Figure 4.3: TotalSavings variable Histogram………..41
Figure 4.4: TotalLoans variable Histogram……….42
Figure 4.5: Closed Variable distribution………..43
Figure 4.6: Gender Variable distribution……….43
Figure 4.7: MaritalStatus Variable distribution………...44
Figure 4.8: AccomodationType Variable distribution……….45
Figure 4.9: PaymentMethod Variable distribution………..45
Figure 4.10: Dormant Variable distribution………46
Figure 4.11: Correlation heatmap of the variables………..47
Figure 4.12: Boxplot of Age variable……….49
Figure 4.13: Scatterplot of Age variable with respect to the target variable………..49
Figure 4.14: Feature Importance graph with respect to the target variable…………52
Figure 4.15: Target variable distribution………53
Figure 4.16: Confusion Matrix………...59
Figure 5.1: Accuracy Comparison graph………63
TABLE OF TABLES
Table 1.1: Qualitative Vs. Quantitative Research……….5
Table 3.1: Correlation Table………31
Table 4.1: Descriptive Statistics of Customer data………..46
Table 4.2: Correlation Matrix of the variables……….48
Table 4.3: Target Variable Counts………...53
Table 4.4: Final Dataset Description………54
Table 4.5: Logistic Regression Results for a balanced dataset………55
Table 4.6: Logistic Regression Results for imbalance dataset……….56
Table 4.7: Random Forest Results for a balanced dataset………56
Table 4.8: Random Forest Results for imbalance dataset………56
Table 4.9: Support Vector Machine Results for a balanced dataset……….57
Table 4.10: Support Vector Machine Results for imbalance dataset………...57
Table 4.11: Neural Network Results for a balanced dataset………58
Table 4.12: Neural Network Results for imbalance dataset……….58
Table 4.13: Results of Supervised Machine Learning Models………59
Table 4.14: Results of Supervised Machine Learning Models with imbalanced dataset………..60
LIST OF ACRONYMS
CU Credit Union
CRISP-DM Cross Industry Standard Process for Data Mining
BOI Bank Of Ireland
AIB Allied Irish Bank
ILCU Irish League of Credit Union
SVM Support Vector Machine
CRM Customer Relationship Management
SMOTE Synthetic Minority Oversampling technique
AUC Area Under Curve
ROC Receiver Operating Curve
ANN Artificial Neural Network
SOM Self Organizing Map
DT Decision Tree
MLP Multi Layer Perceptron
TDL Top Decile Lift
EDA Exploratory Data Analysis
RBF Radial Basis Function
RELU Rectified Linear Unit
TP True Positive
FP False Positive
TN True Negative
FN False Negative
TPR True Positive Rate
1.
INTRODUCTION
1.1 Background
A Credit Union (CU) is a non-profit organisation which exists to serve their members in Ireland since 1958. They have more than 3.6 million members in Ireland. CUs functions the same as banks, they accept deposits, provide loans at a reasonable rate of interest and offer a wide variety of financial services. A CU is a group of people connected by a ‘common bond’ based on the area they live in, the occupation, or the employer they work for, who can save together and lend to each other at a fair and reasonable rate of interest.1 There is CU present based on geographical areas. In every area, there is one CU present for its members.
CU is different from the banks (BOI, AIB, Ulster bank) in many ways –
1) CU is a not-for-profit democratic financial institute owned by its members whereas banks are profit-earning financial institutes.
2) Any surplus income is either distributed amongst members in the form of dividends or is used to develop new and existing services.
3) No hidden administration or transaction fees for the members.
4) Loans and Savings are insured at no direct cost.
5) Flexibilities are offered to the members regarding loan repayments.
6) CU is committed to their local communities and provides support to local youth initiatives, charities, sporting clubs, and cultural events.
7) Banks are ahead of CU in terms of the number of employees working. The number of employees in BOI is 11,086; in AIB 10,500 whereas in CU there are 3,500 employees.
The Irish League of Credit Union (ILCU) describes CU as “a group of people who save together and lend to each other at a fair and reasonable rate of interest”. CU offers their members the chance to have control over their finances. Regular savings form a common pool of money, which provides many benefits for members.
With advancements and competition amongst financial institutions, there is a need to retain their old customers. Customer retention is crucial in a variety of businesses as acquiring new customers is often more costly than keeping the current ones (Kaya, Dong, Suhara, Balsicoy & Bozkaya, 2018). Customer Churn has become a major problem in all industries including the banking industry and banks have always tried to track customer interaction so that they can detect the customers who are likely to leave the bank. Customer Churn modeling is mainly focusing on those customers who are likely to leave and so that they can take the necessary steps to prevent churn (Oyeniyi & Adeyemo 2015). For CUs customer churn is important as getting new members is expensive. Moreover, to join the CU the member must satisfy the common bond criteria, a common bond of either within a community (geographical), or industrial (employment).
The ILCU has an affiliated membership of 351 CUs – 259 in the Republic of Ireland and 92 in Northern Ireland. In this research, we are using the member/customer data of one of these CUs to predict customer churn.
1.2 Research Project
Supervised machine learning techniques have been used in customer churn prediction problems in the past with SVM-POLY using AdaBoost as the best overall model (Vafeiadis, Diamantaras, Chatzisavvas & Sarigiannidis, 2015). The most common techniques applied for predicting customer churn are Decision tree, Multilayer perceptron, and SVM.
In existing research of customer churn prediction problem in telecommunication industry the researcher Guo-en, X., have used SVM model as it can solve the nonlinearity, high dimension, and local minimization problems. The model prediction depends on the data structure and condition.
Techniques that are most commonly used to predict customer churn are neural networks, support vector machines and logistic regression models. Data mining research literature suggests that machine learning techniques, such as neural networks should be used for non-parametric datasets because they often outperform traditional statistical techniques such as linear and quadratic discriminant analysis approaches (Zoric, 2016).
Logistic Regression is a type of probability statistical classification model mainly used for classification problems (Nie, Rowe, Zhang, Tian & Shi, 2011). The technique can work well with a different combination of variables and can help in predicting the customer churn with higher accuracy.
Random Forest is an ensemble learning method for classification, regression problems and uses the bagging technique to generate the results. The default hyperparameters of Random Forest gives good results and it is great at avoiding overfitting (Pretorius, Bierman & Steel, 2016).
Based on the previous literature in this area and for reasons mentioned further on in this section, four supervised machine learning techniques will be compared when aiming to predict customer churn, the four techniques are logistic regression, random forest, SVM and neural network.
Currently, the customer churn is not predicted using any of the machine learning algorithm techniques for CU members’ data. The Logistic regression model is selected and in the previous research, it has been observed that SVM and random forest outperformed logistic regression when predicting customer churn.
The research question is framed as:
“Which supervised machine learning: Logistic regression, Random forest, SVM or Neural network; can best predict the customer churn of CU with the best accuracy, specificity, precision, and recall?”
1.3 Research Objectives
The key objective of the research is to identify whether the Supervised Machine Learning will help to predict the customer churn rate on CU customer data precisely. Currently, no specific method has been adopted by CU to identify the customer churn rate. This research help identify the customers which are more likely to churn and then
in turn the customers can focus more on those customers and thus can retain their old customers which leads to the growth.
The research objectives are as follows–
1) To collect the required customer data from the business for the research.
2) Understanding the data, identifying any data issues and then rectifying those to apply machine learning algorithms.
3) Preparing the data using sampling, encoding, feature selection and splitting the data.
4) Building the supervised machine learning models – Support Vector Machine, Logistic Regression, Random Forest and Neural Network to see the performance on training data set.
5) Validating the models on the Validation data set and based on evaluation metrics identifying the best model among all for predicting the customer churn.
6) Then testing the best performance model amongst all supervised models on the Test data set and then evaluating the results.
7) Identify the limitation and future research propose areas.
1.4 Research Methodologies
The Research can be classified based on different ways –
1.4.1 Based on typ e: Pri mary Vs. S econdary Res earch
Primary Research is also known as field research. The research is done in this to collect the original data that does not already exist. Secondary research is also known as desk research which involves the summary, collation and/or synthesis of existing research.
Here in this research of customer churn prediction of CU, this is a primary type of research as the research has been done to collect the original data from the financial
institute. This research is unique as no such work has been performed on the CU member dataset.
1.4.2 Based on objecti ve: Qualitati ve Vs. Qu antitati ve Res earch
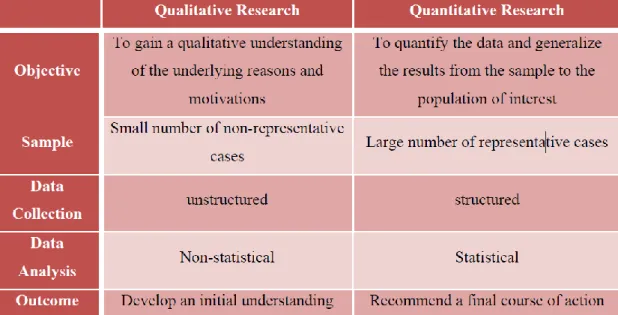
Qualitative research is the non-statistical research to gain a qualitative understanding of the underlying reasons and motivations. It usually requires a smaller but focused dataset. It describes the research broadly and develops a deeper understanding of a topic. Quantitative research means the systematic study of the research and analysing the data statistically. It deals with investigating the quantitative data and recommending a final output of the research.
Table 1.1: Qualitative Vs. Quantitative Research (Source: Malhotra, 2007)
The current research is Quantitative research which uses data mining, involves the systematic investigation of customer data and is aimed at developing models, then verifying the results and then either the hypothesis is accepted or rejected based on the customer churn precision (Borrego, Douglas & Amelink, 2013).
1.4.3 Based on form: Exp loratory Vs. Cons tructi ve Vs. Empi ri ca l
In Exploratory research, the research is being carried out for a problem that has not been clearly defined. It helps to determine the best research design, data collection method. Constructive research referred to a new contribution. A completely new
approach or new model or new theory is formulated in this research. It often involves the proper validation of the research via analytical comparison with predefined research, benchmark tests. Empirical research refers to the way of gaining knowledge through direct observation or experience. It involves the process of defining the hypothesis and then the predictions which can be tested with a suitable experiment.
This research is an empirical form of research because it involves defining the hypothesis and predicting the precision of customer churn by performing suitable experiments and then collating the results and then based on the results the hypothesis is accepted or rejected.
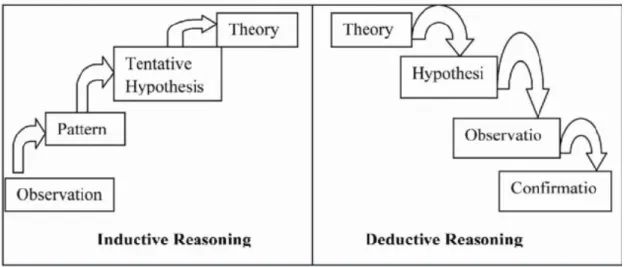
1.4.4 Based on reas onin g: Deductive Vs . In du cti v e Res earch
A deductive approach is a top-down approach which is from the more general to more specific in which based on the pre-defined theory the hypothesis is defined and then the conclusion is drawn based on the research.
In Inductive research also known as a bottom-up approach which goes from specific observation to broader generalizations of theories.
Figure : 1.1 Inductive Vs. Deductive Reasoning (Source: Aliyu, Kasim & Martin, 2011)
A Deductive reasoning is employed in this research also known as the top-down approach (Saunders, Lewis, & Thornbill, 2009) as in this research firstly based on the theory the hypothesis is created and to study them the experiments were performed,
and the Supervised Machine learning models were built on the CU customer data to predict the churned customers. Then the champion model is selected based on the accuracy of the model.
Python programming language is used for statistical exploration of data, data cleaning, data preparation, building supervised machine learning models and evaluation of those models.
1.5 Scope and Lim itations
The scope of this research is to develop a machine learning model using the CU’s customer data to predict the customer churn.
The main limitation of the research is that the customer data is obtained from one CU only so it cannot be the representative of the other CU financial institutions. The customer base would be different for different CU institutions.
The other limitation of the research is that there are so many DateTime data type variables present which are not considered for building the classifiers. Also, the data imbalance is another limitation to overcome as the churned customers were less common, so less data was provided to the classifiers to study the features of churned variables.
1.6 Document Outline
This section outlines the thesis document:
This thesis report starts with defining and explaining the research problem and providing the importance of the research problem with the methodologies adopted, exploiting the problem and purpose of the problem with the proper research question.
Chapter 2 (Literature Review) discusses the literature related to customer churn prediction. This chapter reviews and compares the previous work done in this area using supervised machine learning techniques to predict the customer churn. It describes the use of SVM, Logistic Regression, Random Forest and Neural Network in previous work, their specifications and discusses most valuable work.
Chapter 3 (Design and Methodology) describes the design and methodology adopted to solve the research problem in detail. It follows the CRISP-DM methodology and each step is carried out and explained in detail in this chapter.
Chapter 4 (Implementation and Results) presents the implementation details and the results of the implementation. It describes in detail which models are chosen and which models have performed with proper justification. The hypothesis of the research is considered, and results are compared, and the hypothesis is evaluated.
Chapter 5 (Evaluation and Discussion) discusses the evaluation criteria of the supervised machine learning models. The champion model is determined, and the results were discussed. The research problem is discussed with the results and the hypothesis is evaluated. Also, the strength and limitations of the thesis are discussed.
Chapter 6 (Conclusion) discusses the research problem with the result obtained and evaluation. It summarises the research, discusses the contribution of the research towards the research question. Also, it recommends some future research work in a similar area.
2.
LITERATURE REVIEW
This chapter provides a review of the literature available on CUs, Customer Churn prediction methods, various approaches adopted to solve the problem and evaluation metrics used for evaluating the models. The chapter concludes with the gaps in the existing research and forms the objective for the research.
2.1 Background
Customer Churn Prediction is important in all businesses because it helps to gain a better understanding of your customers and of future expected revenue. It can also help your business identify and improve upon areas where customer service is lacking. A lot of work has been done on this and still, and there are a lot of industries customer data to explore. The results differ for the data of different industries.
2.2 Customer C hurn Prediction
The term Customer Attrition refers to the customer leaving one business service to another. Customer Churn Prediction is used to identify the possible churners in advance before they leave the company. This step helps the company to plan some required retention policies to attract the likely churners and then to retain them which in turn reduces the financial loss of the company (Umayaparvathi & Iyakutti, 2012).
Customer churn is a concern for several industries, and it is particularly acute in the strongly competitive industries. Losing customers leads to financial loss because of reduced sales and leads to an increasing need for attracting new customers (Guo-en & Wei-dong, 2008).
Customer retention is crucial in a variety of businesses as acquiring new customers is often more costly than keeping the current ones. Due to the unpredictable nature of customers, it is quite a daunting task to predict whether the customer will quit the company or not. For financial institutes, it is even more complex to identify the
customer churn due to the sparsity of the data as compared to another domain. This requires longer investigation periods for churn prediction (Kaya, et.al., 2018).
The economic value of customer retention is widely recognized (Poel & Lariviere, 2004):
(1) Successful customer retention allows organizations to focus more on the needs of their existing customers instead of seeking new and potentially risky ones.
(2) Long term customers would be more beneficial and, if satisfied, may provide new referrals.
(3) Long term customers tend to be less sensitive towards a competitive market.
(4) Long term customers become less expensive to serve due to the bank’s knowledge
(5) Losing customers leads to reduced sales, and increased sales to attract new customers.
Customer Churn has become a major problem in all industries including the banking industry and banks have always tried to track customer interaction so that they can detect the customers who are likely to leave the bank. Customer Churn modeling is mainly focusing on those customers who are likely to leave and so that they can take steps to prevent churn (Oyeniyi & Adeyemo, 2015).
In an era of the competitive world, more and more companies do realize that their most precious asset is the existing customer base and their data. We mainly investigate the predictors of churn incidence as part of customer relationship management (CRM). Churn Management is an important task to retain valuable customers.
Business organizations, such as banks, insurance companies, and other service providers are changing their employees to be more customer-and service oriented and they are setting strategies to ensure customer retention (Nashwan & Hassan, 2017). The best core marketing strategy for the future is to retain existing customers and avoiding customer churn (Kim, Park & Jeong, 2004)
Previous research indicates that there were two types of targeted approaches to managing customer churn: reactive and proactive. In a reactive approach, the company
waits until the customer asks to cancel their service. In a proactive approach, the company tries to identify customers who are likely to churn. The company then tries to retain those customers by providing incentives. If churn predictions are inaccurate then companies will waste their money on customer churn so the customer churn should be accurate (Tsai & Lu, 2009).
2.3 Data Exploration and Pre-processing
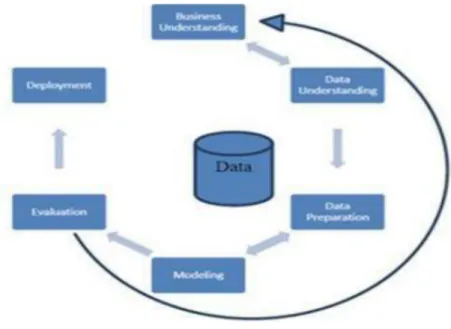
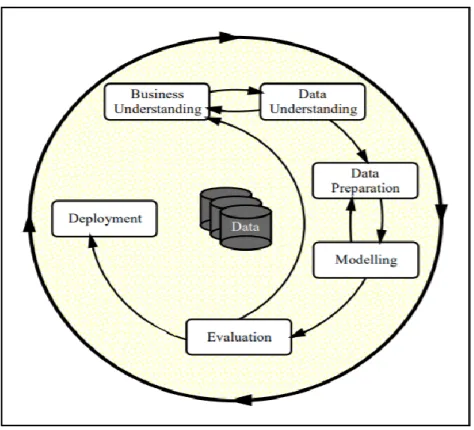
Data Exploration is required to gain further understanding of the data and business problem. The CRISP-DM methodology is widely accepted for the Data mining model. It is mainly for conducting a data mining process, whose life cycle consists of six phases as shown in the below figure.
Figure 2.1: The phases of the CRISP-DM data mining model2
The most important stage of Data Analysis is the Data Preparation. In general, the data cleaning and pre-processing take approximately 80% of the time. The data preparation is more challenging and time-consuming part.
The Real-world data can be noisy, incomplete and inconsistent. The data preparation stage deals with – incomplete data where some attribute values were missing, where certain important attributes were missing. In the data preparation stage the outliers and errors in data were also handled, even the data discrepancies were handled in the data preparation. Data preparation generates a smaller dataset than the original one. This
task includes selecting relevant data, attribute selection, removing anomalies, eliminating duplicate records. This stage also deals with filling the missing values, reducing ambiguity and removing outliers (Zhang, Zhang & Yang, 2003).
This stage is of high importance due to the following: (1) the real data is impure;
(2) high-performance mining requires quality data; (3) quality data yields high-quality patterns
2.3.1 Clas s Imbalan ce
As seen in research by Guo-en & Wei-dong (2008) class imbalance has become a common problem within datasets in data mining. This is a common problem in customer churn prediction area. In such a problem, almost all examples are labelled as the not churned class, while fewer examples are labelled as a churned class, the most important class.
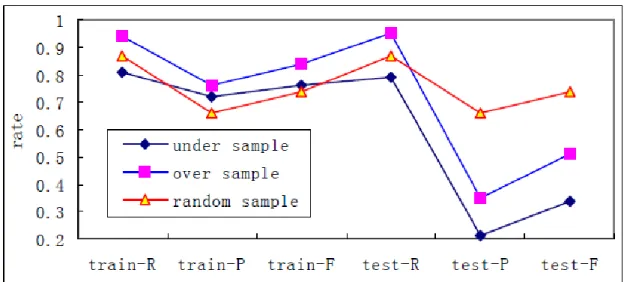
One remedy to deal with the problem of class imbalance was using Under-Sampling, Random Sampling and Over-Sampling suggested by Bin, Peiji & Juan (2007). In their study on Customer Churn Prediction on Personal Handyphone System Service, the proportion of nonchurn and churn was set as 5:1. Models were trained using three different sample methods and better performance was observed using a random sampling method. The below figure depicted the performance.
Figure 2.2: Effects of Sample methods (Source: Bin, Peiji & Juan, 2007)
From the above figure, it was concluded that random sampling yielded the best results for a Decision Tree model.
It has been observed in the previous research by Maheshwari, Jain & Jadon (2017) detailed description of various approaches was discussed to handle class imbalance. The various approaches for handling class imbalance were – Data Level approach, Algorithm Level approach and Cost-sensitive approach. In the data level approach, various methods were – Under sampling, oversampling and hybrid sampling. The under-sampling leads to losing potentially useful data while oversampling leads to overfitting and increases learning process time if data is large. Another data level approach for handling class imbalance was to use SMOTE technique which yielded better accuracy as compared to other methods. Algorithm level approach for handling class imbalance are – bagging and boosting methods. For bagging method, the algorithms were Decision tree (C4.5) and Random forest, for boosting method AdaBoost and SMOTEBOOST algorithms were used. Bagging algorithms may lead to overfitting and boosting ignores the overall performance of the classifier. The cost-sensitive method incorporates both data and algorithm level approach. As per the research, it was evaluated that the Data Level approaches were the best approach to handle the class imbalance.
In research by Kaya, et. al. (2018) it was observed that the SMOTE technique yielded the best results for SVM in predicting customer churn. SMOTE generates minority classes by interpolating instead of replication and avoided over-fitting problem hence provided better results.
Imbalance problem can be solved at the algorithm level also. Cost-Sensitive Learning is a type of learning that considered misclassification costs. A cost-sensitive learner assigned a greater cost to the false negatives compared to the false positives. However, it was not a very feasible approach, as the cost information was dependent on many other factors (Ganganwar, 2012). Another algorithm-based approach was one class learning which follows the separate-and-conquer approach in which the classifier was modelled only on minority class. This approach was useful for highly unbalanced data sets composed of a high dimensional noisy feature space (Kotsiantis, Kanellopoulos, & Pintelas, 2006).
2.3.2 Featu re S election
Feature Selection is the process of identifying the fields which are the best for prediction as a critical process (Hadden, Tiwari, Roy & Ruta, 2005). This step is important in customer churn prediction. Feature selection is a process of selecting a subset of original features is an important and frequently used dimensionality reduction technique for data mining.
In one of the researches done by Khan, Manoj, Singh & Bluemenstock (2015) t-test was performed separately for each feature, which indicated the extent to which a single feature can accurately differentiate between people who have churned or not. A Tree-based method was used for feature selection. This method was useful in producing a list of correlated predictors.
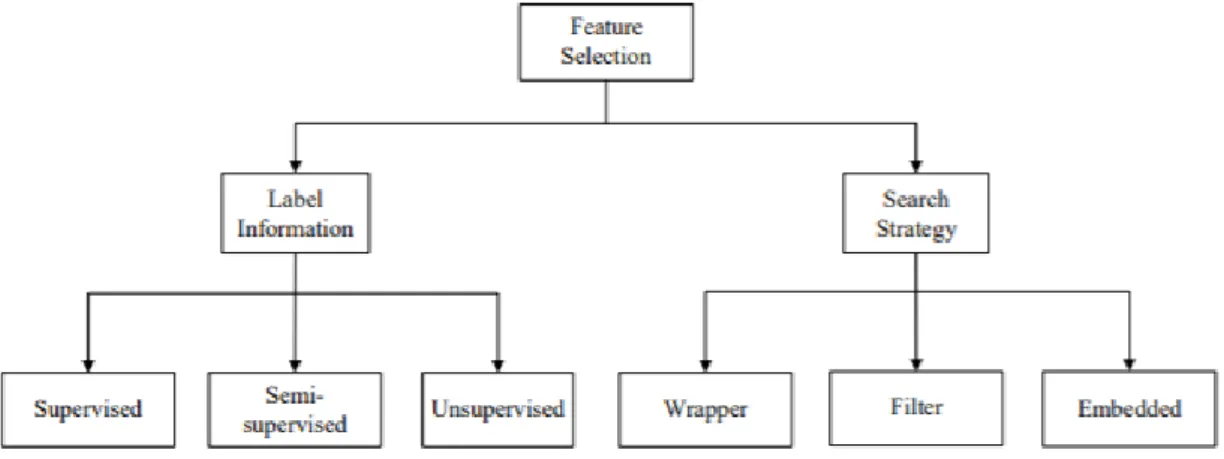
The feature selection was categorized into two categories based on Label Information and Search Strategy. The below diagram will detail the division.
Figure 2.3: Feature Selection Category (Source: Miao & Niu, 2016)
The training data can be labelled, unlabelled or partial labelled which leads to the development of Supervised, Unsupervised and Semi-Supervised feature selection algorithms. Supervised feature selection determined the feature relevance by evaluating the feature’s correlation. Unsupervised feature selection exploited data variance and separability to evaluate feature relevance. Semi-supervised feature selection algorithm used both labelled and semi-labelled data and improved the feature selection of unlabelled data. Based on search strategy three categories of feature selection are filter, wrapper and embedded models. The filter model evaluated features without involving any learning algorithm which relies on the general characteristics of data. The wrapper model required a predetermined learning algorithm and used its
performance as an evaluation criterion to select features. Algorithms with an embedded model, e.g., C4.5 and LARS, were the examples of wrapper models which incorporate variable selection as a part of the training process, and feature relevance was obtained analytically from the objective of the learning model (Miao & Niu, 2016).
According to researchers Cai, Luo, Wang & Yang (2018) Supervised feature selection for classification problem using the correlation between the feature and the class label as its fundamental principle. The correlation between the features were determined and compared to the threshold to decide if a feature was redundant or not. This method was an optimal feature selection method which maximized the classifiers accuracy.
2.4 Machine Learning
Machine Learning is a method of data analysis which assists in analytical model building. It is a branch of Artificial Intelligence (AI). The machine learning models learn from the data, identify general patterns in it and construct decision with minimal human intervention.
Machine Learning is mainly used when we have a complex problem or task involving a huge amount of data. It is a good option for more complex data and deliver faster, more accurate results. It helps an organization of identifying profitable opportunities or any unknown risks (Sayed, Fattah & Kholief, 2018).
Machine learning mainly uses two types of learning techniques: 1) Supervised Machine Learning
Figure 2.4: Machine Learning Techniques – Unsupervised and Supervised Learning3
2.4.1 Supervis ed Mac hin e Learnin g
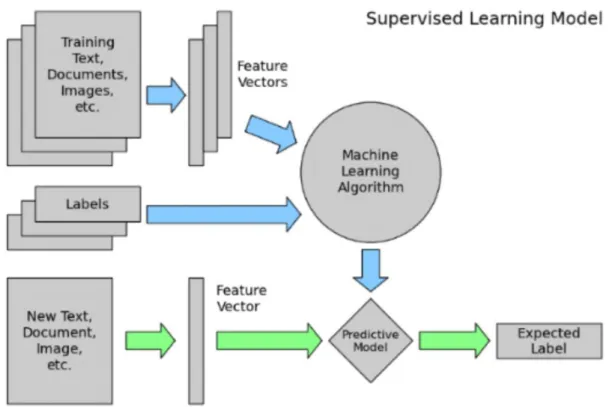
Supervised Machine Learning is the computational task of learning correlations between variables in training dataset and then utilising this information for creating a predictive model capable of inferring annotations for new data (Fabris, Magalhaes & Freitas, 2017). In Supervised Machine learning, we have an input variable (X) and an output variable (Y) and we use an algorithm to learn the mapping from the input to the output.
Y = f(X)
The goal is to approximate the mapping function so well that when the new input data (X) is introduced the model predicts the output variable (Y) for that data.
The learning is called as Supervised learning when instances are given with known labels. The features can be continuous, categorical or binary (Kotsiantis, Kanellopoulos & Pintelas, 2006).
The supervised learning problems can be grouped into regression and classification –
1) Classification – When the output variable is categorical, such as “red” or “blue” and “yes” or “no” then it is considered as Classification problems.
2) Regression – When the output variable is a real value, then such problems are considered as Regression problems.
Figure 2.5: Supervised Machine Learning Model (Source: Vladimir, 2017)
2.5 Machine Learning Techniqu es
Several machine learning techniques have previously been used in similar customer churn prediction problems.
2.5.1 Logis ti c Regress ion
Logistic Regression was very widely used statistical model used for Customer Churn and has been proven a powerful algorithm.
The formula in figure 7 below represents logistic regression where 𝑝𝑖 is the probability and 𝑥𝑖 is the independent variables which predicted the outcome 𝑝𝑖.
(Source: Nie, 2011)
In a study on churn prediction of credit card in China’s banking industry Logistic Regression and Decision Tree model were built. It was observed that Logistic Regression has performed better than Decision Tree (Nie, 2011). There were 135 variables and, in this research, instead of selecting all 135 variables certain variables were selected and models were built based on correlation and in the study, it has been observed that Logistic Regression model has performed better than Decision tree algorithm.
Researchers have implemented the binary and ordinal logistic regression models for customer churn prediction using SAS 9.2 with the Logistic regression procedure and Cox regression models (Ali & Ariturk, 2014).
In another study of comparison of models performed on predicting Customer Churn on Telecom dataset, it was observed that the Logistic Regression model has outperformed Decision Tree. Logistic Regression uses maximum likelihood estimation for transforming the dependent variable into a logistic variable. The proposed system provided a statistical survival analysis tool to predict customer churn. The confusion matrix was used for evaluation purpose (Khandge, Deomore, Bankar & Kanade, 2016).
2.5.2 Random Forest
Random Forest is an ensemble learning method model for a classification or regression problem. A decision tree is the building block of random forest. The multitude of decision tree makes the random forest and the output is the mode of the class in classification and mean prediction for the regression problem. Random Forest will not overfit if enough number of trees are there in the classifier. It can handle missing values and is suitable for categorical variables also.
In one of the previous researches on financial customer churn, the researchers have used Random forest classification technique (Kaya, et. al., 2018).
2.5.3 Support Vector Machine
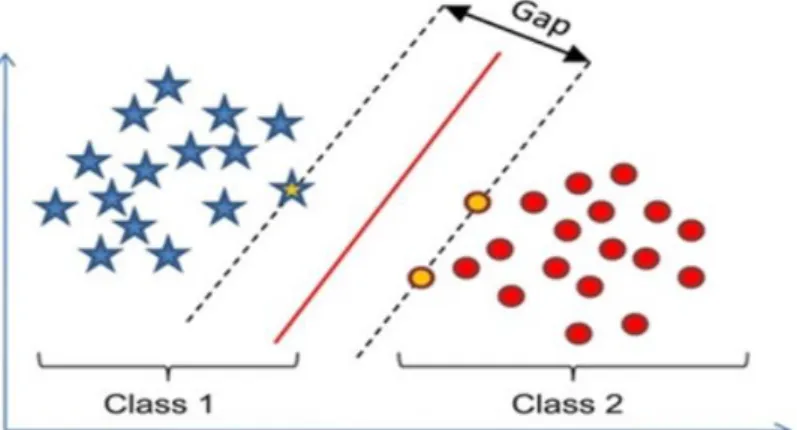
Support Vector Machine model is a supervised machine learning model which can be used for classification as well as regression problems. SVM is mostly used in a
classification problem as it can separate two classes using a hyperplane. The objective of SVM is to find a hyperplane that can distinctly classify the data. Hyperplanes are decision boundaries that help classify the data points. Support Vectors are data points that are closer to hyperplane and influence the position and orientation of the hyperplane.
Figure 2.7: Support Vector Machine (Source: Ali, 2018)
Several researchers have implemented mainly two methods for customer churn prediction. The first method was the traditional classification method using supervised learning mainly for quantitative data and the other was artificial intelligence method for large scale, high dimensionality, nonlinearity and time-series data (Guo-en & Wei-dong, 2008). In existing research of customer churn prediction problem in telecommunication industry the researcher Guo-en, X., have used SVM model as it can solve the nonlinearity, high dimension, and local minimization problems. The model prediction depended on the data structure and condition.
2.5.4 Neu ral Network
Neural Networks are a set of algorithms, that are designed to recognize patterns. The basic building blocks of neural network is neurons. The output depends on the activation function of the neuron.
The researcher Zoric, 2016 have used neural network model within the software package Alyuda NeuroInteligence for his research on customer churn prediction in Banking industry because neural network worked well for pattern recognition, image processing, optimization problems etc.
Another group of researchers Huang, Kechadi, Buckley, Keirnan, Keogh & Rashid, 2010 have proposed the comparison between the popular modelling technique – Multilayer Perceptron Neural Networks and Decision Tree with the innovative modelling technique – SVM (Huang, et.al. 2010) for customer churn prediction in the telecom industry. MLP and SVM were more efficient than Decision Tree.
2.6 Model Evaluation
According to researchers, the evaluation strategies were of two types – filter and wrapper. In wrapper evaluation method, evaluation was performed on a subset of features using a learning algorithm whereas in filter evaluation, the evaluation was done on a subset features external to the classification design (Hadden, Tiwari, Roy & Ruta, 2005).
Customer churn prediction problem is a classification problem and to evaluate the performances of the supervised machine learning models, precision, recall, accuracy and F-measure were calculated using Confusion Matrix (Vafeiadis, Diamantaras, Sarigiannidis & Chatzisavvas, 2015).
Apart from confusion matrix, many researchers have used the AUC (Area Under Curve) also for evaluation of the model. The AUC is the area under the Receiver Operating Curve (ROC) curve. ROC is a plot between true positive rate versus false positive rate. Another evaluation metrics was TDL (top-decile lift) which focuses on the customer most likely to churn (Ali & Ariturk, 2014)
2.7 Historic Custom er Churn Prediction
In any organisation, the Customer Relationship Management is a prominent field in the business analysis field. It deals with retaining existing customers, then identifying, expanding and attracting the potential customers. CRM has two aspects one is the technical aspect and the other is the operational aspect. The technical aspect of the CRM also known as Customer Analytics (Senanayake, Muthugama, Mendis & Madushanka, 2015). Customer Analytics can be broken into two categories:
(2) Predictive Analytics – In this, the retention of customers was focused.
The Predictive Analytics is the customer churn analysis which mainly focuses on retaining the customers.
According to the researchers Senanayake, Muthugama, Mendis, & Madushanka, (2015) the typical approach of identifying the customer without machine learning was to analyse the data of those customers who have already churned and identifying customer attrition from the existing customers based on observation and customer behaviour.
2.8 Customer Churn Prediction using Machine Learni ng
Now as the time passes the data increases and due to the volume of data is immense it becomes a daunting task for the data analysts to analyse such huge data. So, then the customer churn prediction using machine learning and data mining techniques played a significant role.
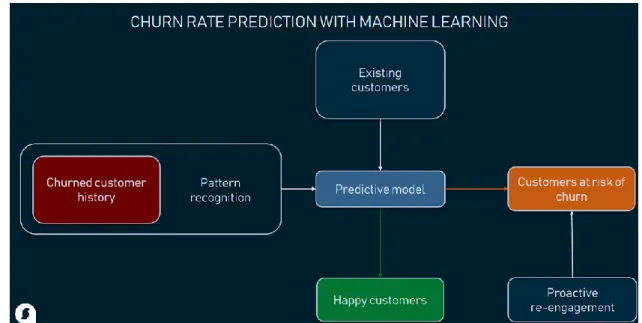
Customer churn prediction using machine learning models follow a set of steps. The data is collected, next, the selected data was pre-processed and transformed into a suitable form for building a machine learning model. After modelling the testing was performed and then finally the model was deployed (Kim, Shin & Park, 2005). The machine learning investigated the data and detects the underlying data patterns for the customer churn analysis (Kim, Shin & Park, 2005). Using machine learning the prediction of customer churn was more accurate than the traditional approach.
Figure 2.7: Churn Rate Prediction using Machine Learning (Source: Beker, 2019)
Several features were involved as variables in customer churn analysis. The various category of variables was customer variables of recency, frequency and monetary value (RFM), demographic features like the geographical details, cultural information and age (Senanayake, Muthugama, Mendis & Madushanka, 2015).
2.9 Approaches to solve the problem
Many researchers have worked on the prediction of customer churn. Most of the research was based on applying machine learning algorithms on customer data and predicting the customer churn rate. A few of the studies are discussed in this section.
Researchers Guo-en, & Wei-dong, (2008) have applied the machine learning method SVM on structural risk minimization to predict the customer churn on telecom industry customer data set. They have analysed the results of the SVM model with an artificial neural network, decision tree, logistic regression, and naïve Bayesian classifiers. In the experiment it was found that the SVM has outperformed with best accuracy rate, hit rate, covering rate and lift coefficient. There were two datasets used in the research and for SVM model the kernel function was selected using MATLAB 6.5. For the first dataset the SVM has acquired good results using kernel function as radial basis function and for the other dataset Cauchy kernel function was used. The SVM model
accuracy was calculated as 90% and 59% for dataset 1 and dataset 2 respectively. Decision Tree C4.5 had the least performance for both the datasets with accuracy as 83% and 52% respectively.
Another study on European financial bank customer data was conducted by Poel & Lariviere, (2004) using the Cox proportional hazard method to investigate customer attrition. The focus was on churn incidence. The SAS enterprise miner was used in this research. They performed the research by combining several different types of predictors into one comprehensive proportional hazard model. By analysing this bank customer dataset two critical customer churn periods were identified – firstly the early years after becoming the customer and a second period is after some 20 years. Demographic and environmental changes were of major concern and have a great impact on customer retention. In this research, four retention predictor categories were used it would have been more advantageous if the data obtained were merged and would have incorporated in a single retention model instead of four different models.
Hybrid neural networks were built, and the performance was compared with the baseline ANN model by the researchers Tsai & Lu (2009). The customer churn was predicted on the American telecom company data. In this research, they have built one baseline ANN model and two hybrid models by combining the clustering and classification methods to improve the performance of the single clustering or classification techniques. It comprised of two learning stages, the first one, was used for pre-processing the data and the second one for the final output prediction. The two hybrid models built were ANN+ANN (Artificial Neural Network) and SOM (Self Organizing Maps) +ANN. These models were evaluated based on the Type I and Type II error rates and the accuracy of the models. In statistical hypothesis testing a type I error was the rejection of a true null hypothesis, while type II error was the non-rejection of a false null hypothesis. The actual results showed that the ANN+ANN model performed better than both the ANN and SOM+ANN models in terms of Type I error rates. Also, the prediction accuracy for ANN+ANN hybrid model was better than that of ANN and SOM+ANN models. Thus, in this research paper hybrid techniques were performed. The hybrid model with two ANN has performed better when compared to SOM+ANN hybrid model. Feature selection was not considered in this research.
In one of the research papers on customer churn in the financial industry by researchers (Kaya, et. al., 2018) they have emphasized more impact on Spatio-temporal features. They have adopted Random Forest as the classification model for their study and trained the model with 500 trees and maximum of 2 features per tree. Stratified 8-fold cross-validation was adopted for evaluation. In this research, Spatio-temporal and choice features were found more superior than demographic features in financial churn decision prediction. In this research, it was observed that young people were more likely to leave the bank. The results of this research suggested that based on mobility, temporal and choice entropy patterns which can be extracted from customer behaviour data we can predict the customer churn rate. The evaluation was performed using AUC ROC evaluation metrics.
Researchers Oyeniyi & Adeyemo (2015) have predicted the customer churn problem on one of the Nigerian bank datasets and they have used WEKA tool for knowledge analysis. K-means clustering algorithm was used for clustering phase followed by a JRip algorithm rule generation phase.
Customer Churn prediction was performed on Personal Handy Phone System Service by researchers Bin, Peiji & Juan, (2007). They have built a Decision tree and three experiments were conducted to build an effective and accurate customer churn model. In this research 180 days data was randomly sampled and utilized in the research for churn prediction. In the first experiment sub-periods for training data sets were changed, in the second experiment, the misclassification cost was changed in churn model and then in the third experiment being conducted sample methods were changed in the training data sets. In this study in first experiment, the number of sub-periods were considered as 18, 9, 6 and 3 which means the 180 days call record data is divided into 18, 9, 6 and 3 parts. In second experiment, the misclassification cost means setting the proportion of nonchurn and churn customers in training dataset. In third experiment, various sampling techniques were adopted to balance the dataset. This research helped in churn prediction and in improving the performance of churn prediction models. In this study, it has been observed that the performance of the model was superior when sub-period was set as 18. In the case of misclassification cost when it was set as 1:2, 1:3 and 1:5 the result was superior and finally in case of sample method random sample method has yielded the best results in the research.
A comparative study on customer churn prediction was performed by Vafeiadis, et.al. (2016) on telecom data set. The performance comparison of multi-layer perceptron, Decision Tree, SVM, Naïve Bayes and Logistic regression were compared. All the models were built and evaluated using cross-validation. Monte Carlo simulations were used and SVM has outperformed other models with an accuracy of 97% and F-measure of 84%.
In one of the previous researches, on Customer churn prediction, the researchers have used the traditional method supervised machine learning algorithms – Decision Tree, Regression Analysis for prediction and also the Soft Computing methodologies such as fuzzy logic, neural networks and genetic algorithms (Hadden, Tiwari, Roy & Ruta, 2005).
Sharma & Panigrahi (2011) have performed the customer churn prediction on telecom dataset using Neural Network. The neural network has yielded better result with accuracy of 92%. The researcher has focused on changing the number of neurons and increasing the hidden layers in the neural network model. Feature selection and class imbalance problem were not considered in the research.
In one of the comparison research paper by Xie, Li, Ngai & Ying (2009) it has been observed that balanced Random Forest has outperformed the other classifiers ANN, SVM and DT based on precision and recall.
2.10 Summary, Limitations and Gaps in the Literature Survey
A detailed study of state-of-the-art approaches in predicting customer churn has been performed for this research. It has been observed that there is a need to focus more on data pre-processing stage. Most of the research has not handled the feature selection and class imbalance problem.
Most of the research (Xie, et.al., 2009, Sharma, 2011, Vafeiadis, et.al., 2016) were performed on telecom customer dataset and few research (Oyeniyi & Adeyemo, 2015), Kaya, et. al., 2018) were performed on financial dataset. Customer churn prediction on Personal Handy Phone System Service by researchers Bin, Peiji & Juan, L. (2007) was performed. No research has been focused on the customer churn prediction on CU financial institute.
Currently, the vital and active areas of research in Customer Churn prediction was using feature selection for data mining purposes (Guo-en & Wei-dong, 2008). Also, while implementing SVM how to select fitting kernel function and parameter, how to weigh customer samples (Guo-en & Wei-dong, 2008). For further research, it would be a challenge to incorporate customer behaviour, customer perceptions, customer demographics and macroenvironment into one comprehensive retention model (Poel & Lariviere, 2004). More focus should be emphasized on the pre-processing stage for better performance, the dimensionality reduction or feature selection. Also, other domain data sets for churn prediction can be used for further comparisons (Tsai & Lu, 2009). Research should be aligned towards improving the predictive ability of churn model by using other data mining techniques, for example, neural net, logistic regression, self-organizing map, support vector machine and so on (Bin, Peiji & Juan, 2007).
Most of the studies were done using archived data. In the existing research not, much guidance was provided on how to analyse the real-world application dataset. To address the limitations and research gaps presented in this section, the research was focused on covering the data pre-processing steps of feature selection by using correlation technique and extra tree classifier method, handling class imbalance using SMOTE technique. Further, secondary research was also conducted focusing on a comparative study on churn prediction of Banking domain dataset (Kumar & Vadlamani, 2008) with the current research prediction results.
3.
DESIGN AND METHODOLOGY
In this chapter, the design of the research and the methodology will be explained in detail to answer the research question. The experiment design followed the CRISP-DM process in the research lifecycle. Python programming was used to carry out the experiments of the research.
This research aimed at building and comparing the supervised machine learning techniques using a CU customer dataset to predict the customer churn rate. The Logistic Regression, Random Forest, SVM and Neural Network supervised machine learning models were built, and the results were compared. The secondary research focused on a comparative study of research results with the existing research paper results on banking domain (Kumar & Vadlamani, 2008).
The overall workflow of the research is as shown below.
Figure 3.1: CRISP_DM Process (Source: Wirth & Hipp, 2000)
The thesis followed the CRISP-DM methodology, and each of the phases are described in detail below.
3.1 Business Understanding
This is the initial phase of CRISP-DM and focuses on understanding the business problem. In this phase, the problem was studied based on a business perspective. The business in this research was CU financial institution which have 3.6 million members throughout Ireland and here in this research 96968 members data were taken into consideration for the study for a single CU for the years 1911 – 2019.
CUs are not-for-profit, member-owned, financial cooperatives, whose earnings are paid back to members in the form of higher savings rate and lower loan rates. Members of CU are both customers and owners. Banks, on the other hand, are primarily to generate profit that returns to its owner.
Machine learning is not currently used in CUs for customer churn prediction.
In this research the main aim was to identify the members which were more likely to close their membership and to identify this, the supervised machine learning models (Logistic Regression, Random Forest, Support Vector Machine and Neural Network) were built and the results were compared and based on accuracy, precision metrics the best model was selected. This research will be helpful for the CU to identify the members who are likely to close their membership and then they can focus on those members to retain them. They can communicate with those customers and can understand their needs and in turn, can reduce the customer churn which in turn leads to the growth of the institute.
The thesis of this research is to demonstrate the following hypothesis:
H0: A random forest supervised model build using the CU customer data, will not achieve high accuracy than the other supervised machine learning algorithms like Logistic Regression, Support Vector Machine and Neural Network, to predict the customer churn.
HA: A random forest supervised model build using the CU customer data, will achieve high accuracy than the other supervised machine learning algorithms like Logistic Regression, Support Vector Machine and Neural Network, to predict the customer churn.
3.2 Data Understanding
The Data Understanding phase deals with the collection of data and data exploration to get basic insight into the type of data. Some understanding of data was gained in this phase.
The dataset used in this research was the customer data of the financial institute called CU. The dataset was completely original, and no statistical research has been done on this dataset. It consists of the data of all customers who have joined the CU from 1911 to 2019. The dataset has 96967 records of distinct members with 48 features. The customer churn was defined as the total number of customers who have closed their accounts. In this research, the customers who are not deceased and whose accounts were either closed or dormant were considered as churned from CU.
The data was loaded using the pandas library of python. The number of records were explored, using the info() function the datatype of each independent variables were identified.
The basic quantitative analysis of the data was carried out. The measures of central tendency, range, standard deviation, mean, max, min of the variables was measured here using Descriptive Statistics. Also, the skew and kurtosis of the variables were measured to check the normality of the variables. Exploratory Data Analysis (EDA) was performed. The data visualisation was performed using matplotlib and seaborn python libraries and histogram, box-plot was created to view the data distribution for checking the normality and to identify the outliers in the variables.
The correlation matrix was built using the Spearman method to identify the correlation between the dependent and independent variables and to identify the correlation between dependent variables to avoid multicollinearity.
3.3 Data Preparati on
In the data preparation phase, all activities were performed to convert the raw data into the final dataset which we can feed into the modelling algorithms and build models. Various tasks like data cleaning, removing outliers, imputing missing values,
construction of new attributes, feature selection and transformation of data all tasks were performed in this phase.
3.3.1 Handling Mis sing Values
It is very important to handle missing values as many machine learning algorithms do not support data with missing values.
The given dataset comprised of many missing values. This may be caused due to a number of various factors. One of the reasons may be that the data was not collected. Variables with more than 60% of values missing can be removed from the final dataset (Kelleher, Mac Namee, & D’Arcy,2015).
For continuous variables which can take any values between its minimum and maximum values, with missing values from 2% till 30% the values were imputed by mean values. Mean is a reasonable estimate for randomly selected observations from a normal distribution. Missing values may be caused by several different factors. Missing data generated various problems. Missing data reduced the statistical power which can lead to the wrong evaluation of the hypothesis. It could also reduce the representativeness of the sample. It could complicate the analysis of data. Few algorithms do not work with missing data. The missing values in categorical variables which contain labels were imputed using the maximum likelihood and last observation carried forward techniques were the most common techniques for imputing the missing values (Kang, 2013). In maximum likelihood the missing values were imputed with the values which occurred most of the time. In the last observation carried forward technique the previous observation was imputed in the missing value.
3.3.2 Normali zi ng Data
Normalization is a technique applied as a part of data pre-processing for building machine learning models. The goal of normalization is to change the values to a common scale. The skew and kurtosis were measured for each numerical column and if the skew and kurtosis values were outside the range of +/-2 then the variable was said to be skewed data. Also, the histogram can be used to depict the normal distribution of the data.
3.3.3 Fea tu re S election
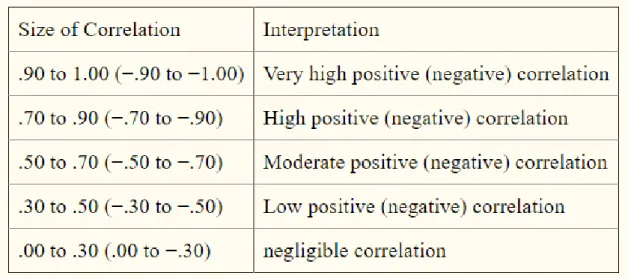
Feature selection is applied to the dataset as there is a large number of dependent variables in the given dataset. The feature selection is used to find relevant features for the model construction. The Correlation Matrix with heatmap method was used to do the feature selection in this research. A correlation was determined between the dependent and independent variables and between the dependent variables. Correlation was a measure of how strongly one variable depends on another. If the correlation goes beyond the threshold of correlation greater than 0.5 the variables will not be considered as it will affect the model accuracy (Mukaka, 2012). The size of correlation with interpretation is displayed in the below table.
Table 3.1: Correlation Table (Source: Mukaka, 2012)
Feature selection improves the accuracy of the model. It trains the model faster and reduced the complexity of the model. Another method Tree based classifier was also implemented to find the most predicting features for feature selection based on a literature review. It is an ensemble learning method and used to predict the best features in predicting target.
3.3.4 Encoding
The dataset contains continuous and categorical variables. There are few machine learning algorithms like SVM and Logistic Regression which accepts only numeric data. For this reason, the categorical data is converted into 0 and 1 using label
encoding. In this dataset a total of 21 variables were categorical variables with True and False values or some nominal values. These values were transformed into numerical using sklearn’s4 LabelEncoder function.
3.3.5 Da ta Samplin g
In many real-world application class imbalances is the most common data issue. In such problems, most of the examples are labelled as one class, while fewer examples are labelled as the other class, usually the important ones. This problem is known as a class imbalance. Class imbalance problem exists in lots of application domains (Guo, 2016).
Before undertaking an experiment, a decision must be made on class imbalance problem as the minority class was of prime importance in this research. Here in this research, the class imbalance ratio of approximately 18:5 was found which means against 18 non churned customers 5 will be churned. The non-churned members were 75% of total members whereas the churned members were 25% of the total CU members.
The course of action can be taken in the data pre-processing phase of the project was either the random undersampling or random oversampling which were the data level methods to handle class imbalance problem. As observed in the previous research by Maheshwari, Jain & Jadon (2017) both the undersampling and oversampling have advantages as well as disadvantages. Oversampling can lead to overfitting and lead to more computation work for large datasets whereas undersampling can lead to the removal of some significant data records. Here in this research, SMOTE technique was used to handle class imbalance problem.
3.3.5.1SMOTE Technique
SMOTE (Synthetic Minority Over-sampling Technique) generates synthetic samples from the minority class. It was used to balance the training dataset synthetically which was then used to train the classifier. It created synthetic samples from the minor class instead of creating copies of data from minority class. It selected the similar records