The Use of Centralized System in
Biomass Supply Chain
Focus on Sweden & Germany
Ifeanyichukwu Chidiebele Ejiofor
Bachelor’s Thesis
December 2015
School of technology, communication and transport
Degree Programme in Logistics Engineering
Author(s)
Ejiofor, Ifeanyichukwu Chidiebele
Type of publication
Bachelor’s thesis Date 11.12.2015
Language of publica-tion:
English
Number of pages
73 Permission for web publication: Yes
Title of publication
The Use of Centralized System in Biomass Supply Chain A Focus on Sweden & Germany
Degree programme
Logistics Engineering
Supervisor(s)
Lähdevaara, Hannu
Assigned by
Bio Institute, JAMK University of Applied Sciences
Abstract
This research topic was assigned by the Biopooli project team of the Bio-instutute - Jyvaskyla University of Applied Sciences. The project team is tasked with designing and developing processes for a new biomass ter-minal specifically to handle wood chips for energy generation, which would be built in Central Finland.
The task and primary objective of this research was to gather infor-mation on the latest and efficient processes involved when using a cen-tralized system in biomass supply chain. The chosen geographical area for this study was Sweden and Germany. Wood chips supply chain activi-ties like raw material harvesting, transportation, communition processes, storing, drying and other terminal operations amongst others was looked into.
This study was conducted using the desktop research method. Sources of information for the research were academic publications, official gov-ernment agency publications, and other academic research journals of interest. The theoretical framework of this study also involved a strong background in supply chain management, and as such, textbooks were also used.
The results obtained in this study found out that there were a lot of simi-larities of forest wood chip supply chain practices in Sweden and Finland. Available Swedish literature also gave useful insight on general trends of centralized systems in the country of Sweden. For Germany, results mainly showed the effectiveness of their technology as regards to har-vesting, drying and their storing processes.
This report drew conclusions from the pros and cons of gathered infor-mation and made useful recommendations to the Biopooli project team.
Keywords/tags (subjects)
Biomass, Supply chain, wood chips, transportation, harvesting, storage, comminution Miscellaneous
Contents
1 INTRODUCTION ... 7
1.1 BACKGROUND OF THE RESEARCH... 8
1.2 RESEARCH OBJECTIVES AND FOCUS ... 9
1.3 METHOD OF RESEARCH ... 9
2 THEORETICAL BASIS ... 10
2.1 SUPPLY CHAIN MANAGEMENT (SCM) ... 10
2.1.1 Drivers Of Supply Chain Management ... 12
2.1.2 Network Design And Planning In Supply Chain ... 14
2.1.3 Centralized Storage System ... 17
2.1.4 Supply Chain Analysis ... 19
2.2 BIOMASS ... 20
2.2.1 Sources And Types of Biomass ... 21
2.2.2 Biomass Availability ... 22
2.3 WOOD CHIPS ... 23
2.3.1 Quality of Wood Chips ... 24
2.3.2 Supply Chain of Wood Chips ... 25
2.3.3 Handling of Wood Chips ... 28
2.3.4 Storage of Wood Chips ... 30
3 RESEARCH ... 31
3.1 SWEDEN ... 31
3.1.1 Harvesting of Forest Woody Biomass In Sweden ... 33
3.1.2 Transportation Of Biomass In Sweden ... 37
3.1.3 Geographical Locations Of Biomass Terminals In Sweden 42 3.1.4 Size Of Swedish Forest Biomass Terminals ... 44
3.1.5 Raw Materials/Assortments Handled In Swedish
Terminals ... 45
3.1.6 Inventory Practices And Equipment In Swedish Terminals 46 3.1.7 Storage Of Woody Biomass In Swedish Terminals ... 48
3.2 GERMANY ... 50
3.2.1 Harvesting Of Biomass In Germany ... 52
3.2.2 Drying And Storage Of Wood Chips In Germany ... 54
4 DISCUSSION & CONCLUSION ... 56
4.1 LIMITATIONS AND BENEFITS OF THIS STUDY ... 56
4.2 COMMENTS ... 57
4.3 RECOMMENDATIONS ... 60
REFERENCES ... 62
Abbreviations
a - Annum
CEN - Comité Européen de Normalisation (European Committee for Standardization)
CHP – Combined heat and power EJ – Exajoule
Etc. – Etcetera
EU – European Union e.g. – For example
GPS – Global positioning system GW – Giggawatt g – Gram Ha or ha – Hectare h – Hour IS – International standard i.e. – That is KW – Kilowatt k – Kilo MW – Megawatt m2 – square meter m3 – cubic meter Odt – Oven dry tonne
R&D – Research and development SCM – Supply chain management
SCOR - Supply Chain Operations Reference TW – Terawatt
t – Tonne
tatro – Absolute dry tonne vs. – Versus Symbols € - Euro currency % - percentage < - less than > - greater than
<= less than or equal to >= greater than or equal to
Figures
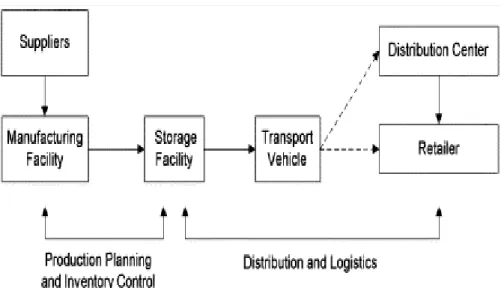
Figure 1. The supply chain process ... 6
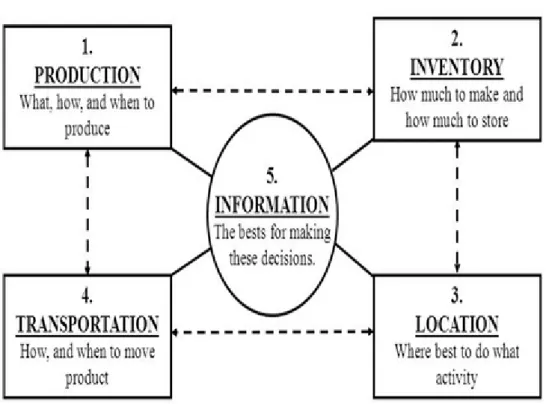
Figure 2. Five major supply chain drivers ... 10
Figure 3. Framework for network design decisions ... 6
Figure 4. Factors affecting the number of warehouses ... 16
Figure 5. Biomass categorization in terms of use and application .. 19
Figure 6. Sources and types of biomass materials for conversion into bioenergy ... 20
Figure 8. The principles of different supply chains for forest-based biomass fractions ... ... 25 Figure 9. Fuel receiving and handling system in Jämsänkoski power plant. ... 27 Figure 10. Wood chip silo with sloping floor in Glasgow UK ... 29 Figure 11. Shows the distribution in percentage of biomass plants in Sweden ... 30 Figure 12. Raw material sources, technical harvesting potentials, and gross potentials of forest chips in Finland and Sweden in 2010 ... 32 Figure 13. Procurement costs (€/m3 solid) of forest chips with differ-ent harvesting systems from differdiffer-ent raw materials in 2010 ... 34 Figure 14. Shows the importance of transportation by representing volume differences of the same weight material by different product types ... 35 Figure 15. A hook-lift truck emptying a bin ... 37 Figure 16. An example of a specialized vehicle used in transportation of residues, bundles and tree sections in Sweden ... 38 Figure 17. A chip truck that uses side tipping system for fuel delivery ... 39 Figure 18. Self-loading chip truck in Sweden equipped with a bucket for loading of wood chips ... 40 Figure 19. Location of forest biomass terminals for energy assort-ments in Sweden ... 42 Figure 20. Shows the distribution in percentage of biomass plants in Germany... 49 Figure 21. Percentage of national wood chip consumption per plant type in Germany ... 50 Figure 22. Modified conceptual representation of the dome-aeration system ... 53 Figure 23. The Dome-Aeration-Technology put in practice ... 54
Tables
Table 1. Biomass energy potentials and current use in different regions ... 2Error! Bookmark not defined. Table 2. Annual woodchip consumption is Sweden per plant type .. 30 Table 3. Average distance of terminals to facilities of interest ... 40 Table 4. Average annual values of biomass terminal characteristics in Sweden ... 43 Table 5. Different assortments of biomass and their corresponding total mass ... 44 Table 6. Inventory frequencies and practices observed in Swedish ter-minals ... 45 Table 7. Prevalence of different types of equipment for terminals of different size classes in Sweden ... 46 Table 8. Forms of biomass stored at terminals of different size classes in Sweden ... 47 Table 9. Some biomass harvesting systems in Germany ... 51
1
INTRODUCTION
Our world in the 20th century has certainly experienced a lot of dras-tic changes as compared to the previous centuries or even millennia before it. These changes came about in all forms and categories of human existence; social, economic, political, cultural, industrial and technological development amongst others. Perhaps, the greatest change to life now and a century earlier has been in the aspect of medicine, industry and technology.
Development in all these sectors have made our world; the standard of living of the average person today as compared to decades ago a lot different and of much higher value in terms of quality. However, the emergence of changes and the introduction of new things also brings forth new problems and unprecedented challenges.
Industrial advancement with the help of discoveries and new technol-ogy has been growing exponentially as time passes. This advance-ment, both in medicine and technology has reduced the mortality of humans, making man thrive longer in the environment. Thus there has been a population explosion and growth over the last 50 years. With increasing population and a huge dependence on industry and technology, comes the need for more energy. Energy which has been mainly supplied through the use of non-renewable fossil fuels that has had a serious negative environmental impact on our planet. However, with most governments; individually and collectively, hav-ing realized the long term impact of continual dependence of non-renewable fuels, have all resorted to seeking and promoting alterna-tive sources of fuels. One of such governing body is the European Union, which has put into law in all member countries to achieve a share of at least 20% of renewable energy resource in the total share of energy consumed by the year 2020. The idea is to utilize fuels which are sustainable, clean and environmentally friendly to reduce
dependence on fossil fuel and thus reduction of greenhouse gas emis-sions which would better protect our environment. One of such re-newable fuels amongst many others proposed is the greater usage of biomass.
1.1
BACKGROUND OF THE RESEARCH
The idea and background behind the selection of this topic comes from the Biopooli project, which at the moment has been tasked to The Institute of Biotechnology Saarijärvi – JAMK University of Applied Sciences. The main challenge of the project is to design a new bio-mass terminal which specifically handles woodchips. This project seeks to develop or enhance latest technologies in realizing an ultra-modern terminal which would involve several unique activities func-tioning together collectively. Improved innovative models to be demonstrated include;
• Effective separation of ‘knot chips’ which contain highly valued wood extracts from forest chips.
• Cost and efficient way of net biomass transportation.
• New biomass drying methods.
• Pre-treatments to improve storability and quality.
• An effective logistics management and control system and
• Finally, to increase entrepreneurship and to further R&D actions aiming to develop premium wood based products that will have high export value.
This biomass terminal comprising all these concepts has to be effi-cient, modern in processes and also meeting up with all environmen-tal and safety requirements of the industry. The terminal would be constructed in a site to be decided later somewhere in North Central Finland.
1.2
RESEARCH OBJECTIVES AND FOCUS
This thesis research is based on gathering information on the latest and efficient processes involved in a centralized system of biomass supply chain. This encompasses studying trends in two specified tar-geted geographical areas within Europe, that have similar trends of operation, climatic challenges, biomass dependence philosophy, bio-mass usage models, and as well as technological advancements which is similar to what is currently done in Finland. The selected countries for study is Sweden and Germany.
This study has its core focus on biomass in the form of wood chips. It would discuss in detail in the countries being studied, how their op-erations of forest wood chips supply chain is being made effective. Activities like collection of raw materials, chipping, transportation, drying, quality improvement, storing and other important terminal operations etc. would be reviewed.
Furthermore, a concise analysis of the processes observed in each country will be done individually and then it would be compared to the other country to draw conclusions on which sub-processes is most efficient. The efficiency might be revealed through cost analysis or the price that is paid for delivered energy (€/MWh) if possible. Finally, if a result is achieved and conclusion reached, the researcher/author of this thesis would make a recommendation to the Biopooli project team on the most suitable ways to model the construction and oper-ations of the new biomass terminal to be built.
1.3
METHOD OF RESEARCH
This study conducted by the author will describe the most suitable and efficient use of centralized systems in biomass supply chain. Based on a review of toolkit of research methods, the author chose to use the desktop research method. In using this approach, the
au-thor will gather data and information from all sources relevant to an-swering the research problem. Sources will include; academic publi-cations, company publipubli-cations, national government data publica-tions, and information from other research publications; both the ones done by individuals or by collective researchers in institutions dealing with issues related to the research question(s).
As mentioned earlier, there are two countries chosen as focus geo-graphical areas for study; Sweden and Germany. This will bring us to a sub-method which will involve ‘making a comparison’ between the two regions. Thus, in so doing, it gives the study a quantitative ap-proach. However, because the author also seeks to explain to the reader(s) the theoretical idea behind biomass terminals and supply chains, the research would also possess a qualitative aspect to it.
2
THEORETICAL BASIS
2.1
SUPPLY CHAIN MANAGEMENT (SCM)
These two words, ‘Supply chain’, has arguably been one of the most spoken about words for businesses in recent years. Globalization has made it very key for companies to have a good supply chain. How-ever, what does it really mean? Why is it talked about so much in business? And why is supply chain management important? To un-derstand supply chain management, we have to define what supply chain really means. Chopra and Meindl in their book describes a sup-ply chain as “all stages involved; directly or indirectly, in fulfilling a customer request. The supply chain not only includes the manufac-turer and suppliers, but also transporters, warehouses, retailers, and customers themselves.” (Chopra 2010, 2).
From the definition we have above, it becomes perhaps logical to draw out what supply chain management should be. In most cer-tainty, it has to be the decisions we undertake in our supply chain to optimize the results of the activities in it.
Another scholar in the field of supply chain would go on to describe supply chain management as “the coordination of production, inven-tory, location, and transportation among the participants in a supply chain to achieve the best mix of responsiveness and efficiency for the market being served.” (Hugos 2011, 4).
It is very important to note some of the ‘key words’ (production, in-ventory, location and transportation) in Hugos’ definition of supply chain management. These key words would form the basis and im-portantly help us in understanding the principle of supply chain man-agement and its components in subsequent sub chapters below. Furthermore, SCM is distinct from logistics in its own right. This may sometimes be misunderstood. While logistics is more of actions that happen internally in an organization, SCM deals with interactions be-tween several companies that makes it possible for a product or ser-vice to get to the end user. (Hugos 2011, 4).
Figure 1. The supply chain process. (Beamon, 1998)
Mielensäpahoitt aja 32 % Hobitti – Viiden armeijan taistelu 24 % Risto Räppääjä ja liukas Lennart 19 % Hobitti – Smaugin autioittama maa 13 % Kummeli V 12 %
Katsotuimmat elokuvat 2014
2.1.1Drivers Of Supply Chain Management
There are five basic components that are key in any supply chain. Particular attention must be given to these areas if any firm’s man-agement is to achieve a streamlined supply chain and positive results. They are;
• Production – in the most simplified manner, it defines the ca-pacity of a supply chain to make and store products. Looking at this component of SCM, a typical question often asked could be ‘How much of which products should be produced and by when?’ Therefore, SCM seeks to address the balance between responsiveness and efficiency as regards to production capacity or output.
• Inventory – this main reasons of having inventory is to have a measure against fluctuations in the market. SCM seeks to de-velop a dynamic balance of how much inventory should be held and also in what form (raw material, semi-finished or as fin-ished goods) should this buffer be kept along the supply chain.
• Location – it is concerned on the decision of where facilities in the supply chain are located. The location of these facilities plays a very critical role in cost and performance characteristics of a supply chain. Also, factors like cost of labor, availability of human resources, infrastructure, taxes, and proximity to sup-pliers and customers are all considered in SCM decisions.
• Transportation – resolves how to move inventory (products, raw materials etc.) from one point to another all along the sup-ply chain. SCM decides on the best possible mode of transport
for the particular inventory to be transported in the supply chain. Form of transport used of course always lies within the six basic means of transport; sea, road, air, rail, pipelines and electronic transportation (data, energy in the form of electricity etc.).
Information – this perhaps is the most critically important component or driver in SCM. It connects all activities of the other four compo-nents together in the supply chain. Information in SCM is used pri-marily for two purposes; (a) coordinating all daily activities in the other four supply chain drivers and (b) for forecasting and planning to ensure that uncertainties which are unavoidable in demand and supply are adequately cushioned and dealt with when they arise. (Hu-gos, 2011).
When a firm has taken decisions along these lines, it will define their overall strategy. For example, if a firm decides to stay competitive by having low cost products; it has to ensure it takes decisions in these five major drivers (production, inventory, transportation, location and information) that will ensure that it supply chain has a low cost. In doing this, the firm might lack flexibility and responsiveness to a cer-tain acceptable level but it may not matter that much because they (the firm) has not chosen to stay competitive in the industry by hav-ing very high service level.
2.1.2Network Design And Planning In Supply Chain
Firms or companies could possess a very diverse stream of supply chain. It is very important for an organization to get a good ‘design’ and plan all sorted out optimally because this has a significant impact on their performance. For an organization to draw up the right net-work design framenet-work for operation, there are several design deci-sions that have to be made according to design classifications. These classifications are; facility role (e.g. processes conducted at the facil-ity), facility location (e.g. where they should be sited), capacity allo-cation (how much capacity should a facility have) and market and supply allocation (e.g. what market should a facility serve). (Chopra 2010, 107).
Therefore, based on the mentioned classifications an organization can develop a suitable network design, thus, achieving an effective supply chain. However, there are also underlining influencing factors that should be considered by an organizations’ management in designing a network to stay competitive. Some of these factors can be con-trolled by the organization while some may not as we will see shortly. It all now depends on skilled management to navigate around these factors to achieve an effective supply chain network. These factors are;
• Strategic factors – an organization may choose to embark on a certain strategy for its overall operations depending on the or-ganizations’ mission for success in the business environment. For example the firm may choose to take a cost leadership ap-proach thus locating her facilities in a low cost geographical area or she may decide to focus on ‘responsiveness’ which may make them end up setting up their facility (or facilities) in a location that may be of high cost but closer to their target mar-ket.
• Technological factors – depending on the flexibility of the tech-nology associated with the core of business of the company, an organization may decide to develop a network design that cen-tralizes its facilities to a particular location or if not, vice versa, thus, the firm still retains its competitiveness.
• Macroeconomic and political factors – As mentioned earlier, these are factors that are external to the individual company’s control. They include taxes, exchange rates etc. (macroeco-nomic), and political stability (political factor). These dynamics plays a major part in an organizations competitiveness and therefore must be take into account when designing a supply chain network.
Competitive factors – this basically means reflecting on a firm’s com-petitor(s) strategy, size and location when a suitable network is being drawn out. A firm should look into the pros and cons of its facility’s proximity to that of rival competitors, because things like labor and raw material availability may be decisive on the final success of the firm in the business environment. (Chopra 2010, 108).
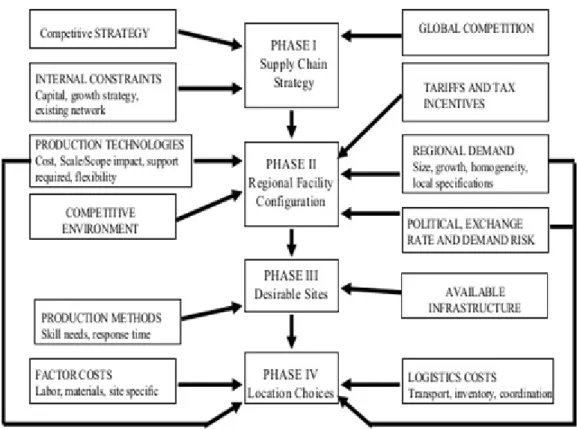
Furthermore, Chopra and Meindl says that the goal of designing of a supply chain network is to maximize a firm’s profit while satisfying customer needs in terms of demand and responsiveness. They sug-gest a development of a framework for network design along four distinct phases, which are key to making the right decisions in a sup-ply chain.
Figure 3. Framework for network design decisions. (Chopra 2010, 114)
The picture above shows a framework when we think about taking decisions when building an effective network. With this kind of chart above (see figure 3), a firm’s management can more ‘visually see’ the type of competition, business environment and costs facing their industry. Let us slow down a little and reflect on what we have
dis-cussed in the earlier subchapter and paragraphs. Drivers or compo-nents of supply chain was mentioned, and also in the previous para-graph we discussed factors to be considered when taking decisions. Combining these two ‘things’, we would be able to come up with a framework above (which we see contains these necessities) as shown in figure 3. In each phase, there are factors and drivers considered sequentially before a decision is reached. In ‘phase I’, the most im-portant thing considered is the organizations mission i.e. competitive strategy which it aims at using in succeeding in the business environ-ment. When this is done, then it would be possible to define the right structure needed to achieving this. Between ‘phase II’ and through to ‘phase IV’, what is considered mostly revolves around facilities, its configuration and roles (capacity of facility too) and also their desired location in the supply chain. It is in these phases the broad geograph-ical region of facility investments would be decided (based on the ensuing factors and shown in the figure above), desirable potential sites and finally a precise location and output capacity of the facilities. (Chopra 2010, 115).
2.1.3Centralized Storage System
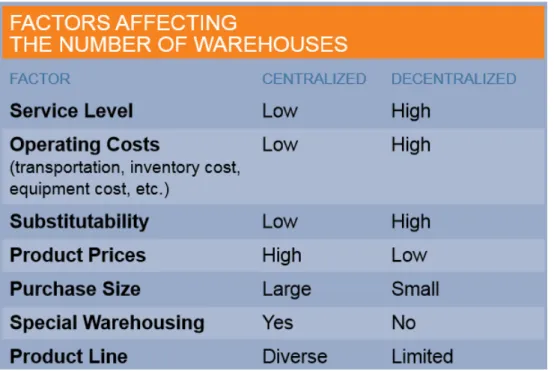
We have discussed in earlier chapters and subchapters about supply chain management, drivers of SCM and finally how to design effective networks. However, looking in deeper, another thing of interest is the distribution of goods in a supply chain. At the center of this is ware-housing (storage). A firm can decide to take a centralized or a decen-tralized approach in matters relating to warehousing.
A centralized warehouse storage approach is when a single central warehouse is used against the use of several smaller warehouses (i.e. decentralization) spread out around the same geographical region. (Houston Chronicle 2015). The idea of implementing a central or a decentralized system depends on the desired balance between cost and service level which the firm wants to achieve. (Ticon 2012).
Benefits of a Centralized System
There are some advantages when a firm decides to take a centralized approach in warehousing. These benefits include;
• There is higher operating efficiency and better space utilization within the warehouse. This also reflects on workers, equipment and inventory control.
• It could lead to reduced transportation costs because it enables easier route planning, and thus associated investments are op-timally employed.
It also brings about lower operating costs, especially when we con-sider costs that comes from administration, utility and equipment, when you have several smaller warehouses versus just one central warehouse serving the same geographical region. (Ticon 2012).
Limitations of a Centralized System
Utilization of a centralized system despite its many advantages also comes with some disadvantages. These disadvantages include;
• Lower service level – perhaps this is one of the most easily observed disadvantage of running a centralized system of warehousing. A centralized system cannot easily adjust to flex-ibility of customer demands mainly due to its proximity to the customer.
• It poses a greater amount of risk especially in terms of uncer-tainties like natural disasters. In this case if a central ware-houses looses its operational function because of a disaster the whole supply chain is ‘held down’ until the problem is resolved unlike in the case of a decentralized system whereby other warehouses may still be in operation and the supply chain con-tinues to function at a certain level. (Ticon 2012).
2.1.4Supply Chain Analysis
Supply chain analysis is a very important part in supply chain man-agement. Analysis of a supply chain has to be done to observe if the set targets, goals and strategy in designing a supply chain is being achieved and also to improve existing processes in a supply chain. One important thing to note is that supply chain analysis is not just done once for a particular supply chain but has to be continuous for the duration of the supply chain existence. This is because customer demands fluctuate and the business environment keeps changing. Supply chain analysis undergoes three major stages to achieve the desired result. (Stadtler 2008, 37).
The first is to understand the entire process in the supply chain by the aid of a modelling tool. One of such specific tools used in supply chain analysis is The SCOR-model (Supply Chain Operations Refer-ence) that was developed by Supply-Chain Council (SCC). (Stadtler 2008, 37).
Secondly, a performance measurement is done to validate the effi-ciency and efficacy of the existing supply chain process. At this point, the measurement standards should be clear, concise and valid. Meas-urements should also not just be quantitative (costs and profits, lead time, customer response time etc.) but also qualitative (e.g. customer satisfaction, the supply chain flexibility etc.) despite the latter having no clear distinguishing numerical measurement indicator. (Beamon 1998, 287).
The final phase in supply chain analysis is inventory analysis. Inven-tories are often or always seen in any supply chain so as to be able to respond effectively to fluctuations. However, a lot of cost (i.e. hold-ing costs) can be associated to havhold-ing inventories. When inventory analysis is done, it points out the average inventory level in a supply chain, it indicates causes of inventory levels and also shows the most important components in inventory to the supply chain. With this in-formation, firms can be able to identify the advantages and costs re-lated to their inventory and will be able to achieve a balance between these and thus will set desired targets (inventory size) for an optimal inventory for the supply chain. (Stadtler 2008, 37).
2.2
BIOMASS
The word ‘Biomass’ is a quite broad term, and it has been used and understood from different concepts. There is no concise definition that encompasses what it all represents but depends on the perspective. Perhaps, the best definition suited for this research would be that biomass is any organic matter that can be used in the production of or conversion into energy. With this definition, it is logical to say that
examples of biomass are food crops, non-food crops, crop residues, wood wastes and byproducts and also matter from animal origin. (Bracmort 2015, 5).
2.2.1Sources And Types of Biomass
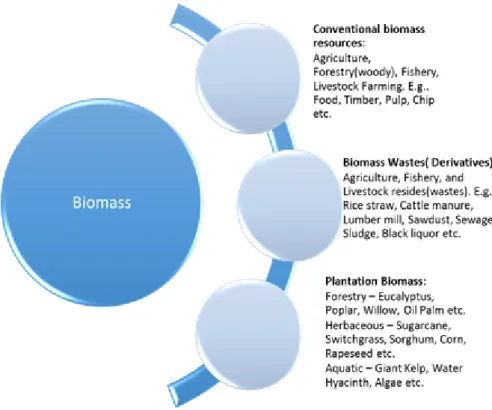
Biomass is a word that comprises of vast many sources of matter, though all is biological. Therefore, there is no exact method of group-ing biomass into its relevant categories. However, to make it less ambiguous there have been implemented methods employed in cat-egorizing biomass based on its use and application. (Yokoyama 2008, 13).
Figure 5. Biomass categorization in terms of use and application. (Yokoyama 2008, 14)
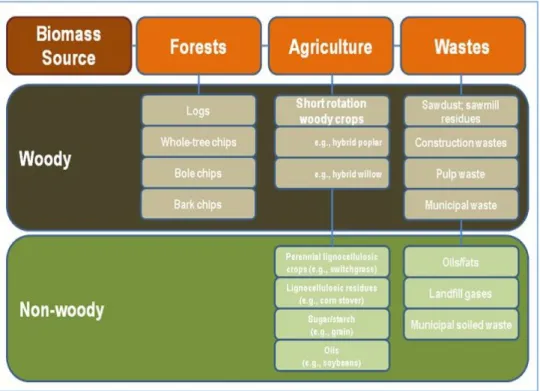
Furthermore, a researcher at the University of Wisconsin divided bio-mass into different categories. The sources and types were catego-rized according to biomass material (woody or non woody), its use in
conversion into bioenergy and finally according to agricultural sys-tems. (Williams 2011).
Figure 6. Sources and types of biomass materials for conversion into bioenergy. (Williams, 2011)
2.2.2Biomass Availability
With the world actively seeking out new sources to satisfy the ever growing need of energy and independence from fossil fuels, scientist have taken out time to calculate the potential of biomass as a sup-plement. Studies have shown that there available biomass on earth to supplement the use fossil fuels as a source of energy. From calcu-lations, our planet is currently covered with about 3870 (106) ha of forests (95% are natural forests and 5% are plantations). Further-more, from available data and estimations, there is a global consump-tion of about 340 EJ/a, and 30% of this need (amounting to 100EJ/a) could be satisfied sustainably from available worldwide biomass
re-sources. However, only 40% (40EJ/a) of available biomass is cur-rently utilized for energy. In other words, only two-fifths of available biomass potential globally is being used. Woody biomass alone can generate 40.6 EJ/a to our planets need. (Parikka, 2003).
Table 1. Biomass energy potentials and current use in different re-gions [EJ/a, EJ=1018]. (Parikka 2003, 618)
N. Amer-ica Latin.
Amer-ica Asia Af-rica Eu-rope
For-mer USSR World Biomass Po-tential Woody bio-mass 12.8 5.9 7.7 5.4 4.0 5.4 41.6 Energy crops 4.1 12.1 1.1 13.9 2.6 3.6 37.4 Straw 2.2 1.7 9.9 0.9 1.6 0.7 17.2 Other 0.8 1.8 2.9 1.2 0.7 0.3 7.6 Total Poten-tial (EJ/a) 19.9 21.5 21.4 21.4 8.9 10 103.8 Usage (EJ/a) 3.1 2.6 23.2 8.3 2.0 0.5 39.7 Usage/Poten-tial (%) 16 12 108 39 22 5 38
2.3
WOOD CHIPS
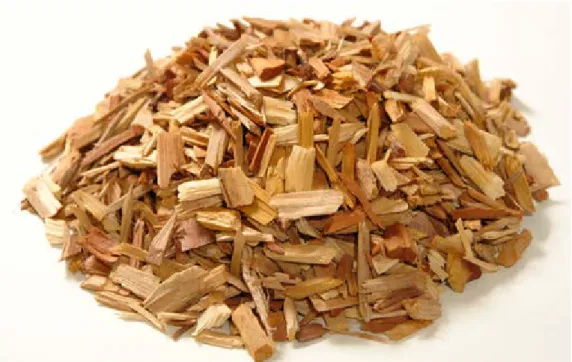
Wood chips are particles or small fragments of wood that are deliber-ately made or obtained during logging or cutting of trees (as resi-dues). The type of wood chip depends on the source of the tree or the process by which it was obtained. They could be made by shred-ding, cutting or residual collection depending of the usage intended for it. They are usually uniform in size.
The precise size of wood chips varies, depending on the type of wood and the chipper used to create them. As a general rule, they are cre-ated as a byproduct of timber processing, with small branches, off cuttings, and other debris being run through a wood chipper. (Wise-Geek, 2015).
Figure 7. Wood chips. (Source Vapo, 2015).
2.3.1Quality of Wood Chips
Woodchips have a wide variety of usage. This could range from do-mestic use in gardening to combine heat and power (CHP) in energy production. The said quality of a woodchip is rather ambiguous be-cause the determining factor(s) depends on the intended use of the wood chip or the source. However, there are key basic parameters to be checked, or factors that would determine if the quality of a wood-chip is appropriate for burning in commercial energy production. These factors are;
• Moisture content – this simply means how much water content the wood source (tree) contains. It is expressed as percentage of water in comparison with the total weight.
• Particle size distribution – it is the degree of uniformity by size of a woodchip sample. For example, The IS CEN standard clas-sifies woodchips as P16, P45, P63 and P100 and according to the standard, it demands that 80% of particles from a sample should be able to go through a screen with regards to the in-tended size gap of the sample.
• Ash content – the lower the ash produced by the wood the bet-ter the quality. If the woodchip contains bark, needles, sand, soil or grit when it is fed into a boiler and burned, the ash pro-duced is significantly higher.
• Bulk density – this refers mainly to the wet bulk density which is the weight per unit volume of the chip, usually in kilogram per cubic meter loose volume.
• Dust and fungal spores – they are things that cannot be pre-vented as part of the woodchip pile. Though if it is stored and managed properly their level will be reduced and they will cause minimal allergy and reaction to the people working in the envi-ronment. (Kofman, 2006).
2.3.2Supply Chain of Wood Chips
Earlier in this report, sources and types of biomass was mentioned. Figure 6 highlighted the major sources of biomass which were, ‘for-estry, agriculture and waste’ sources. As regards to the supply chain of woodchips to plants for energy production, in this report we would limit our scope to only forestry supply chain as a primary source of woodchip supply to plants.
In forest supply chain of woodchips there are a number of types or methods used in this supply chain. These types are;
• Terrain comminution: activity involved in this type of supply chain is that the woody biomass is processed (chipped) right at the site where the tree is being felled.
• Road side comminution: This type of supply chain are divided into two types. In the first type, the chipper and the truck to transport the chips from the roadside are separated. A separate machine chips the woody biomass and another equipment; in this case a truck, which is used for its transportation from the road side. The second type is that the comminution and trans-portation of the forest woody biomass is done by the same equipment i.e. an integrated chipper-chip truck as it is com-monly referred to.
• Terminal comminution: this approach involves transporting the forest biomass in its raw form either loosely or neatly bundled directly to the terminal were it undergoes comminution and thus proceeds to the plant where it is to be used as fuel.
Plant comminution: forest woody biomass is transported directly in a loose or bundled form straight to the plant, where it is comminuted and utilized at the plant for energy generation.
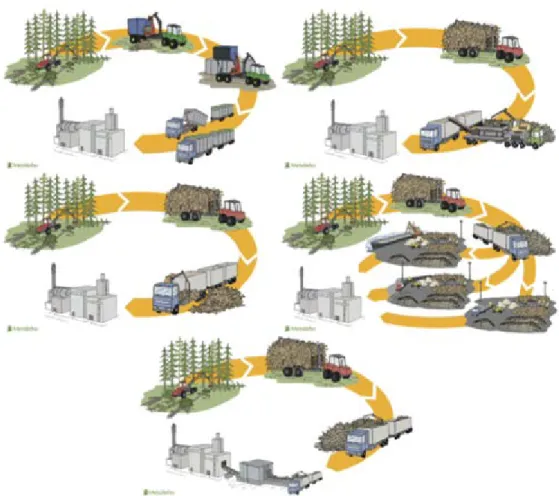
Figure 8. The principles of different supply chains for forest-based biomass fractions (Original source: Metsäteho Oy), Top left - terrain Chipping, Top right - roadside comminution (separate chipper & chip truck); Middle left - roadside comminution (integrated chipper-chip truck); Middle right - comminution at terminal; Bottom - comminution at plant. (Cross 2014, 31).
Also, Cross et.al says that, the forest supply chains can further be divided into centralized or decentralized chains. In centralized chains comminution takes place in the terminals or at the plant. In decen-tralized chains comminution takes place either at the roadside at har-vesting sites or in intermediate storages. The centralized methods are ideal for very large volumes, which allow high load factors for ma-chines. This results in lower comminution costs, as all operations can be done with the same machines in the same place without delays. Because of high investment costs, comminution at the plant is suita-ble for bigger power plants with significant use of forest biomass. In the decentralized methods, the chipping or crushing is directly linked
to the transportation system and cannot operate separately. This makes decentralized chains very vulnerable to machinery break-downs. (Cross 2014, 30).
Furthermore, in Finland, supply chain of woodchips basically employs the main structures and categories of known supply chains. However, Finland is a country of long distances and weather conditions that vary largely. So depending on the nature of the environment and dis-tance of the supply source to the plant, different kinds or even hybrid supply chain methods could be utilized. Roadside chipping, truck transportation of (loose and bundled resides or even felled tree) to the terminal or plant, before train transportation are all possibilities currently undertaking in Finland. (Tahvanainen, 2011).
2.3.3Handling of Wood Chips
Wood chip fuels are from different sources and they have varying quality and properties. These physical differences especially are usu-ally put into consideration when setting up a facility that utilizes wood chips. Most often, we find out that energy plants do not have just one type of wood chips being utilized. As such, these plants have to be equipped and prepared to have all necessary equipment in place to handle different sources of wood chips which it may end up in the facility.
In wood chip handling, there are certain important considerations which must be observed and planned for by the receiving company. These are; streamlining the inbound logistics, adequate sorting and blending of the woody biomass, equipping the facility with the right stationary crusher and a capable storage system to meet with con-sumption requirements. (Hakkila, 2004).
All these aspects stated earlier are very important to the overall pro-cess. For example, streamlining inbound logistics is vital because it reduces congestion at the receiving station and makes an efficient
and undisturbed unloading process of the fuels from supply trucks. Also, a good facility should have a stationary crusher which can com-minute all kinds of biomass that is supplied to the plant (note that these biomass may come as loose and balled logging residues, stump and root wood, recycled wood etc.). This ensures fuel availability se-curity by diversity of utilizable woody biomass. Furthermore, just like inJämsänkoski power plant in Finland, if the facility is equipped with adequate disc screen and crusher, it is able to control oversized par-ticles and thus this increases continuous fuel flow and prevents break-age and blockbreak-age of conveyors by the previously oversized particles. Finally, a good storage system can never be over emphasized. This is to ensure a buffer in case of dwindling supplies. (Hakkila 2004, 49).
Figure 9. Fuel receiving and handling system in Jämsänkoski power plant. (Hakkila 2004, 50).
2.3.4Storage of Wood Chips
There is a growing demand for biofuel (in this case woody biomass – woodchips) in the world today. In Europe, where there is a set di-rective for year 2020 on a particular percentage of energy to be pro-duced from renewable energy, industries have increasingly sort best practices to keep the supply of woodchips efficient. Having this sce-nario means that woodchips must be stored for a certain time at some point along the supply chain to ensure constant supply. The size of the storage depends of the usage capacity of the power plant. For example, figure 10 shows inside the storage of a small 90KW biomass boiler that supplies heating to some households in Glasgow, UK. Dur-ing woodchip storage, particle size, the average length of storage be-fore use and also the type of woody biomass should all be considered. (Jirjis 1995, 181).
Storing of woodchips comes at a cost and thus has its challenges. Issues like woodchip degradation, self-ignition and release of ‘harm-ful’ microspores (which may cause allergic reactions) into the storage environment pose a serious concern to woodchip storage. Also, there are different types of woody biomass which differ in physical and chemical properties, thus this makes recommending one suitable storage system impractical. (Jirjis 1995, 188).
According to Paul Janzé, an experienced engineering design profes-sional; suggests there are also a number of things to consider when thinking about biomass storage. He mentioned factors like; pile build-ing and reclaimbuild-ing, use of natural air drybuild-ing, pile compaction, and climate, as important factors that contribute to the type of storage to be used. (Janzé, 2011).
Figure 10. Wood chip silo with sloping floor in Glasgow UK. (AC Gold Energy, 2015).
3
RESEARCH
3.1
SWEDEN
Sweden, a country in the north of Europe has been an early runner in the use of biomass as a means to generation of energy. From the early 1970’s till now there has been a steady increase in it use of biomass in generation of energy in the form of heat and electricity. It has grown to 3.5 times in production during this same period (40TWh/year to 140TWh/year between 1970 and 2012). Sweden as a country, also has the biggest amounts of forests than any other country in the European Union. The fact is, despite this increasing usage of its forests in biomass use for energy generation, statistics still shows that availability of forest biomass has also steadily in-creased yearly. This is because of a sustainable strategy implemented by the government in the use of its forests. (BASIS 2015, 26).
Figure 11. Shows the distribution in percentage of biomass plants in Sweden. H – Heat generating, CHP – combined heat and power, and E – electricity plants. (Source: BASIS, 2015).
In Sweden, the consistent growth in usage of forest biomass (wood-chips, wood pellets, wood logs etc.) has mainly being attributed to a strong political support coming in the form of incentives such as tax exemptions, green electricity certificates and increased taxes levied on industrial carbon dioxide waste emissions. Others include, depend-ence on and increases in oil prices and also new approach and reforms in the use of nuclear power as an alternate source of energy. The use of woodchips particularly as a fuel resource has also seen a continu-ous rise in Sweden. This is in part because pulp industry in the country is decreasing. (BASIS 2015, 26).
Table 2. Annual woodchip consumption is Sweden per plant type listed in oven dry tonne per year (odt/yr.). (Source BASIS, 2015).
SWEDEN
(Overall national wood consumption = 6.848.343 odt/yr.)
Plant type H CHP E
Wood chip consumption/yr. (in odt/yr.) 2999770 3848573 0 Wood chip consumption/yr. (in %) 44% 56% 0
From the table above, it may be good to note that, despite CHP plants being four times less in number compared to Heat producing plants, they still account for a higher percentage of total consumption. This is because almost all CHP plants in Sweden have a production capac-ity of 21MW and above. (BASIS 2015, 28). Also important to point out is the unit of measurement in table 2, i.e. ODt. (See appendix
1). 1 Oven dry tonnes is equivalent to 3 cubic meters of loose wood
chips, which in turn can generate energy of up to 5MWh. (GP electrical services, 2011/Biomass energy center, 2015).
Furthermore, in chapter 2 of this report, we discussed about the ‘sup-ply chain of woodchips’. In Sweden, three of the four practical loca-tions for forest residue recovery is usually employed i.e. terrain, road-side and terminal comminution are used. However, terminal chipping is steadily increasing and would continue as such because of the need to satisfy and streamline the supply of energy wood chips to plants. (Kärhä, 2011). We will now go further in discussing practices and equipment that are used all along the length of woodchip supply chain in Sweden.
3.1.1Harvesting of Forest Woody Biomass In Sweden
The use of forest biomass in Nordic countries is well developed and the same can also be said in Sweden. Forest biomass resource in Sweden as fuel is huge and as well different. Generally in Nordic coun-tries, the most abundantly utilized forest biomass is Scots pine and Norway spruce. They are made available from tree felling activities for sawlogs and pulpwood. Forms in which these forest fuel biomass are; (1) logging residues – they consist of tree tops, branches,
nee-dle/leaves and un-merchantable stem wood. (2) Small-diameter thin-ning wood – these could be whole trees of diameter less than 10cm, delimbed trees, and also they could be pulpwood-sized trees har-vested in young stands. (3) Stump and root wood (4) Round wood – these are stems from trees which are not good enough for timber (e.g. rotten wood or spoilt pulpwood) or trees that have more value if used for fuel rather than sawlogs or pulpwood. (Routa et al, 2012).
Figure 12. Raw material sources, technical harvesting potentials, and gross potentials of forest chips in Finland and Sweden in 2010. (Source: Routa et al, 2012).
Logging Residues
Efficient harvesting of logging residues in Sweden is done in the same way as in Finland. When trees are being felled for sawlogs or pulp-wood, logging residues are gathered, piled and left to dry before being forwarded loosely to the roadside by a forwarder (which usually has an enlarged load space and a residue grapple), and may sometimes
be combined with a soil preparation. However, logging residues could also be moved bundled (which of course incurs extra cost), if there is a long forwarding and road transportation distances along the supply chain. (Routa et al, 6, 2012).
Small Diameter Thinnings
Generally, systems that harvest small-diameter thinning is divided into two in Sweden and Finland. It could be either mechanized or motor-manual. The latter is basically a tree felling frame which is equipped with a chainsaw. The mechanized method utilizes the multi-tree processing technique. There are also two main types; the tradi-tional two-machine system (i.e. having a separate harvester and for-warder machines), and what I call a “hybrid combination”, the
har-warder system – one machine unit that performs both cutting and
forest haulage to the roadside. (Routa et al, 7, 2012).
When using harvesters as the primary machine, the cutting of whole trees can be done with purpose built accumulating felling heads or by normal harvester heads equipped with multi-tree handling accesso-ries. Today, statistics of Swedish large scale harvesting of young stands is mostly done by mechanized harvesting operations, of which over 66% is done by accumulating harvesting heads that may com-pact, partly de-limb and buck the small trees. Then the remaining is done by accumulating felling heads with shears, though it cannot de-limb or compact trees but may buck them into transportable lengths. (Routa et al, 7, 2012).
On the other hand, harwarder machines (although expensive to pro-cure) are effective, for being a system that combines both the cutting and forwarding in its operation. Thus, it reduces organizational costs and also increases capacity utilization. (Routa et al, 8, 2012). The bar chart below shows how the source of the raw material and harvesting system differs the overall costs of forest chips procurement.
Figure 13. Procurement costs (€/m3 solid) of forest chips with differ-ent harvesting systems from differdiffer-ent raw materials in 2010. Note that the forwarding distance was 250 m and transport distance was 45 km. (Source: Routa et al, 2012).
Stumps and Rootwood
Stumps and rootwood are excavated from the ground with an exca-vator that is equipped with a stump ‘lifting-splitting’ device and are gathered at the stand into small piles for the elements (i.e. rain, wind and sunshine) to rinse of the soil contaminants and to also dry the pile. However, the regulatory body in Sweden (i.e. The Swedish For-est Agency) requires that about 15 – 25% of stumps on a harvFor-ested field to be still left un-excavated, to protect the environment. (Anerud & Jirjis, 2011). Thereafter, stump wood is forwarded to the roadside for further storage. Stumps and root wood can also be harvested with separate splitting cranes for large harvesters and forwarders, but heavy-duty tracked excavators, weighing approximately 20 tonnes, are the most cost-efficient systems in these kind of operations. (Routa et al, 8, 2012).
3.1.2Transportation Of Biomass In Sweden
Transportation is a very crucial stage in the supply chain of forest biomass for energy. Flisberg and Rönnqvist explains that just trans-portation itself could account for 25 percent of the total procurement cost of forest biomass in Sweden. (Informs, 2015). The reason of this high share of total cost is because of the often high moisture content, low bulk density and non-uniformity of forest biomass. (Stokes et al., 1993). Currently in Sweden and Scandinavia, forest fuel transporta-tion by truck cannot exceed a maximum gross vehicle weight (GVW) of 60 tonnes. (Eriksson 24, 2014). Although in Finland, the limit was recently extended to 64 tonnes in a 7-axel vehicle for a 5 year trial period. (Karttunen et. al, 2, 2013).
Figure 14. Shows the importance of transportation by representing volume differences of the same weight material by different product types. (Source: Sustainable Forestry for Bioenergy and Bio-based Products).
There are different assortments i.e. logs (usually cut-to-length in Sweden), limbs, bark, tree tops and small trees, which are left as
piles at the landing after trees are felled during harvesting. (Nilsson 7, 2009). Particular transportation interest lies on forest energy prod-ucts which are residue prodprod-ucts from clear cuttings, small trees or stumps. They can be transported (i.e. by road in this context) in dif-ferent ways as wood chips, tree sections, or in the form of loose and bundled residues. The type of road transportation method would de-pend on a number of factors like; the type of forest energy material, quantity, and distance, amongst others. (Mortazavi & Johansson, 2013).
When forest biomass is harvested, transportation is the next phase. Transportation occurs on two stages; (1) the first stage is the trans-portation of un-comminuted forest residues from landing to a central-ized location i.e. a biomass terminal and (2) The second stage in-volves the transportation of the processed forest woody biomass (chips or grindings) from the forest or centralized landings to the final point of use. Road transportation of un-comminuted forest biomass are usually done with bin trucks, hook-lift trucks or dump-trucks. (René, 9, 2013). For forest biomass such as residues i.e. slash, due to the risk of pieces of residues falling off on the road, transportation is now mainly done by the use of slash truck-trailers with solid bottom and sideboards around the load space. (Nilsson 17, 2009).
Figure 15. A hook-lift truck emptying a bin. (Source: Eriksson, 2014).
There are also other specialized transportation vehicles for un-com-minuted forest residues (e.g. slash) delivery to the point where it will be processed i.e. comminution, handling etc. (at a centralized termi-nal or perhaps the CHP plant) depending on raw material. (Mortazavi & Johansson 6, 2013).
Figure 16. An example of a specialized vehicle used in transportation of residues, bundles and tree sections in Sweden. (Source: Mortazavi & Johansson 2013).
The truck in this picture was modified with metal covered sides and floor and some other details such as a crane (with a reach of 10.9m) and a grapple which was adapted to handle logging residues. Note that transportation of un-comminuted stump are done by trucks spe-cifically designed for it. (Routa et al, 8, 2012). Eriksson explains fur-ther that for stump transportation; both for un-comminuted and com-minuted, four vehicle types are suitable. These are: (1) a vehicle ded-icated for bulk chip transport, such as a chip truck with trailer or with semi-trailer configuration, (2) a chip truck and trailer combination equipped with self-loading possibility, (3) a hook-lift truck and trailer system with interchangeable bins i.e. containers, and (4) a truck and trailer dedicated for loose (un-comminuted) stump transport. (Eriks-son 25, 2014).
Figure 17. A chip truck that uses side tipping system for fuel delivery. (Source: Eriksson, 2014).
In Sweden, transportation of comminuted forest biomass which are wood chips or hog fuel is done by chip trucks. (Nilsson 18, 2009). A chip truck and trailer is a light-weight bulk vehicle designed for max-imum payloads of around 37-38 tonnes and a truck frame volume of 128-140 m3. They can also be equipped with its own crane and bucket to enable self-loading. (Eriksson 25, 2014).
Figure 18. Self-loading chip truck in Sweden equipped with a bucket for loading of wood chips. (Source: Mortazavi & Johansson 2013).
3.1.3Geographical Locations Of Biomass Terminals In Sweden
As reported earlier (see chapter 2: Drivers of SCM); in supply chain management, ‘location’ of a facility is very important. It adds to the efficiency of the chain and critical to the final cost by which a firm can deliver its goods or services to a customer. Similarly, the location of a biomass terminal as regards to distance from the source of raw material i.e. forest and also to the customer e.g. CHP plant, sawmill etc. is very crucial.
Table 3. Shows the average distance (Euclidean distance i.e. straight line) of terminals to facilities of interest. (Source: Kons, 2015).
Terminal size, ha
Distance to Facility
<2ha 2<=5ha 5<=10ha >=10ha All Terminals
CHP* 43 (31) 43 (30) 56 (42) 42 (32) 44 (32) Pulp mill 63 (39) 63 (60) 85 (64) 144 (76) 66 (48) Sawmill 20 (18) 16 (13) 12 (10) 5 (5) 18 (17) Railroad 5 (8) 4 (7) 0 (0) 1 (1) 5 (8) Closest Terminal 21 (14) 22 (20) 38 (14) 7 (7) 22 (16)
CHP* is Combined Heat and Power Plant with an energy output more than 100GWh
The table above from Kons’ research on 246 terminals in Sweden shows that the average distance in Kilometers of biomass terminals to CHP plants was 44Km (this figure is important because a great percentage of overall costs of chip delivery is tied to road transporta-tion) and to the nearest railroad was 5km. (Kons 36, 2015). Note that the distances stated are Euclidean and conversion to road network distances can be done by multiplying with a coefficient of 1.4. (Ranta, 2005). Furthermore, from the map below (see figure 14) you will ob-serve a higher concentration of terminals in the central and Southern part of Sweden because there is a higher energy demand in those regions of the country. (Kons et al 241, 2014).
Figure 19. Location of forest biomass terminals for energy assort-ments in Sweden. (Source: Kons et al, 2014).
3.1.4Size Of Swedish Forest Biomass Terminals
Once again, it would be essential to reaffirm the primary task the contractor wants the researcher/author of this write up to achieve; which is to find out information about ongoing trends (in Sweden and Germany) with biomass terminals and duly make a recommendation. Having said this, since Sweden is one of the geographical areas being studied, it is important to have a review on general characteristics of biomass terminals in the country. Terminals built for energy are mostly used along forest biomass supply chains to make sure there is a steady supply and to improve the fuel quality. (Johansson et al, 2005).
In 2014, there was a published article on a very well detailed study that was conducted in Sweden on biomass terminals; which were strictly in operation for the supply of fuel to energy plants. This stated background of the study shows it has vital information as regards to my research.
The study was able to concretely gather information from 246 bio-mass terminals and it systemically divided the terminals into four classes based on area (<2 ha, 2 ≤ 5 ha, 5 ≤ 10 ha and ≥10 ha), i.e. size of the facility for ease of further analysis in Hectares. (Kons et al, 2014). Based on this classification, the study was able to better present information as regards to variables such as; biomass turno-ver, terminal space utilization, annual biomass handled, and distance of terminal to energy plant, amongst many others.
Table 4. Average annual values of biomass terminal characteristics in Sweden, for different terminal size classes. (Source: Kons et al 243, 2014).
SIZE CLASS, ha (Hectares)
Terminal Characteristics < 2 2 ≤ 5 5 ≤ 10 ≥ 10
Area (ha) 0.9 3 6.3 14.3
Paved area (% of total area) 47 60 28 38 Biomass turnover per terminal (OD t) 6307 10454 29490 24012 Space utilization (OD t/m2) 0.78 0.37 0.54 0.19
Biomass concentration per assortment (OD t) 3039 4155 5596 5949 Supply from terminal (OD t/customer) 3004 3333 5223 4020
The table above is an extract of information on the general charac-teristics of the studied terminals. Terminals of <2ha not only were more in number but also had a significantly higher space utilization rate (0,78ODt/ m2; see table 3 above), that is why they (terminals of <2ha) handled more than 50% of the total forest biomass in Sweden as compared to terminals of >10ha that managed only 9% of the total biomass. (Kons et al 242, 2014). However, the average size of ter-minals in Sweden ranges from 0,9ha to 14.3ha. Also, the average paved area within the terminals (i.e. <2 ha to ≥ 10) was between 28% and 60%. Biomass turnover was measured in oven dry tonnes (ODt) and it ranged between 6300 to over 29000 ODt. (Kons 33, 2015).
3.1.5Raw Materials/Assortments Handled In Swedish Terminals
Furthermore, the study showed that terminals in Sweden (the ones that responded to this particular question during the survey; 208 ter-minals) handled different types of biomass called assortments. There were 14 kinds of assortments that are being handled in these termi-nals. Amongst them include; energy wood, logging residue chips, loose logging residues and bark. These four listed are the major as-sortments being handled in these terminals in Sweden. Although by a far margin energy wood was observed in the study to be the major
assortment going through the terminals accounting for 63% of all to-tal biomass or 1,1million ODt. (Kons 34, 2015).
Table 5. Different assortments of biomass and their corresponding total mass (in OD t) handled per year by terminals of different size classes in Sweden. (Source: Kons, 2015).
SIZE CLASS, Hectares (ha)
Assortment <2 (n = 154) 2≤5 (n = 37) 5≤10 (n = 9) ≥10 (n = 7)
Energy wood* 605 267 268 041 156 800 96 000 Logging residue chips 139 156 42 677 7123 30 000 Logging Residues 61 418 22 855 31 585 15 930
Bark 65769 29556 6300 5000
Saw Dust 30 800 3696 10 400 12 400 Stem Wood Chips 19 076 10 200 23 600 0 Tree Part Chips 17 660 3471 176 1371 Stumps 14 098 8248 17 980 3720 Tree Parts 14 065 16 494 1445 264 Dry Sawmill Chips 5000 0 0 0
Shavings 1970 0 10 000 1700 Cut Off 1852 0 0 1700 Recycled Wood 1395 2470 0 0 Peat 80 0 0 0 Total 977 605 407 710 265 410 168 085
Energy wood* - low quality round wood used for energy generation
3.1.6Inventory Practices And Equipment In Swedish Terminals
In terminals, it is common to find specialized equipment to enhance the efficient flow of work materials. In Sweden the use of equipment and trained personnel remains key. In Kons’ 2015 study on Swedish biomass terminals, data collected showed that the most common time cycle for inventory checks were mostly done once per month or 3-4
times in a year depending on the size class of the terminal. For ex-ample, data showed that for terminals ≥5 ha, stock levels could be checked monthly or 2-4 times in a year. (Kons 36, 2015).
Furthermore, stock checks at biomass terminals in Sweden of <5 ha, were done by terminal personnel and they generally utilized visual inspection method, whereas terminals in the class size of 5≤10ha had 46% of them using both terminal personnel and personnel from the Swedish Timber Measurement Association (VMF) making stock level checks. However, all terminals in the ≥10 ha class used the Swedish Timber Measurement Association personnel in taking inventory level measurements entirely. (Kons 38, 2015).
Table 6. Inventory frequencies and practices observed in Swedish ter-minals. (Source: Kons, 2015).
No. of inventories/year <2ha 2<=5ha 5<=10ha >=10ha
1 20 21 22 0 2 15 0 0 50 3 to 4 22 17 56 25 12 21 41 22 25 24 6 3 0 0 >24 3 7 0 0 when necessary 13 10 0 0 Inventory method GPS measuring 5 15 0 0 Visual 77 78 22 0 Measuring 51 30 78 100 Other 5 15 0 0
Smaller terminals were also observed to have a mix of measuring techniques, utilizing both visual inspections and GPS measuring equipment, while the much bigger terminals; ≥5 ha employed better
specialized equipment like measuring bridges (used for the bulk vol-ume measurements), measuring houses (used to protect the meas-urement equipment and personnel), scales, and drying ovens. (Kons 38, 2015).
Table 7. Prevalence of different types of equipment for terminals of different size classes in Sweden. (Source: Kons, 2015).
SIZE CLASS, Hectares (ha)
Variable and Category <2 2≤5 5≤10 ≥10
Equipment at Terminals: Measuring bridge 22 14 56 67 Measuring house 13 7 22 33 Forklift 14 5 44 50 Wheel loader 92 82 78 83 Scale 39 41 100 67 Drying oven 12 7 22 33 Other 8 23 22 0
3.1.7Storage Of Woody Biomass In Swedish Terminals
Buffer, inventory, reserve stock (or supplies) are all too family words with any facility that intends to achieve an uninterrupted flow of op-erational process. This is exactly the same case when we talk about biomass terminals; in this case a terminal that has its primary feed-stock as woody biomass for conversion into the desired form of fuel for use in energy plants. Having said this, storage of woody biomass in terminals, like most activities has its challenges. Studies in Sweden have been undertaken to find out best practices of how and in what form to store this wood biomass to reduce the effect of known phe-nomenon like self-ignition, dry matter losses and microbial activities which could lead to health problems.
In Kons’ 2015 study of forest biomass terminal in Sweden, survey showed that up to 82% of forest biomass (in terminals between the sizes of 5 – 10ha) were stored in an un-comminuted form. In the same report he further stated that publications done by Jirjis and Lehtikangas in 1993 and Filbakk et al. in 2011 shows that storing woody biomass in an un-comminuted form reduces dry matter loses, microbial activity as well as the risk of self-ignition due to tempera-ture build up in stored comminuted woodchip piles. (Kons 53, 2015).
Table 8. Forms of biomass stored at terminals of different size classes in Sweden. (Source: Kons, 2015).
Terminal size
class Chips Others Total Mass,
ha OD t % of total mass OD t % of total mass OD t
<2 277460 28 700145 72 977605 2<=5 89601 22 318109 78 407710 5<=10 47599 18 217810 82 265410 >=10 48771 29 119314 71 168085 All Terminals 463431 25 1355378 75 1818809
However, if a terminal desires to achieve a steady supply of commi-nuted biomass to the desired energy plant(s), there must be some form of stored comminuted biomass. Just like table 7 above shows that the studied terminals had comminuted biomass in the range of 18 – 29% of total stored biomass.
There was another study in Nyköping, Sweden with a focus on out-door storage piles, seeking to find out an energy efficient storage of biomass in a CHP plant. The researcher worked with piles of chips from waste wood (obviously of different tree sources) and stem wood (spruce, pine and birch) over 6 weeks. With several results obtained,
and amongst other final recommendations of the researcher, sug-gested that comminution of woody biomass is best done closest to the time of the chips intended use. (Eriksson, 2011).
3.2
GERMANY
Germany is also a member country of the European Union (EU) and therefore complies with the EU law requiring a 20% share of energy generation to be renewable. The country went further internally by passing the Renewable Energy Sources Act (EEG) in year 2000 which contributed and coordinated steady growth in the renewable energy sector within Germany. By year 2013, Germany was able to generate 102.7 billion KWh of heat through wood fired plants alone, which rep-resented 7.4% of total heat consumed in the country that year. (BASIS 29, 2015).
Since the 1990’s Germany has experienced a surge in the generation of energy from biomass. As of 2014, there were 640 CHP plants alone and presently over 1700 plants producing energy as heat and power. Presently, almost every major German city have at least one biomass heating plant in operation. (BASIS 30, 2015).
Figure 20. Shows the distribution in percentage of biomass plants in Germany. H – Heat generating, CHP – combined heat and power, and E – electricity plants. (Source: BASIS, 2015).
One important raw material for fuel in biomass plants in Germany is of course wood. In Germany, the consumption of wood for material and energetic use was about 150 million m³ in 2013. Currently in Germany about 75 million m³ of wood yearly is utilized for energy and it is expected that by the end of 2015, the consumption of wood for the generation of energy is expected to reach 80 million m³. (BASIS 33, 2015).
Figure 21. Percentage of national wood chip consumption per plant type in Germany. H – Heat generating, CHP – combined heat and power, and E – electricity plants. (Source: BASIS, 2015).
3.2.1Harvesting Of Biomass In Germany
In Germany, supply of energy wood comes from both forest biomass, agricultural short rotation plantations, and other sources like wood recycling, and landscape management measures etc. (Grosse, 2008). Harvesting systems and equipment in Germany is quite diverse. In a ‘broader category’, they could be classified into interrupted system or uninterrupted system. (Grosse, 2008). However, some of the systems have been mentioned more precisely in texts. As Ghaffariyan men-tioned in his article in 2010; for forest woody biomass, a harvester that is complemented with a feller-buncher machine is used. Also common is the use of a forwarder with a harvesting head attached to it. (Ghaffariyan, 2010). If a harvester feller-buncher is used, the felled biomass would have to be moved to the roadside from landing by a forwarder. Unlike when the latter (i.e. forwarder with a harvest-ing head) is used, it is able to both harvest and transport the biomass by itself to the roadside where it will continues its journey along the supply chain. (Cremer, 2008).
Table 9. Some biomass harvesting systems in Germany. (KWF, 2008).
The table above shows other biomass harvesting systems used in Germany. It also gives information on the comparison of the different harvesting systems based on price, impact on environment, as well as the best suited terrain to utilize a particular harvesting system. There are also three distinct ways by which SRP harvesting is done. Which are the log, the bundler, and the chip-technique. (Grosse, 2008). Grosse states that the first two techniques are interrupted systems. Harvesting short rotation plantations for wood chips supply
could also be done with an agricultural reaper-chipper (with this equipment it is an uninterrupted system) and could be well suited for trees of cutting diameter up to 12 centimeters. (Ghaffariyan, 2010).
3.2.2Drying And Storage Of Wood Chips In Germany
Drying and storage of wood chips goes hand in hand, and both stages in the supply chain are extremely important to the overall quality of delivered wood chips. As earlier mentioned (see section 2.3.1), mois-ture content is one of the factors that affects the quality of wood chips. For energy conversion ratio to be higher when wood chips is burned, drying has to be done. This is because freshly harvested wood chips can have moisture content as high as 50%. (Grosse, 2008). Similarly, wet wood chips i.e. un-dried wood chips per volume unit has a heat value of less than half when compared to an absolutely dry chips of the same volume unit. Ideal range for moisture content should be approximately 30% to achieve optimal burning purposes. (Grosse, 2008). Thus, the importance of drying cannot be over em-phasized.
There are several problems (costs, practicality etc.) associated with common drying techniques like; free air circulation drying, cold-air-drying and hot-air-cold-air-drying. Likewise, with the next stage in the supply chain which is storage, problems like action of microbes leading to self-warming and biomass degradation is also observed. However, harnessing the phenomenon associated with biomass self-warming, a new technique for drying wood chips called The
Dome-Aeration-Technology, was developed and it now in use practically. (Grosse, 2008).
![Table 1. Biomass energy potentials and current use in different re- re-gions [EJ/a, EJ=10 18 ]](https://thumb-us.123doks.com/thumbv2/123dok_us/9755006.2466841/26.892.184.761.309.659/table-biomass-energy-potentials-current-use-different-gions.webp)