Journal of Accounting, Business and Finance Research ISSN: 2521-3830
Vol. 5, No. 2, pp. 51-59, 2019 DOI:10.20448/2002.52.51.59
The Development of IFRS Implementation Index and its Effect on Corporate Values in
Indonesia in 2015
Ahalik Ahalik 1 Etty Murwaningsari2 Sekar Mayangsari3 Titik Aryati4
1Doctoral Student of Trisakti University and Lecturer of Kalbis Institute, Jakarta, Indonesia
2,3,4Trisakti University, Jakarta, Indonesia
Abstract
Indonesia has adopted the latest international accounting standards, namely IFRS (International Financial Reporting Standard) since January 1, 2012, thus accounting standards in Indonesia called financial accounting standard statements (PSAK) have been based on IFRS, where before Indonesia refers to American accounting standards (US GAAP - United States Generally Accepted Accounting Principle. The adoption of the IFRS is one of Indonesia's commitments as a G20 country. G20 countries consist of developed and developing countries in the world which represent 2/3 of the world's population and 75% of world trade, thus, it can be said that IFRS have become global standards. This research was conducted to determine the development of the IFRS implementation index and its influence on the value of companies in Indonesia. The research method uses multiple regression, with purposive sampling method as many as 45 companies that have used PSAK. The results of the study show that the IFRS implementation variable has a negative and significant relationship to the value of the company through economic value added. This shows the ability of corporate value through economic value added does not have an impact on IFRS implementation in companies in Indonesia.
Keywords:
Index of IFRS implementation Economic value added.
JEL Classification:
M41 Accounting.
Licensed:
This work is licensed under a Creative Commons Attribution 4.0 License.
Publisher:
Scientific Publishing Institute
Funding: This study received no specific financial support.
Competing Interests: The authors declare that there are no conflicts of interests regarding the publication of this paper.
1. Introduction
International Financial Reporting Standard (IFRS) began to be adopted in Indonesia since 2008 and became effective on January 1, 2012. Thus, accounting standards in Indonesia known as the Statement of Financial Accounting Standards (PSAK) are based on IFRS. IFRS has become a global standard where members of the G20 countries have agreed to adopt IFRS. IFRS is based in Europe where the city of London, England, is the base of the board of financial accounting standards known as the International Accounting Standard Board (IASB). IASB is an accounting standard board in charge of creating IFRS standards. The reason Indonesia adopted IFRS because IFRS adoption is one of the commitments made by Indonesia as one of the G20 countries. G20 member countries consist of developed and developing countries representing 2/3 of the world's population, 85% of global domestic products and representing more than 75% of world trade. G20 member countries consist of European Union, United States, Turkey, South Africa, Saudi Arabia, Russia, Mexico, Republic of Korea, Japan, Italy, Indonesia, India, Germany, France, China, Canada, Brazil, Australia,
and Argentina (Website G20, 2017). IFRS has different characteristics from US GAAP (United States Generally Accepted Accounting Principles) where IFRS adheres to the principle basis while the rule-based US GAAP. Indonesia has so far been oriented to US GAAP which adheres to the rule base.
Indonesia, previous research, (Fauziah, 2015; Gunawan & Eka, 2016; Supriyono, Achmad, & Joko, 2014) show that the level of mandatory disclosure ranges from 60-90% for companies that have significant public accountability where the implementation measures are used is using the Bapepam, Deloitte index, and adoption or not adoption. There has been no measurement of IFRS adoption at the entity level that involves IFRS standards that are completely different from US GAAP in detail so that it can produce an IFRS implementation index that can be used as a reference in the regulator or those who need the level of IFRS implementation in Indonesia. The context of IFRS in this study refers to IFRS-based SFAS, while US GAAP refers to SFAS before IFRS adoption. Flexibility when choosing accounting methods sometimes motivates managers to choose accounting methods or to change which is used in order to increase, decrease, or flatten income figures from year to year (Rohaeni & Aryati, 2012). In other words, management can efficiently utilize the looseness of using accounting methods and procedures to increase and decrease profits. This is called earning management which is an intervention from management to manage profits. Butler, Leone, and Willenborg (2004) said that earning management in financial statements can be identified using key ratios, such as gearing and liquidity, and the application of IFRS standards to these financial statement items can reduce the level of earning management.
EVA uses capital costs as its main component which consists of interest and dividend costs and is compared with its net income. EVA is a measurement of economic value added which is the impact of management activities or corporate strategies (Young & O’Byrne, 2000). Thus, measuring the value of a company with EVA is the same as measuring the increase in value added from the strategy and reducing strategies that are not value added. EVA is accepted as an important instrument for measuring performance and management throughout the world (Hajiha & Farhani, 2011). As a measure of value, several factors can influence the value of EVA. Factors that can influence EVA include ownership structure (Fardhina & Retno, 2013) Return on Invested Capital - ROIC (Anna & Anna, 2016) intellectual capital, tangible resources (current assets, productive assets), intangible assets, and liabilities (Wibowo, 2009). EVA can be used as a measure of corporate value (Fardhina & Retno, 2013).
Based on the explanation above, the problems examined in this study are as follows: (1) How to build an IFRS implementation index included in the latest PSAK which includes recognition, measurement, disclosure and terms that can complement the size used by Bapepam no. VIII G.7 concerning "Presentation and Disclosure of Financial Statements of Issuers or Public Companies" and which are the hallmark of IFRS? (2) What is the effect of IFRS implementation index on companies in Indonesia on the value of the company?
2. Literature Review
Index of IFRS Implementation and its effect on company value
The research that will be carried out is the development of previous studies where the newness is in the IFRS implementation index that will be built by researchers. Previous research in which IFRS as its main variable was calculated using mandatory IFRS disclosures (Fauziah, 2015; Gunawan & Eka, 2016; Supriyono et al., 2014; Tsalavoutas & Dionysiou, 2014). Mandatory disclosure of IFRS uses local standards of a country that has adopted IFRS, also the level of IFRS implementation is measured by the reference used by the Deloitte public accounting office, namely "IFRS Presentation & Disclosure Checklist", and Bapepam regulation No. VIII G.7 concerning "Presentation and Disclosure of Financial Statements of Issuers or Public Companies.
Other studies are (Black & Maggina, 2016; Bryce, Ali, & Mather, 2015; Ferentinou & Anagnostopoulou, 2014; Hui & Tzu, 2014; Mousa & Desoky, 2014; Pelucio-Grecco, Geron, Grecco, & Lima, 2014) use a measure of adoption or not adoption with a dummy variable where the value is 1 (one) if adoption and 0 (zero) if not adoption.
The results of the study vary, among others, that the level of IFRS convergence affects the quality of earnings (Hui & Tzu, 2014) the quality of discretionary accruals before and after IFRS adoption, where accrual quality decreases after IFRS (Bryce et al., 2015) lower earnings management after IFRS adoption (Ferentinou & Anagnostopoulou, 2014), IFRS adoption does not have an influence on the quality of financial statements (Black & Maggina, 2016) companies that have a high level of compliance with IFRS mandatory disclosure, the relevance of financial statements seen from the regression of net income and stock prices as well the higher (Tsalavoutas & Dionysiou, 2014) during the IFRS period, there was an improvement in the quality of information. The accounting (Pelucio-Grecco et al., 2014) IFRS adoption increases the relevance of book value and decreases the relevance of profits (Beisland & Knivsflå, 2015) relevance Financial statements that are viewed from the regression of net income and stock prices increase after the adoption of IFRS (Mousa & Desoky, 2014).
The above studies focus on the investigation of financial reporting quality in countries directly adopting IFRS. However, very few studies research on the effect of IFRS convergence, and the results are mixed. For example, Wu, Li, and Lin (2014)examine the effects of a series of harmonization and convergence with IFRS
on the timeliness of recognition of earnings in emerging Chinese markets. They find that earnings reported under Chinese GAAP have a lower earnings response coefficient, but a higher future earnings response coefficient, than earnings reported under IFRS before Chinese GAAP converged with IFRS in 2007. This indicates that earnings reported under Chinese GAAP are generally less timely than earnings reported under IFRS before convergence. They also find that the future earnings response coefficient of earnings reported under Chinese GAAP continues to increase, indicating that the timeliness of recognition of earnings reported under Chinese GAAP worsened after a series of harmonization and convergence with IFRS in China. Taken together, Wu et al. (2014) provide evidence indicating that harmonizing and converging national accounting standards with IFRS in emerging capital markets may not necessarily increase accounting quality.
3. Methodology
The data collected in this study is quantitative, and the data source is secondary data. The population in the study are exposed companies with general PSAK (not ETAP - Entities without Public Accountability) registered in LQ45 in 2016. This research is causal research because this research will describe the causal relationship or cause of one or more problems such as which is stated in the formulation of the problem (Sekaran, 2013). This study is based on the time horizon (dimension) is cross-sectional, where cross-sectional uses a snapshot approach or observation is done at a certain time (Manurung, 2011). The research sample was selected using a purposive sampling method with 45 companies in Indonesia for financial reporting that had used the 2015-2016 PSAK. Data analysis techniques in the study are analysis of index variables of IFRS implementation and firm value. The research model that can be tested empirically is as follows:
EVA = α + βIFRS + e Where,
EVA = Economic Value Added = Net Profit - Weighted Average Cost of Capital * (Long-term Debt + Equity)
IFRS = IFRS Implementation Level, where:
Table-1. Guidance of IFRS Implementation Index.
Value 1 Value of 0 Not Applicable (N/A)
In accordance with PSAK as
of January 1, 2017 Not in accordance with PSAK as of January 1, 2017 The company does not have transactions related to the PSAK in question
3.1. Index of IFRS Implementation
The development results to calculate the IFRS implementation index are as follows: Table-2. Items of IFRS Implementation Index.
No PSAK Question Value 1 Value of 0 N/A
1 1 Name of the report that presents the position of assets, liabilities and equity.
Statement of financial
position Others N/A
2 1 Report name that presents
information on profit or loss Statement of profit and loss and other comprehensive income
Others N/A
3 4 The method used for separate
financial statements a. acquisition cost b. in accordance with PSAK 55
c. using the equity method
Others N/A
4 10 Treatment of foreign exchange differences from the translation of foreign currency statements
Other comprehensive income (OCI) from the translation of reports in foreign currency to the reporting currency is presented as unrealized gains or losses in the statement of profit or loss and other comprehensive income in the OCI section below net income and appears in the equity section
5 13 Measurement of investment
property Investment property is measured by choice of cost models or fair value models and is considered an indication of impairment
Others N/A
6 14 Inventory cost formula Inventory costs,
calculated using the first outbound fee formula (MPKP) or weighted average.
Others N/A
7 16 Measurement of fixed assets The entity chooses the cost model or revaluation model as its accounting policy and applies the policy to all fixed assets in the same class. If the carrying amount of an asset increases as a result of a revaluation, then the increase is recognized in other comprehensive income and accumulated in equity in the portion of the revaluation surplus.
Others N/A
8 19 Measurement of intangible
assets The entity chooses a cost model or revaluation model as its accounting policy.
Others N/A
9 19 Measurement of Goodwill The company examines the decline in Goodwill value on an annual basis
Others N/A
10 24 The measurement of the employee benefits program is a definite benefit.
The remeasurement of liabilities (assets) net defined benefits due to
changes in the
assumptions of actuaries is included in other comprehensive income
Others N/A
11 28 Related to the liability of the
insurance company The company tests the adequacy of liabilities at the end of the reporting period using the gross premium reserve (GPR) method for which all estimated present value of cash in and out (premiums, claims, or benefits and costs) are taken into account.
Others N/A
12 30 Criteria used by the company
in determining finance leases Individually or jointly has the following characteristics:
a. lease transfers ownership of assets to the lessee at the end of the lease term.
b. Lessees have the option to buy assets at prices that are estimated to be quite low compared to the fair value on the date
the option starts to be implemented so that at the beginning of the lease it can be ascertained that the option can be implemented.
c. The lease term is for most of the economic life of the asset even though the ownership rights are not transferred.
d. At the beginning of the lease, the present value of the minimum lease payments is substantially close to all the fair value of the leased assets. e. Rental assets are special, and only lessees can use them without the need for material modifications.
13 36 Related to life insurance
company liabilities The company tests the adequacy of liabilities at the end of the reporting period using the gross premium reserve (GPR) method for which all estimated present value of cash in and out (premiums, claims, or benefits and costs) are taken into account.
Others N/A
14 38 The difference between the amount of consideration transferred and the carrying amount of each business combination transaction between entities under common control
Presented in additional
paid-in capital Others N/A
15 46 The company measures
deferred tax assets and liabilities
Measure deferred tax assets and liabilities at tax rates and DPP consistently with expectations in recovering or completing assets or liabilities. The company does not measure deferred tax assets and liabilities N/A 16 50/55
/60 Gains or losses on financial assets classified as available for sale
Recognized in other comprehensive income until the asset is derecognized. At that time the cumulative gain or loss previously recognized in other comprehensive income is reclassified from equity to profit or loss as a reclassification
adjustment.
Others N/A
17 50/55
designated as an effective hedge is recognized in other comprehensive income
18 58 Measurement of non-current
assets as owned for sale At a lower value between the carrying amount and fair value less costs to sell
Others N/A
19 61 Accounting treatment for
government grants Government grants are recognized in a systematic profit and loss basis as long as the period of the entity recognizes as expenses on related costs intended to be compensated by grants
Others N/A
20 65 Ownership terms used in consolidated financial statements
Non-controlling interests Others N/A 21 66 Accounting treatment in
venturers in joint ventures The recognizes its interest in joint venture a joint venture as an investment and records the investment using the equity method in accordance with PSAK 15
Others N/A
4. Results and Discussion
Normality Test, Ghozali (2013) states that the normality test is to test whether the regression model, the independent variable and the dependent variable have normal or abnormal data distribution.
Figure-1. Distribution of Kolmogorov Smirnov Normality Test.
From the Histogram image above, it can be obtained that the data form bells as a characteristic of the normal distribution. Whereas from the Normal P-p plot the data is obtained spread near the diagonal line and follow the direction of the diagonal line. From the two images above, it can be concluded that the company value data using Economic Value Added (EVA) is normally distributed.
Table-3. Result of Autocorrelation Test.
Model R R Square Adjusted R Square Std. Error of the Estimate Durbin-Watson
1 .054a .003 -.020 .003 2.109
Predictors: (Constant), IFRS. Dependent Variable: EVA.
Based on the results of the correlation test above in Table 3 the results of the autocorrelation test, obtained DW-count value of 1.248 this value will be compared with a significant table value of 5% with the number of samples (n) 45 and the number of variables (k) as much as 1, then obtained DW values as large as 2,109 so that dl <DW <du is 1.2498 <2.109 <1.6148 based on the criteria for the table of Durbin-Watson test values, this result shows that there is no positive autocorrelation meaning that the regression model of this study is free from autocorrelation.
Multicollinearity test aims to test whether the regression model found the correlation between independent variables (Ghozali, 2013). The approach used to test the presence or absence of multicollinearity by Variance Inflation Factor test (VIF), with analysis if the tolerance value> 0.10 and VIF <10, it means that there is no multicollinearity in the study or if the tolerance value <0.10 and VIF> 10, it means that there is multicollinearity in the study.
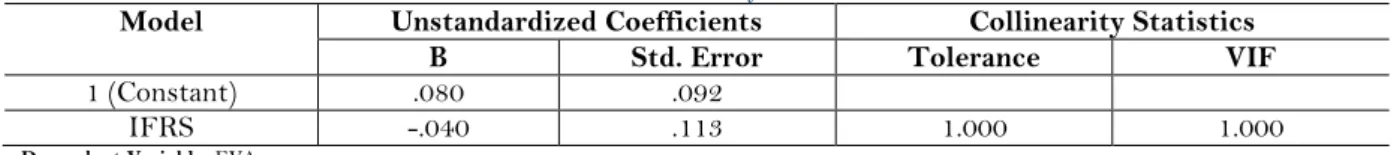
Table-4. Multicollinearity Test Results.
Model Unstandardized Coefficients Collinearity Statistics
B Std. Error Tolerance VIF
1 (Constant) .080 .092
IFRS -.040 .113 1.000 1.000
Dependent Variable: EVA.
The test results from Table 4 Multicollinearity Test, show that none of the independent variables has a tolerance value of less than 0.10. The results of the calculation of VIF values also show the same thing, that there are no independent variables that have a VIF value of more than 10. So, it can be concluded that there is no multicollinearity between independent variables in the regression model.
Heteroscedasticity test aims to test whether in the regression model there is variance and residual inequality one observation to another observation (Ghozali, 2013).
Table-5. Heteroscedasticity Test Results.
Model Unstandardized Coefficients Standardized Coefficients t Sig
B Std. Error Beta
1 (Constant) .080 .092 .872 .388
IFRS -.040 .113 -.054 -.355 .725
Dependent Variable: EVA.
The test results in Table 5 of the Heteroscedasticity Test Results above show that the regression model used in this study does not occur heteroscedasticity, which can be seen the significance level for all variables above 0.05 or 5%. If the independent variable significantly influences the dependent variable indicated by a significance of less than 5%, the regression model does not occur heteroscedasticity.
5. Multiple Regression Analysis
Hypothesis testing is intended to decide whether to accept or reject the hypothesis based on the data obtained from the research sample to determine the magnitude of the relationship between the variables under study. The statistical test consists of a test of the coefficient of determination (R2), simultaneous test (Test F) and Partial Test (Test T). Following the results of the hypothesis test:
The coefficient of determination (R2) is useful to test how far the ability of the research model in explaining the dependent variable (Ghozali, 2013). The R2 value that has been adjusted is between 0 and up to 1. The R2 value that approaches 1 means the ability of the independent variables to provide almost all the information needed to predict the dependent variable. R2 values below 0.5 means that the ability of independent variables to explain the dependent variable is very small (Ghozali, 2013).
Table-6. Determination Test Results.
Model R R Square Adjusted R Square Std. Error Estimate
1 .054a .003 -.020 .0835490
a. Predictors: (Constant), IFRS.
b. Dependent Variable: EV.
Table 6 results of the determination test, with the value of R-Square of 0.3 or 3%, meaning that 99.7% obtained from other variables (Managerial Ownership, Return on Invested Capital, Intellectual Capital and tangible assets) outside of this case indicates that the ability of the independent variable is, Index of IFRS Implementation and Effect.
F statistical test shows whether the independent variables included in the model influence the dependent variable (Ghozali, 2013). The F test is used to test the effect of the Independent variable on the IFRS implementation index and its effect on Company Value. The simultaneous results of this study can be seen in Table 7, below.
Table-7. Test Results F.
Model Sum of Squares df Mean Square F Sig
1 Regression .001 1 .001 .126 .725a
Residual .300 43 .007
Total .301 44
a. Predictors: (constant), IFRS.
b. Dependent Variable: EVA.
The test results in Table 7 the results of the determination test shows the value of F calculated at 0.126 is expressed by a positive sign, while the F table value is 4.06. The value statistically shows a significant result at α = 0.05, which is equal to 0,000 which means that the significance value is 0.725> 0.05. This shows that simultaneously independent variables do not have a significant effect on the dependent variable, namely the IFRS Implementation Index and its influence so that the H1 in this study is rejected.
Partial Coefficient (t-test), Ghozali (2013) partial test shows how far the influence of an independent variable individually in explaining the dependent variable. Testing is done by using a significance level of 0.05 (α = 5%). Acceptance or rejection of the hypothesis is done if t count> t table or probability <level of significance (Sig <0.05), then Ha is accepted and Ho has rejected means that the independent variable affects the dependent variable. If t count <t table or probability> level of significance (Sig> 0.05), then Ha is rejected and Ho accepted means that the independent variable does not affect the dependent variable. The results of the t-test (hypothesis testing) in this study can be seen in Table 8.
Table-8. Hypothesis Test Results.
Variable Coefficient
Regression Standard Error t-value Probability Value
IFRS -0.040 0.113 -0.355 0.725
Dependent Variables: EVA (Economic Value Added).
The results of the discussion of hypothesis testing say IFRS Implementation variables are statistically at α = 0.5 that is with a probability value of 0.725. This is known with a statistical value of -0.355 stated with a negative sign then the relationship between IFRS implementation variables has a significant negative effect on firm value through economic value added (EVA). This shows that the implementation of IFRS and its influence has no relationship to the value of the Company through economic value added (EVA), where the cost of the model in the company is not able to increase with the development and implementation of IFRS in Indonesia, but otherwise other factors such as ownership, intellectual capital, Tangible resources and leverage affect the IFRS implementation in Indonesia. Adibah, Anuar, van Zijl, and Dunstan (2013) states in his research that IFRS adoption influences earnings quality as measured by low earnings management and high value of relevance. Syarif and Danil (2015) stated in their research that IFRS convergence in a country influences earnings quality which is consistent with the results of previous studies.
6. Conclusion
Based on the results of data analysis that has been previously stated, the conclusions of the research on the development of IFRS implementation index and its effect on corporate value in Indonesian 2015, that the IFRS implementation index and its influence have a negative and significant impact on corporate value through Economic Value Added (EVA) to companies that using PSAK in Indonesia. This means that when IFRS implementation is implemented in Indonesia, it does not affect net income.
References
Adibah, W. I. W., Anuar, K. K., van Zijl, T., & Dunstan, K. (2013). Earnings quality and the adoption of IFRS-based accounting standards: Evidence from an emerging market. Asian Review of Accounting, 21(1), 53-73.
Anna, B., & Anna, K. (2016). Factors creating economic value added of mining company. Archives of Mining Sciences, 61(1), 109-123.
Beisland, L. A., & Knivsflå, K. H. (2015). Have IFRS changed how stock prices are associated with earnings and book values? Evidence from Norway. Review of Accounting and Finance, 14(1), 41-63.
Black, E. L., & Maggina, A. (2016). The impact of IFRS on financial statement data in Greece. Journal of Accounting in Emerging Economies, 6(1), 69-90.
Bryce, M., Ali, M. J., & Mather, P. R. (2015). Accounting quality in the pre-/post-IFRS adoption periods and the impact on audit committee effectiveness—Evidence from Australia. Pacific-Basin Finance Journal, 35, 163-181.
Butler, M., Leone, A., & Willenborg, M. (2004). An empirical analysis of auditor reporting and its association with abnormal accruals. Journal of Accounting an Economics, 37, 139-165.
Fardhina, F., & Retno, K. (2013). Analysis of ownership structure effect on economic value added. International Journal of Administrative Science & Organization, 20(3), 171-179.
Fauziah, I. (2015). The effect of the corporate governance mechanism on the compliance level of post-convergence IFRS mandatory disclosure. Essence: Business and Management Journal, 5(2), 279-304.
Ferentinou, A. C., & Anagnostopoulou, S. C. (2014). Accrual-based and real earnings management before and after IFRS adoption; the case of Greece. Journal of Applied Accounting Research, 17(1), 2-23.
Ghozali, I. (2013). Application of multivariate analysis with the IBM SPSS 21 program. Issue 7. Semarang: Diponegoro University Publisher.
Gunawan, S., & Eka, R. H. (2016). The role of corporate governance structure in compliance levels of mandatory disclosure period after IFRS convergence (Study of Manufacturing Companies Listed on the Indonesia Stock Exchange). Periodic Journal of Indonesian Accounting and Finance, 1(1), 71-83.
Hajiha, Z., & Farhani, M. G. (2011). The effect of ownership structure on economic value added. American Journal of Scientific Research, 1(1), 96-107.
Hui, S. K., & Tzu, H. W. (2014). The effect of IFRS, information asymmetry and corporate governance on the quality of accounting information. Asian Economic and Financial Review, 4(2), 226-256.
Manurung, A. H. (2011). Research methods: Finance, investment, and empirical accounting. Jakarta: PT. Adler Manurung Press. Mousa, G. A., & Desoky, A. M. (2014). The value relevance of international financial reporting standards (IFRS): The case
of the GCC countries. Journal of Accounting, Finance and Economics, 4(2), 16-28.
Pelucio-Grecco, M. C., Geron, C. M. S., Grecco, G. B., & Lima, J. P. C. (2014). The effect of IFRS on earnings management in Brazilian non-financial public companies. Emerging Market Review, 21, 42-66.
Rohaeni, T., & Aryati, T. (2012). The effect of IFRS convergence on income smoothing with audit quality as a moderating variable: Analysis in Indonesia. Singapore, and China: SNA 15 Banjarmasin.
Sekaran, U. (2013). Research method for business: A skill building approach (6th ed.): Wiley.
Supriyono, E., Achmad, A. M., & Joko, S. (2014). Effect of corporate governance on the compliance level of IFRS convergence in Indonesia. SNA 17 Lombok. 1-23.
Syarif, F., & Danil, A. (2015). The impact of IFRS adoption on profit management and the role of corporate governance mechanisms in Indonesian Banking. SNA 18 Medan.
Tsalavoutas, I., & Dionysiou, D. (2014). Value relevance of IFRS mandatory disclosure requirements. Journal of Applied Accounting Research, 15(1), 22-42.
Wibowo, S. (2009). Factors affecting value shareholders in issuers of LQ45 categories on the Indonesia stock exchange with economic value added. Indonesian Journal of Management, 9(2), 65-78.
Wu, G. S. H., Li, S. H., & Lin, S. (2014). The effects of harmonization and convergence with IFRS on the timeliness of earnings reported under Chinese GAAP. Journal of Contemporary Accounting and Economics, 10(2), 148-159. Young, S. D., & O’Byrne, S. F. (2000). EVA and value-based management: A practical guide to implementation: McGraw-Hill.