A Distributed Tree Data Structure For
Real-Time OLAP On Cloud Architectures
F. Dehne
1, Q. Kong
2, A. Rau-Chaplin
2, H. Zaboli
1, R. Zhou
1 1 School of Computer Science, Carleton University, Ottawa, Canada 2 Faculty of Computer Science, Dalhousie University, Halifax, CanadaE-mail: [email protected], [email protected], [email protected] [email protected], [email protected]
Abstract—In contrast to queries for on-linetransaction pro-cessing (OLTP) systems that typically access only a small portion of a database, OLAP queries may need to aggregate large portions of a database which often leads to performance issues. In this paper we introduce CR-OLAP, a Cloud based Real-time OLAP system based on a new distributed index structure for OLAP, the distributed PDCR tree, that utilizes a cloud infrastructure consisting of (m+ 1) multi-core processors. With increasing database size, CR-OLAP dynamically increases m to maintain performance. Our distributed PDCR tree data structure supports multiple dimension hierarchies and efficient query processing on the elaborate dimension hierarchies which are so central to OLAP systems. It is particularly efficient for complex OLAP queries that need to aggregate large portions of the data warehouse, such as “report the total sales in all stores located in California and New York during the months February-May of all years”. We evaluated CR-OLAP on the Amazon EC2 cloud, using the TPC-DS benchmark data set. The tests demonstrate that CR-OLAPscales well with increasing number of processors, even for complex queries. For example, on an Amazon EC2 cloud instance with eight processors, for a TPC-DS OLAP query stream on a data warehouse with 80 million tuples where every OLAP query aggregates more than 50% of the database,CR-OLAPachieved a query latency of 0.3 seconds which can be considered areal time response.
I. INTRODUCTION
On-line analytical processing (OLAP) systems are at the
heart of many business analytics applications. This paper reports on the results of a research project (supported by the IBM Centre For Advanced Studies Canada) to investigate the use ofcloud computingfor high performance,real-timeOLAP.
A. Background
Decision Support Systems (DSS) are designed to empower the user with the ability to make effective decisions regarding both the current and future state of an organization. DSS allow users to study relationships in a chronological context between things such as customers, vendors, products, inventory, geogra-phy, and sales. One of the most powerful and prominent tech-nologies for knowledge discovery in DSS environments is on-line analytical processing (OLAP). OLAP is the foundation for a wide range of essential business applications, including sales and marketing analysis, planning, budgeting, and performance measurement [1], [2]. By exploiting multi-dimensional views of the underlying data warehouse, the OLAP server allows users to “drill down” or “roll up” on dimension hierarchies, “slice and dice” particular attributes, or perform various sta-tistical operations such as ranking and forecasting. To support
this functionality, OLAP relies heavily upon a classical data model known as the data cube [3] which allows users to view organizational data from different perspectives and at a variety of summarization levels. It consists of the base cuboid, the finest granularity view containing the full complement of d
dimensions (or attributes), surrounded by a collection of2d−1
sub-cubes/cuboids that represent the aggregation of the base cuboid along one or more dimensions.
In contrast to queries for on-line transaction processing (OLTP) systems which typically access only a small portion of the database (e.g. update a customer record), OLAP queries may need to aggregate large portions of the database (e.g. calculate the total sales of a certain type of items during a certain time period) which may lead to performance issues. Therefore, most of the traditional OLAP research, and most of the commercial systems, follow the staticdata cube approach proposed by Gray et al. [3] and materialize all or a subset of the cuboids of the data cube in order to ensure adequate query performance. Building the data cube can be a massive computational task, and significant research has been published on sequential and parallel data cube construction methods (e.g. [4], [5], [3], [6], [7], [8]). However, the traditional static data cube approach has several disadvantages. The OLAP system can only be updated periodically and in batches, e.g. once every week. Hence, latest information can not be included in the decision support process. The static data cube also requires massive amounts of memory space and leads to a duplicate data repository that is separate from the on-line transaction pro-cessing (OLTP) system of the organization. Practitioners have therefore called for some time for an integrated OLAP/OLTP approach with a real-time OLAP system that gets updated instantaneously as new data arrives and always provides an up-to-date data warehouse for the decision support process (e.g. [9]). Some recent publications have begun to address this prob-lem by providing “quasi real-time” incremental maintenance schemes and loading procedures for static data cubes (e.g. [9], [10], [11], [12]). However, these approaches are not fully real-time. A major obstacle are significant performance issues with large scale data warehouses.
B. Contributions
The aim of our research project is to help address the above mentioned performance issues for real-time OLAP systems through the use of efficient parallel computing methods. In a recent paper [13] we presented the first parallel real-time OLAP system designed to be executed on a multi-core
with increasing number of processor cores. Our system won the 2012 IBM Canada Research Impact Of The Year Award
and an IBM sponsored patent application has been submitted. In this paper, we report on the next phase of our project: to scale up our real-time OLAP system to utilize a collection of
(m+ 1)multi-core processors in a cloudenvironment. We introduce CR-OLAP, a Cloud based Real-time OLAP
system that utilizes a new distributed index structure for OLAP, refered to as adistributed PDCR tree. This data structure is not just another distributed R-tree, but rather a multi-dimensional data structure designed specifically to support efficient OLAP query processing on the elaborate dimension hierarchies that are central to OLAP systems. The distributed PDCR tree, based on the sequential DC tree introduced by Kriegel et al. [14] and our previous PDC tree [13], exploits knowledge about the structure of individual dimension hierarchies both for compact data representation and accelerated query processing. The following is a brief overview of the properties of our system.
Consider ad-dimensional data warehouse withddimension hierarchies. CR-OLAP supports an input stream consisting of
insert andqueryoperations. Each OLAP query can be
repre-sented as an aggregate range query that specifies for each di-mension either a single value or range of values at any level of the respective dimension hierarchy, or a symbol “*” indicating the entire range for that dimension.CR-OLAPutilizes a cloud infrastructure consisting ofm+ 1multi-core processors where each processor executes up to k parallel threads. As typical for current high performance databases, all data is kept in the processors’ main memories [15]. With increasing database size, CR-OLAP will increase m by dynamically allocating additional processors within the cloud environment and re-arranging the distributed PDCR tree. This will ensure that both, the available memory and processing capability will scale with the database size. One of the m+ 1multi-core processors is referred to as the master, and the remainingmprocessors are called workers. The master receives from the users the input stream of OLAP insert andquery operations, and reports the results back to the users (in the form of references to memory locations where the workers have deposited the query results). In order to ensure high throughput and low latency even for compute intensive OLAP queries that may need to aggregate large portions of the entire database,CR-OLAPutilizes several levels of parallelism: distributed processing of multiple query and insert operations among multiple workers, and parallel processing of multiple concurrent query and insert operations within each worker. For correct query operation, CR-OLAP
ensures that the result for each OLAP query includes all data inserted prior but no data inserted after the query was issued within the input stream.
CR-OLAPis supported by a new distributed index structure
for OLAP termed distributed PDCR tree which supports distributed OLAP query processing, including fast real-time data aggregation, real-time querying of multiple dimension hierarchies, and real-time data insertion. (Note that, since OLAP is about the analysis of historical data collections, OLAP systems do usually not support data deletion.) The distributed index structure consists of a collection of PDCR trees whereby the master stores one PDCR tree (called hat) and each worker stores multiple PDCR trees (calledsubtrees). Each individual PDCR tree supports multi-core parallelism and
executes multiple concurrentinsertandqueryoperations at any point in time. PDCR trees are a non-trivial modification of the authors’ previously presented PDC trees [13], adapted to the cloud environment. For example, PDCR trees are array based so that they can easily be compressed and transferred between processors via message passing. When the database grows and new workers are added, sub-trees are split off and sent to the new worker.
We evaluated CR-OLAP on the Amazon EC2 cloud for a multitude of scenarios (different ratios of insert and query transactions, query transactions with different sizes of results, different system loads, etc.), using the TPC-DS “Decision Support” benchmark data set. The tests demonstrate that CR-OLAP scales well with increasing number of workers. For example, for fixed data warehouse size ( 10,000,000 data items), when increasing the number of workers from 1 to 8, the average query throughput and latency improves by a factor 7.5. A particular strength of CR-OLAP is to efficiently answer queries with large query coverage, i.e. the portion of the database that needs to be aggregated for an OLAP query. For example, on an Amazon EC2 cloud instance with eight workers and a stream of OLAP queries on a data warehouse with 80 million tuples, where each query has more than 50% coverage, CR-OLAPachieved a query latency of 0.3 seconds, which can be considered areal time response.
CR-OLAP also handles well increasing dimensionality of
the data warehouse. For tree data structures this is a critical issue as it is known e.g. for R-trees that, with increasing num-ber of dimensions, even simple range search (no dimension hierarchies, no aggregation) can degenerate to linear search (e.g. [16]). In our experiments, we observed that increasing number of dimensions does not significantly impact the per-formance ofCR-OLAP. Another possible disadvantage of tree data structures is that they are potentially less cache efficient than in-memory linear search which can make optimum use of streaming data between memory and processor caches. To establish a comparison baseline for CR-OLAP, we imple-mentedSTREAM-OLAPwhich partitions the database between multiple cloud processors based on one chosen dimension and uses parallel memory to cache streaming on the cloud processors to answer OLAP queries. We observed that the performance of CR-OLAP is similar to STREAM-OLAP for simple OLAP queries with small query coverage but that CR-OLAP vastly outperforms STREAM-OLAP for more complex queries that utilize different dimension hierarchies and have a larger query coverage (e.g. “report the total sales in all stores located in California and New York during the months February-May of all years”).
The remainder of this paper is organized as follows. In Section II we review related work. In Section III we introduce the PDCR tree data structure and in Section IV we present our
CR-OLAP system for real-time OLAP on cloud architectures.
Section V shows the results of an experimental evaluation
of CR-OLAP on the Amazon EC2 cloud, and Section VI
concludes the paper.
II. RELATEDWORK
In addition to the related work discussed in the introduc-tion, there are many efforts to store and query large data sets in cloud environments. Hadoop[17] and its file system, HDFS,
are popular examples of such systems which are typically built on MapReduce [18]. Related projects most similar to our work are Hive[19] and HadoopDB[20]. However, these systems arenotdesigned forreal-time(OLTP style) operation. Instead, they use batch processing similar to [9], [10], [11], [12]. The situation is similar for BigTable[21], BigQuery[22], and Dremel[23]. In fact, Dremel[23] uses a columnar data representation scheme and is designed to provide data ware-housing and querying support for read-only data. To overcome the batch processing in Hadoop based systems, Storm [24] introduced a distributed computing model that processes in-flight Twitter data. However, Storm assumes small, compact Twitter style data packets that can quickly migrate between different computing resources. This is not possible for large data warehouses. For peer-to-peer networks, related work includes distributed methods for querying concept hierarchies such as [25], [26], [27], [28]. However, none of these meth-ods provides real-time OLAP functionality. There are various publications on distributed B-trees for cloud platforms such as [29]. However, these method only supports 1-dimensional indices which are insufficient for OLAP queries. There have been efforts to build distributed multi-dimensional indices on
Cloudplatforms based on R-trees or related multi-dimensional
tree structures, such as [30], [31], [32]. However, these method do not support dimension hierarchies which are essential for OLAP queries.
III. PDCR TREES
Consider a data warehouse with the fact table F and a set of d dimensions {D1, D2, ..., Dd} where each dimension
Di,1 ≤ i ≤ d has a hierarchy Hi including hierarchical
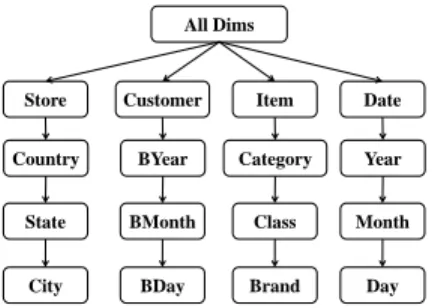
attributes corresponding to the levels of the hierarchy. The hierarchical attributes in the hierarchy of dimension i are organized as an ordered setHiof parent-child relationships in the hierarchy levels Hi ={Hi1, Hi2, ..., Hil} where a parent logically summarizes and includes its children. Figure 1 shows the dimensions and hierarchy levels of each dimension for a
4-dimensional data warehouse.
All Dims Item Customer Store Date Country State City BYear BMonth BDay Category Class Brand Year Month Day
Fig. 1. A 4-dimensional data warehouse with 3 hierarchy levels for
each dimension. The first box for each dimension denotes the name of the dimension.
The sequential DC tree introduced by Kriegel et al. [14]
exploits knowledge about the structure of individual dimension hierarchies both for compact data representation and accel-erated OLAP query processing. In our previous work [13], we introduced the PDC tree, a parallel DC tree for a single multi-core processor. In this section, we outline a modified PDC tree, termed PDCR tree, which will become the building block for our CR-OLAP system. Here, we only outline the differences between the PDCR tree and its predecessors, and
we refer to [13], [14] for more details. We note that, our PDCR tree data structure is not just another distributed R-tree, but rather a multi-dimensional data structure designed specifically to support efficient OLAP query processing on the elaborate dimension hierarchies that are central to OLAP systems.
For a cloud architecture with multiple processors, each processor will store one or more PDCR trees. Our CR-OLAP
system outlined in the following Section IV requires that a sub-tree of a PDCR sub-tree can be split off and transferred to another processor. This required us to (a) devise an array based tree implementation that can be packed into a message to be sent between processors and (b) a careful encoding of data values, using compact IDs related to the different dimension hierarchy levels. In the following we outline some details of the encoding used for the PDCR tree.
IDs for each dimension represent available entities in the dimension. Each dimension has a hierarchy of entities with
l levels. In the example of Figure 1, an ID may represent an entity at the Country level for the Store dimension, e.g. US or Canada. Similarly, another ID may represent an entity at the City level, e.g. Chicago or Toronto. It is important to note that an ID may summarize many IDs at lower hierarchy levels. To build an ID for a dimension withllevels, we assign
bj bits to the hierarchy level j, 0 ≤ j ≤ l−1. Different
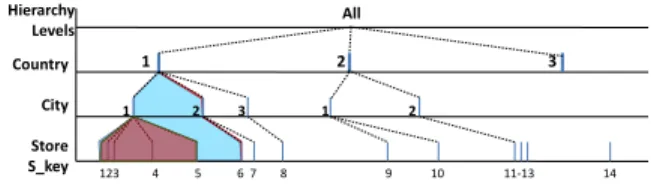
entities at each hierarchy level are assigned numerical values starting with “1”. By concatenating the numerical values of the levels, a numerical value is created. We reserve the value zero to represent “All” or “*”. The example in Figure 2 shows an example of an entity at the lowest hierarchy level of dimension Store. An ID for the state California will have a value of zero for its descendant levels CityandStore S key. As a result, containment of IDs between different hierarchy levels can be tested via fast bit operations. Figure 3 illustrates IDs and their coverages in the Store dimension with respect to different hierarchy levels. As illustrated, each entity in level
j (Country) is a country specified by a numerical value and
covers cities that are represented using numerical values in level j + 1. Note that IDs used for cities will have specific values at the city level, while the ID of a country will have a value of zero at the city level and a specific value only at the country level.
The sequential DC tree introduced by Kriegel et al. [14]
and our previous PDC tree [13] store so called “minimum describing set” (MDS) entries at each internal tree node to guide the query process; see [14] for details. The MDS concept was developed in [14] to better represent unordered dimensions with dimension hierarchies. Experiments with our
CR-OLAP system showed that in a larger cloud computing
environment with multiple tree data structures, the number of MDS entries becomes very large and unevenly distributed between the different trees, leading to performance bottlenecks. On the other hand, the bit representation of IDs outlined above gives us the opportunity to convert unordered dimensions into ordered dimensions, and then use traditional ranges instead of the MDS entries. An example is shown in Figure 4. The ranges lead to a much more compact tree storage and alleviated the above mentioned bottleneck. It is important to note that, this internal ordering imposed on dimensions is invisible to the user. OLAP queries can still include unordered aggregate values on any dimension such as “Total sales in the US and
Level 0 Level 1 Level 2 . . . Level l
Store US California Los Angels Store S_key
01 01 1001 101 1011011
b0 bits b1 bits b2 bits bl bits
Fig. 2. Illustration of the compact bit representation of IDs.
1 2 3 Country City Store S_key 1 2 3 1 2 123 4 5 6 7 8 9 10 11-13 14 Hierarchy Levels All
Fig. 3. Example of relationships between different hierarchy levels of a given dimension.
IV. CR-OLAP: CLOUD BASEDREAL-TIMEOLAP
CR-OLAPutilizes a cloud infrastructure consisting ofm+1
multi-core processors where each processor executes up to k
parallel threads. One of the m+ 1 multi-core processors is referred to as the master, and the remaining m processors are called workers. The master receives from the users the input stream of OLAPinsertandqueryoperations, and reports the results back to the users (in the form of references to memory locations where the workers have deposited the query results). In order to ensure high throughput and low latency even for compute intensive OLAP queries that may need to aggregate large portions of the entire database, CR-OLAP
utilizes several levels of parallelism: distributed processing of multiple query and insert operations among multiple workers, and parallel processing of multiple concurrent query and insert operations within each worker. With increasing database size, CR-OLAP will increase m by dynamically allocating additional processors within the cloud environment and re-arranging the distributed PDCR tree. This will ensure that both, the available memory and processing capability will scale with the database size.
We start by outlining the structure of a distributed PDC
tree and PDCR treeonm+ 1multi-core processors in a cloud
environment. Consider a single PDCR treeT storing the entire database. For a tunabledepthparameterh, we refer to the top
h levels ofT as the hatand we refer to the remaining trees rooted at the leaves of thehatas thesubtreess1, . . . , sn. Level
his referred to as the cut level. The hatwill be stored at the
Root 1990-2000 US - Canada 2000-2013 US 2000-2013 UK - Germany . . . C1 1995-2000 California - Virginia 1993-2000 Canada C2 2000-2010 New York -Texas 2000-2013 California Cn 2000-2005 UK 2004-2013 Germany . . . . . . . . .
Fig. 4. Example of a PDCR tree with 2 dimensions (Store and Date).
master and the subtrees s1, . . . , sn will be stored at the m workers. We assume n≥m and that each worker stores one or more subtrees.
CR-OLAP starts with an empty database and one master
processor (i.e. m = 0) storing an empty hat (PDCR tree). Note that, DC trees [14], PDC trees [13] and PDCR trees are leaf oriented. All data is stored in leafs called data nodes. Internal nodes are called directory nodes and contain arrays with routing information and aggregate values. Directory nodes have a high capacity and fan-out of typically 10 - 20. As insert operations are sent toCR-OLAP, the size and height of thehat
(PDCR tree) grows. When directory nodes of the hat reach heighth, their children become roots at subtrees stored at new worker nodes that are allocated through the cloud environment. An illustration of such a distributed PDCR tree is shown in Figure 5. Insertion S1 S2 S3 S4 Query Hat Leaf Node
Fig. 5. Illustration of a distributed PDCR tree.
For a typical database size, the hat will usually contain only directory nodes and all data will be stored in the subtrees
s1, . . . , sn. After the initial set of data insertions, all leaf nodes
in the hat will usually be directory nodes of height h, and the roots of subtrees in workers will typically be directory nodes as well. As illustrated in Figure 5, bothinsertandquery
operations are executed concurrently.
Concurrent insert and query operations
Eachquery operation in the input stream is handed to the
master which traverses the hat. Note that, at each directory node the query can generate multiple parallel threads, depend-ing on how many child nodes have a non empty intersection with the query. Eventually, each query will access a subset of the hat’s leaves, and then the query will be transferred to the workers storing the subtrees rooted at those leaves. Each of those workers will then in parallel execute the query on the respective subtrees, possibly generating more parallel threads within each subtree. For more details see Algorithm 3 and Algorithm 4 in the Appendix.
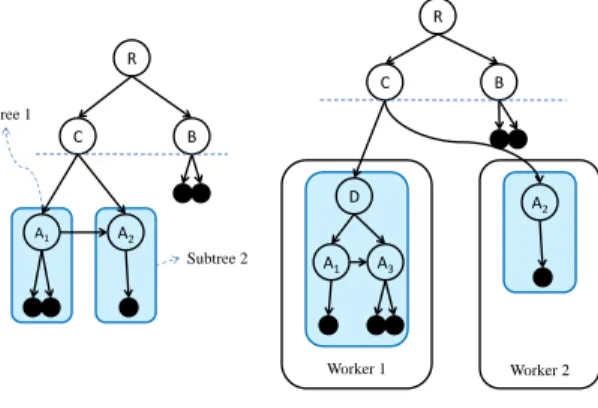
For each insert operation in the input stream, the master will search the hat, arriving at one of the leaf nodes, and then forward the insert operation to the worker storing the subtree rooted at that leaf. For more details see Algorithm 1 and Algorithm 2 in the Appendix. Figures 6 and 7 illustrate how new workers and new subtrees are added as more data items get inserted. Figures 6 illustrates insertions creating an overflow at node A, resulting in a horizontal split at
overflow atCthen triggers a vertical split illustrated in 7. This creates two subtrees in two different workers. As outlined in more details in the CR-OLAP “migration strategies” outlined below, new workers are requested from the cloud environment when either new subtrees are created or when subtree sizes exceed the memory of their host workers. Workers usually store multiple subtrees. However,CR-OLAPrandomly shuffles subtrees among workers. This ensures that query operations accessing a contiguous range of leaf nodes in thehatcreate a distributed workload among workers.
R A B Cut level c = 2 R C B A1 A2 (a) (b) Data Node Directory Node
Fig. 6. Insertions triggering creation ofnewworkers and subtrees. Part 1.
(a) Currenthat configuration. (b) Insertions create overflow at nodeAand
horizontal split. R C B A1 A2 Subtree 1 Subtree 2 R C B D A 2 Worker 1 A1 A3 Worker 2 (a) (b)
Fig. 7. Insertions triggering creation ofnewworkers and subtrees. Part 2.
(a) Same as Figure 6b with critical subtrees highlighted. (b) Insertions create
overflow at nodeCand vertical split, triggering the creation of two subtrees
in two different workers.
For correctreal timeprocessing of an input stream of mixed
insertandqueryoperations,CR-OLAPneeds to ensure that the
result for each OLAP query includes all data inserted prior but no data inserted after the query was issued within the input stream. We will now discuss how this is achieved in a distributed cloud based system where we have a collection of subtrees in different workers, each of which is processing multiple concurrent insert andquery threads. In our previous work [13] we presented a method to ensure correct query processing for a single PDC tree on a mutli-core processor, where multiple insert and query operations are processed concurrently. The PDC tree maintains for each data or directory item a time stamp indicating its most recent update, plus it maintains for all nodes of the same height a left-to-right linked list of all siblings. Furthermore, eachquerythread maintains a stack of ancestors of the current node under consideration, together with the time stamps of those items. We refer to [13] for more details. The PDCR tree presented in this paper
inherits this mechanism for each of its subtrees. In fact, the above mentioned sibling links are shown as horizontal links in Figures 6 and 7. With the PDCR tree being a collection of subtrees, if we were to maintain sibling links between subtrees to build linked list of siblings across all subtrees then we would ensure correct query operation in the same way as for the PDC tree [13]. However, since different subtrees of a PDCR tree typically reside on different workers, a PDCR tree only maintains sibling links inside subtrees but it doesnotmaintain sibling links between different subtrees. The following lemma show that correct real time processing of mixed insert and
query operations is still maintained.
Theorem 1. Consider the situation depicted in Figure 8
where the split of node B created a new node D and subtree rooted at D that is stored separately from the subtrees rooted at A andB. Then, the sibling links labelled “a” and “c” are not required forcorrectreal time query processing (as defined above).
Proof outline.A full case analysis is lengthy and omitted
due to space limitations. Here we only present the most interesting and critical case. Assume a thread for a query Q
that is returning from searching the subtree below B only to discover thatBhas been modified. LetBstackbe the old value
of B that is stored in the stack stack(Q) associated withQ. If neither B nor any ancestor of B are in stack(Q) then Q
does not contain any data covered by B. Otherwise, Q will follow the sibling link labelled “b” to find B0 and remaining data from the node split ofB.
P A D C B B’ a b c
Fig. 8. Illustration for Theorem 1.
Load balancing
CR-OLAP is executed on a cloud platform with (m+ 1)
processors (mworkers and one master). As discussed earlier,
CR-OLAP uses the cloud’s elasticity to increase m as the
number of data items increases. We now discuss in more detail CR-OLAP’s mechanisms for worker allocation and load balancing in the cloud. Theinsert operations discussed above create independent subtrees for each height hleaf of thehat. Since internal (directory) nodes have a high degree (typi-cally 10 - 20), a relatively small height of the hat typically leads to thousands of height hleaves and associated subtrees
s1, . . . , sn. The master processor keeps track of the subtree
locations and allocation of new workers, and it makes sure that a relatively high n/mratio is maintained.
As indicated above, CR-OLAP shuffles these n >> m
subtrees among the m workers. This ensures that threads of query operations are evenly distributed over the workers.
Furthermore, CR-OLAP performs load balancing among the workers to ensure both, balanced workload and memory uti-lization. The master processor keeps track of the current sizes and number of active threads for all subtrees. For each worker, its memory utilization and workload are the total number of threads of its subtrees and the total size if its subtrees, respectively.
If a worker w has a memory utilization above a certain threshold (e.g. 75% of its total memory), then the master processor determines the worker w0 with the lowest memory utilization and checks whether it is possible to store an addi-tional subtree from w while staying well below it’s memory threshold (e.g. 50% of its total memory). If that is not possible, a new worker w0 is allocated within the cloud environment. Then, a subtree from w is compressed and sent from w to
w0 via message passing. As discussed earlier, PDCR trees are implemented in array format and using only array indices as pointers. This enables fast compression and decompression of subtrees and greatly facilitates subtree migration between workers. Similarly, if a worker w has a workload utilization that is a certain percentage above the average workload of the
mworkers and is close to the maximum workload threshold for a single worker, then the master processor determines a worker
w0 with the lowest workload and well below its maximum workload threshold. If that is not possible, a new worker w0
is allocated within the cloud environment. Then, the master processor initiates the migration of one or more subtrees from
w (and possibly other workers) tow0.
V. EXPERIMENTALEVALUATIONONAMAZONEC2
Software
CR-OLAP was implemented in C++, using the g++
com-piler, OpenMP for multi-threading, and ZeroMQ [33] for message passing between processors. Instead of the usual MPI message passing library we chose ZeroMQ because it better supports cloud elasticity and the addition of new processors during runtime.CR-OLAPhas various tunable parameters. For our experiments we set the depth hof thehat to h= 3, the directory node capacity c to c = 10 for the hat and c = 15
for the subtrees, and the number k of threads per worker to
k= 16.
Hardware/OS
CR-OLAP was executed on the Amazon EC2 cloud. For
the master processor we used an Amazon EC2 m2.4xlarge instance: “High-Memory Quadruple Extra Large” with 8 vir-tual cores (64-bit architecture, 3.25 ECUs per core) rated at 26 compute units and with 68.4 GiB memory. For the worker processors we used Amazon EC2 m3.2xlarge instances: “M3 Double Extra Large” with 8 virtual cores (64-bit architecture, 3.25 ECUs per core) rated at 26 compute units and with 30 GiB memory. The OS image used was the standard Amazon CentOS (Linux) AMI.
Comparison baseline: STREAM-OLAP
As outlined in Section II, there is no comparison system for
CR-OLAPthat provides cloud based OLAP with fullreal time
capability and support for dimension hierarchies. To establish a comparison baseline for CR-OLAP, we therefore designed
and implemented a STREAM-OLAP method which partitions the database between multiple cloud processors based on one chosen dimension and uses parallel memory to cache streaming on the cloud processors to answer OLAP queries. More precisely,STREAM-OLAPbuilds a 1-dimensional index on one ordered dimension dstream and partitions the data into approx. 100 ×m arrays. The arrays are randomly shuffled between the m workers. The master processor maintains the 1-dimensional index. Each array represents a segment of the
dstream dimension and is accessed via the 1-dimensional
in-dex. The arrays themselves are unsorted, andinsertoperations simply append the new item to the respective array. For query
operations, the master determines via the 1-dimensional index which arrays are relevant. The workers then search those arrays via linear search, using memory to cache streaming.
The comparison between CR-OLAP (using PDCR trees)
and STREAM-OLAP(using a 1-dimensional index and
mem-ory to cache streaming) is designed to examine the tradeoff between a sophisticated data structure which needs fewer data accesses but is less cache efficient and a brute force method which accesses much more data but optimizes cache performance.
Test data
For our experimental evaluation of CR-OLAP and
STREAM-OLAP we used the standard TPC-DS “Decision
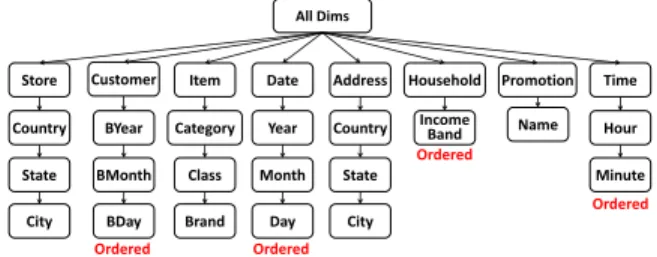
Support” benchmark for OLAP systems [34]. We selected “Store Sales”, the largest fact table available in TPC-DS. Figure 9 shows the fact table’s 8 dimensions, and the respective 8 dimension hierarchies below each dimension. The first box for each dimension denotes the dimension name while the boxes below denote hierarchy levels from highest to lowest. DimensionsStore,Item,Address, andPromotionare unordered dimensions, while dimensionsCustomer,Date,Householdand
Time are ordered. TPC-DS provides a stream of insert and
query operations on “Store Sales” which was used as input
forCR-OLAPandSTREAM-OLAP. For experiments where we
were interested in the impact of querycoverage(the portion of the database that needs to be aggregated for an OLAP query), we selected sub-sequences of TPC-DS queries with the chosen coverages.
All Dims
Item Customer
Store Date Address Household Promotion Time
Country Ordered Ordered Ordered Ordered State City BYear BMonth BDay Category Class Brand Year Month Day Country State City Income
Band Name Hour
Minute
Fig. 9. The 8 dimensions of the TPC-DS benchmark for the fact table
“Store Sales”. Boxes below each dimension specify between 1 and 3 hierarchy levels for the respective dimension. Some dimensions are “ordered” and the remaining are not ordered.
Test results: impact of the number of workers (m) for fixed
database size (N)
We tested how the time of insert and query operations
for CR-OLAPandSTREAM-OLAPchanges for fixed database
variable number of workers 1 ≤ m ≤ 8, we first inserted 40 million items (with d=8 dimensions) from the TPC-DS benchmark into CR-OLAP andSTREAM-OLAP, and then we executed 1,000 (insert or query) operations on CR-OLAP
and STREAM-OLAP. Since workers are virtual processors in
the Amazon EC2 cloud, there is always some performance fluctuation because of the virtualization. We found that the total (or average) of 1,000insertorqueryoperations is a sufficiently stable measure. The results of our experiments are shown in Figures 10, 11, and 12.
Figure 10 shows the time for 1,000 insertions in CR-OLAP(PDCR-tree) andSTREAM-OLAP(1D-index) as a func-tion of the number of workers (m). As expected, insertion times inSTREAM-OLAPare lower than inCR-OLAPbecause
STREAM-OLAPsimply appends the new item in the respective
array while CR-OLAP has to perform tree insertions with possible directory node splits and other overheads. However,
STREAM-OLAPshows no speedup with increasing number of
workers (because only one worker performs the array append operation) whereas CR-OLAP shows a significant speedup (because the distributed PDCR tree makes use of the multiple workers). It is important to note that insertion times are not visible to the users because they do not create any user response. What is important to the user are the response times for OLAP queries. Figure 11 shows the time for 1,000 OLAP queries in CR-OLAP and STREAM-OLAP as a function of the number of workers (m). Figure 12 shows the speedup measured for the same data. We selected OLAP queries with 10%, 60% and 95% query coverage, which refers to the percentage of the entire range of values for each dimension that is covered by a given OLAP query. The selected OLAP queries therefore aggregate a small, medium and large portion of the database, resulting in very different workloads. We observe in Figure 11 thatCR-OLAP significantly outperforms
STREAM-OLAPwith respect to query time. The difference in
performance is particularly pronounced for queries with small or large coverages. For the former, the tree data structure shows close to logarithmic performance and for the latter, the tree can compose the result by adding the aggregate values stored at a few roots of large subtrees. The worst case scenario for CR-OLAP are queries with medium coverage around 60% where the tree performance is proportional to N1−d1. However, even
in this worst case scenario, CR-OLAP outperforms STREAM-OLAP. Figure 12 indicates that both systems show a close to linear speedup with increasing number of workers, however
for CR-OLAP that speedup occurs for much smaller absolute
query times.
Test results: impact of growing system size (N &mcombined)
In an elastic cloud environment, CR-OLAPand STREAM-OLAP increase the number of workers (m) as the database size (N) increases. The impact on the performance of
in-sert and query operations is shown in Figures 13 and 14,
respectively. With growing system size, the time for insert
operations in CR-OLAP (PDCR-tree) approaches the time for
STREAM-OLAP (1D-index). More importantly however, the
time for queryoperations inCR-OLAP again outperforms the time for STREAM-OLAP by a significant margin, as shown in Figure 14. Also, it is very interesting that the for both systems, the query performance remains essentially unchanged with increasing database size and number of workers. This is
obvious for STREAM-OLAP where the size of arrays to be searched simply remains constant but it is an important obser-vation for CR-OLAP. Figure 14 indicates that the overhead incurred by CR-OLAP’s load balancing mechanism (which grows with increasing m) is balanced out by the performance gained through more parallelism. CR-OLAP appears to scale up without affecting the performance of individual queries.
Test results: impact of the number of dimensions
It is well known that tree based search methods can become problematic when the number of dimensions in the database in-creases. In Figures 15 and 16 we show the impact of increasing
d on the performance of insert and query operations in CR-OLAP (PDCR-tree) and STREAM-OLAP(1D-index) for fixed database size N = 40million and m= 8workers. Figure 15 shows some increase ininserttime forCR-OLAPbecause the PDCR tree insertion inherits from the PDC tree a directory node split operation with an optimization phase that is highly sensitive to the number of dimensions. However, the result of the tree optimization is improved query performance in higher dimensions. As shown in Figure 16, the more important time for OLAPquery operations grows only slowly as the number of dimensions increases. This is obvious for the array search
inSTREAM-OLAPbut for the tree search inCR-OLAPthis is
an important observation.
Test results: impact of query coverages
Figures 17, 18, 19, and 20 show the impact of query coverage on query performance in CR-OLAP (PDCR-tree)
andSTREAM-OLAP(1D-index). For fixed database sizeN =
40M il, number of workersm= 8, and number of dimensions
d = 8, we vary the query coverage and observe the query times. In addition we observe the impact of a “*” in one of the query dimensions. Figures 17 and 18 show that the “*” values do not have a significant impact for CR-OLAP. As discussed earlier, CR-OLAP is most efficient for small and very large query coverage, with maximum query time somewhere in the mid range. (In this case, the maximum point is shifted away from the typical 60% because of the “*” values.) Figures 19, and 20 show the performance ofSTREAM-OLAPas compared
to CR-OLAP (ratio of query times). It shows that CR-OLAP
consistently outperforms STREAM-OLAPby a factor between 5 and 20.
Test results: query time comparison for selected query patterns at different hierarchy levels
Figure 21 shows a query time comparison between CR-OLAP (PDCR-tree) and STREAM-OLAP (1D-index) for se-lected query patterns. For fixed database size N = 40M il, number of workers m= 8andd= 8dimensions, we test for dimensionDatethe impact of value “*” for different hierarchy levels.CR-OLAPis designed for OLAP queries such as “total sales in the stores located in California and New York during
February-May of all years’ which act at different levels of
multiple dimension hierarchies. For this test, we created 7 combinations of “*” and set values for hierarchy levels Year,
Month, and Day: *-*-*, year-*-*, *,
year-month-day, *-month-*, *-month-year-month-day, and *-*-day. We then selected for each combination queries with coverages 10%,60%, and
95%. The test results are summarized in Figure 21. The main observation is that CR-OLAP consistently outperforms
STREAM-OLAP even for complex and very broad queries that one would expect could be easier solved through data streaming than through tree search.
VI. CONCLUSION
We introduced CR-OLAP, aCloud basedReal-timeOLAP
system based on a distributed PDCR tree, a new parallel and distributed index structure for OLAP, and evaluatedCR-OLAP
on the Amazon EC2 cloud for a multitude of scenarios. The tests demonstrate that CR-OLAP scales well with increasing database size and increasing number of cloud processors. CR-OLAPhas the potential to enable OLAP systems with real-time OLAP query processing for large databases.
ACKNOWLEDGMENT
The authors would like to acknowledge financial support from the IBM Centre for Advanced Studies Canada and the Natural Science and Engineering Research Council of Canada. We thank the research staff at the IBM Centre for Advanced Studies Canada, and in particular Stephan Jou, for their support and helpful discussions.
REFERENCES
[1] J. Han and M. Kamber, Data Mining: Concepts and Techniques.
Morgan Kaufmann Publishers, 2000.
[2] “The OLAP Report,” http://www.olapreport.com.
[3] J. Gray, S. Chaudhuri, A. Bosworth, A. Layman, D. Reichart, M.
Venka-trao, F. Pellow, and H. Pirahesh, “Data Cube: A Relational Aggregation
Operator Generalizing Group-By, Cross-Tab, and Sub-Totals,” Data
Min. Know. Disc., vol. 1, pp. 29–53, 1997.
[4] Y. Chen, F. Dehne, T. Eavis, and A. Rau-Chaplin, “PnP: sequential,
external memory, and parallel iceberg cube computation,”Distributed
and Parallel Databases, vol. 23, no. 2, pp. 99–126, Jan. 2008. [On-line]. Available: http://www.springerlink.com/index/10.1007/s10619-007-7023-y
[5] F. Dehne, T. Eavis, and S. Hambrusch,
“Paralleliz-ing the data cube,” Distributed and Parallel Databases,
vol. 11, pp. 181–201, 2002. [Online]. Available:
http://www.springerlink.com/index/BGN4YJUMUBPELXK0.pdf
[6] Z. Guo-Liang, C. Hong, L. Cui-Ping, W. Shan, and Z. Tao, “Parallel
Data Cube Computation on Graphic Processing Units,”Chines Journal
of Computers, vol. 33, no. 10, pp. 1788–1798, 2010. [Online]. Available: http://cjc.ict.ac.cn/eng/qwjse/view.asp?id=3197
[7] R. T. Ng, A. Wagner, and Y. Yin, “Iceberg-cube computation with PC
clusters,”ACM SIGMOD, vol. 30, no. 2, pp. 25–36, Jun. 2001. [Online].
Available: http://portal.acm.org/citation.cfm?doid=376284.375666
[8] J. You, J. Xi, P. Zhang, and H. Chen, “A Parallel Algorithm for Closed
Cube Computation,”IEEE/ACIS International Conference on Computer
and Information Science, pp. 95–99, May 2008. [Online]. Available: http://ieeexplore.ieee.org/lpdocs/epic03/wrapper.htm?arnumber=4529804
[9] R. Bruckner, B. List, and J. Schiefer, “Striving towards
near real-time data integration for data warehouses,” DaWaK,
vol. LNCS 2454, pp. 173–182, 2002. [Online]. Available:
http://www.springerlink.com/index/G5T567NVR9AA96XQ.pdf
[10] D. Jin, T. Tsuji, and K. Higuchi, “An Incremental Maintenance
Scheme of Data Cubes and Its Evaluation,” DASFAA,
vol. LNCS 4947, pp. 36–48, 2008. [Online]. Available:
http://joi.jlc.jst.go.jp/JST.JSTAGE/ipsjtrans/2.36?from=CrossRef
[11] R. Santos and J. Bernardino, “Real-time data warehouse loading
methodology,” IDEAS, pp. 49–58, 2008. [Online]. Available:
http://portal.acm.org/citation.cfm?id=1451949
[12] R. J. Santos and J. Bernardino, “Optimizing data
warehouse loading procedures for enabling useful-time data
warehousing,” IDEAS, pp. 292–299, 2009. [Online]. Available:
http://portal.acm.org/citation.cfm?doid=1620432.1620464
[13] F. Dehne and H. Zaboli, “Parallel real-time olap on multi-core
pro-cessors,” in Proceedings of the 2012 12th IEEE/ACM International
Symposium on Cluster, Cloud and Grid Computing (ccgrid 2012), 2012, pp. 588–594.
[14] M. Ester, J. Kohlhammer, and H.-P. Kriegel, “The dc-tree: A fully
dynamic index structure for data warehouses,” in In Proceedings of
the 16th International Conference on Data Engineering (ICDE, 2000, pp. 379–388.
[15] H. Plattner and A. Zeier, In-Memeory Data Management. Springer
Verlag, 2011.
[16] M. Ester, J. Kohlhammer, and H.-P. Kriegel, “The
DC-tree: a fully dynamic index structure for data
ware-houses,” 16th International Conference on Data
Engi-neering (ICDE), pp. 379–388, 2000. [Online]. Available:
http://ieeexplore.ieee.org/lpdocs/epic03/wrapper.htm?arnumber=839438
[17] Hadoop. [Online]. Available: http://hadoop.apache.org/
[18] J. Dean and S. Ghemawat, “Mapreduce: simplified data processing on
large clusters,”Commun. ACM, vol. 51, no. 1, pp. 107–113, Jan. 2008.
[19] A. Thusoo, J. S. Sarma, N. Jain, Z. Shao, P. Chakka, S. Anthony, H. Liu,
P. Wyckoff, and R. Murthy, “Hive: a warehousing solution over a
map-reduce framework,”Proc. VLDB Endow., vol. 2, no. 2, pp. 1626–1629,
Aug. 2009.
[20] A. Abouzeid, K. Bajda-Pawlikowski, D. Abadi, A. Silberschatz, and
A. Rasin, “Hadoopdb: an architectural hybrid of mapreduce and dbms
technologies for analytical workloads,” Proc. VLDB Endow., vol. 2,
no. 1, pp. 922–933, Aug. 2009.
[21] F. Chang, J. Dean, S. Ghemawat, W. C. Hsieh, D. A. Wallach,
M. Burrows, T. Chandra, A. Fikes, and R. E. Gruber, “Bigtable: A
distributed storage system for structured data,” ACM Trans. Comput.
Syst., vol. 26, no. 2, pp. 4:1–4:26, Jun. 2008.
[22] Bigquery. [Online]. Available: http://developers.google.com/bigquery/
[23] S. Melnik, A. Gubarev, J. J. Long, G. Romer, S. Shivakumar, M. Tolton,
and T. Vassilakis, “Dremel: interactive analysis of web-scale datasets,” Proc. VLDB Endow., vol. 3, no. 1-2, pp. 330–339, Sep. 2010.
[24] Twitter storm. [Online]. Available: http://storm-project.net/
[25] K. Doka, D. Tsoumakos, and N. Koziris, “Online querying of
d-dimensional hierarchies,” J. Parallel Distrib. Comput., vol. 71, no. 3,
pp. 424–437, Mar. 2011.
[26] A. Asiki, D. Tsoumakos, and N. Koziris, “Distributing and searching
concept hierarchies: an adaptive dht-based system,”Cluster Computing,
vol. 13, no. 3, pp. 257–276, Sep. 2010.
[27] K. Doka, D. Tsoumakos, and N. Koziris, “Brown dwarf: A
fully-distributed, fault-tolerant data warehousing system,”J. Parallel Distrib.
Comput., vol. 71, no. 11, pp. 1434–1446, Nov. 2011.
[28] Y. Sismanis, A. Deligiannakis, N. Roussopoulos, and Y. Kotidis,
“Dwarf: shrinking the petacube,” in Proceedings of the 2002 ACM
SIGMOD international conference on Management of data, 2002, pp. 464–475.
[29] S. Wu, D. Jiang, B. C. Ooi, and K.-L. Wu, “Efficient b-tree based
indexing for cloud data processing,”Proc. VLDB Endow., vol. 3, no.
1-2, pp. 1207–1218, Sep. 2010.
[30] J. Wang, S. Wu, H. Gao, J. Li, and B. C. Ooi, “Indexing
multi-dimensional data in a cloud system,” inProceedings of the 2010 ACM
SIGMOD International Conference on Management of data, 2010, pp. 591–602.
[31] X. Zhang, J. Ai, Z. Wang, J. Lu, and X. Meng, “An efficient
multi-dimensional index for cloud data management,” inProceedings of the
first international workshop on Cloud data management, 2009, pp. 17– 24.
[32] M. C. Kurt and G. Agrawal, “A fault-tolerant environment for
large-scale query processing,” inHigh Performance Computing (HiPC), 2012
19th International Conference on, 2012, pp. 1–10.
[33] Zeromq socket library as a concurrency framework. [Online]. Available:
http://www.zeromq.org/
[34] Transaction processing performance council, tpc-ds (decision support)
0 0.05 0.1 0.15 0.2 1 2 4 6 8
Time per 1000 operations(sec)
Number of workers(m)
PDCR-tree 1D-index
Fig. 10. Time for 1000 insertions as a function
of the number of workers. (N = 40M il,d= 8,
1≤m≤8) 0 200 400 600 800 1000 1200 1400 1 2 4 6 8
Time per 1000 operations(sec)
Number of workers(m) PDCR-tree(10% coverage) 1D-index(10% coverage) PDCR-tree(60% coverage) 1D-index(60% coverage) PDCR-tree(95% coverage) 1D-index(95% coverage)
Fig. 11. Time for 1000 queries as a function of
the number of workers. (N= 40M il,d= 8,1≤
m≤8) 0 1 2 3 4 5 6 7 8 1 2 4 6 8 Speedup Number of workers(m) Y=X PDCR-tree(10% coverage) 1D-index(10% coverage) PDCR-tree(60% coverage) 1D-index(60% coverage) PDCR-tree(95% coverage) 1D-index(95% coverage)
Fig. 12. Speedup for 1000 queries as a function
of the number of workers. (N = 40M il,d= 8,
1≤m≤8) 0 0.05 0.1 0.15 0.2 N=10M,m=1 N=20M,m=2 N=40M,m=4 N=60M,m=6 N=80M,m=8
Time per 1000 operations(sec)
Increasing system size(N,m) PDCR-tree
1D-index
Fig. 13. Time for 1000 insertions as a function of
system size:N &mcombined. (10M il≤N ≤
80M il,d= 8,1≤m≤8) 0 1000 2000 3000 4000 5000 N=10M,m=1 N=20M,m=2 N=40M,m=4 N=60M,m=6 N=80M,m=8
Time per 1000 operations(sec)
Increasing system size(N,m) PDCR-tree(10% coverage) 1D-index(10% coverage) PDCR-tree(60% coverage) 1D-index(60% coverage) PDCR-tree(95% coverage) 1D-index(95% coverage)
Fig. 14. Time for 1000 queries as a function of
system size:N &mcombined. (10M il≤N ≤
80M il,d= 8,1≤m≤8) 0 0.02 0.04 0.06 0.08 0.1 0.12 0.14 0.16 4 5 6 7 8
Time per 1000 operations(sec)
Number of Dimensions(d)
PDCR-tree 1D-index
Fig. 15. Time for 1000 insertions as a function of
the number of dimensions. (N= 40M il,4≤d≤
8,m= 8) 0 100 200 300 400 500 600 700 800 4 5 6 7 8
Time per 1000 operations(sec)
Number of dimensions(d) PDCR-tree(10% coverage) 1D-index(10% coverage) PDCR-tree(60% coverage) 1D-index(60% coverage) PDCR-tree(95% coverage) 1D-index(95% coverage)
Fig. 16. Time for for 1000 queries as a function
of the number of dimensions. The values for “1D-index 95% coverage” are 828.6, 1166.4, 1238.5,
1419.7 and 1457.8, respectively. (N = 40M il,
4≤d≤8,m= 8) 0 50 100 150 200 250 300 350 10 20 30 40 50 60 70 80 90
Time per 1000 operations(sec)
Query coverage per dimension(%) Store is * Customer is * Item is * Date is * Address is * Household is * Promotion is * Time is * No dimension is *
Fig. 17. Time for 1000 queries (PDCR tree) as a
function of query coverages:10%−90%. Impact of
value “*” for different dimensions. (N = 40M il,
m= 8,d= 8) 0 50 100 150 200 250 300 350 91 92 93 94 95 96 97 98 99
Time per 1000 operations(sec)
Query coverage per dimension(%) Store is * Customer is * Item is * Date is * Address is * Household is * Promotion is * Time is * No dimension is *
Fig. 18. Time for 1000 queries (PDCR tree) as a
function of query coverages:91%−99%. Impact of
value “*” for different dimensions. (N = 40M il,
m= 8,d= 8) 0 5 10 15 20 10 20 30 40 50 60 70 80 90
Time ratio of 1D-index over PDCR-tree
Query coverage per dimension(%) Store is * Customer is * Item is * Date is * Address is * Household is * Promotion is * Time is * No dimension is *
Fig. 19. Time comparison for 1000 queries (Ratio:
1D-index / PDCR tree) for query coverages10%−
90%. Impact of value “*” for different dimensions.
(N= 40M il,m= 8,d= 8) 0 5 10 15 20 91 92 93 94 95 96 97 98 99
Time ratio of 1D-index over PDCR-tree
Query coverage per dimension(%) Store is * Customer is * Item is * Date is * Address is * Household is * Promotion is * Time is * No dimension is *
Fig. 20. Time comparison for 1000 queries (Ratio:
1D-index / PDCR tree) for query coverages91%−
99%. Impact of value “*” for different dimensions.
(N= 40M il,m= 8,d= 8) 0 200 400 600 800 1000 1200 1400 1600 * * * y * * y m * y m d * m * * m d * * d
Time per 1000 operations(sec)
* in different hierarchy levels of dimension Date PDCR-tree(10% coverage) PDCR-tree(60% coverage) PDCR-tree(95% coverage) 1D-index(10% coverage) 1D-index(60% coverage) 1D-index(95% coverage)
Fig. 21. Query time comparison for selected query
patterns for dimensionDate. Impact of value “*” for
different hierarchy levels of dimensionDate. (N=
APPENDIX
Algorithm 1: Hat Insertion
Input:D (new data item).
Output: void
Initialization: Setptr=root
Repeat:
Determine the child nodeC of ptr that causes minimal MBR/MDS enlargement for the distributed PDCR/PDC tree ifD is inserted underC. Resolve ties by minimal overlap, then by minimal number of data nodes. Setptr=C.
Acquire a LOCK forC.
Update MBR/MDS and TS of C. Release the LOCK forC.
Until: ptris aleaf node.
ifptr is the parent of Data Nodes then
Acquire a LOCK for ptr. Insert D under ptr. Release the LOCK for C.
ifcapacity of ptr is exceeded then
Call Horizontal Split for ptr.
ifcapacity of the parent of ptr is exceeded then
Call Vertical Split for the parent of ptr.
ifdepth of ptr is greater than hthen
Create a new subtree with the parent of ptr as its root, ptr and its sibling node as the children of the root.
Choose the next available worker and update the list of subtrees in the master. Send the new subtree and its data nodes to the chosen worker.
end end end end
ifptr is the parent of a subtree then
Find the worker that contains the subtree from the list of subtrees.
Send the insertion transaction to the worker. end
End of Algorithm.
Algorithm 2: Subtree Insertion
Input:D (new data item).
Output: void
Initialization: Setptr=root
Repeat:
Determine the child nodeC of ptr that causes minimal MBR/MDS enlargement for the distributed PDCR/PDC tree ifD is inserted underC. Resolve ties by minimal overlap, then by minimal number of data nodes. Setptr=C.
Acquire a LOCK forC.
Update MBR/MDS and TS of C. Release the LOCK forC.
Until: ptris aleaf node.
Acquire a LOCK forptr. InsertD under ptr. Release the LOCK forC.
ifcapacity of ptris exceeded then
Call Horizontal Split for ptr.
ifcapacity of the parent ofptr is exceededthen
Call Vertical Split for the parent of ptr. end
end
Algorithm 3: Hat Query
Input:Q (OLAP query).
Output: A result set or an aggregate value
Initialization: Setptr=root
Pushptr into a local stackS for queryQ. Repeat:
Pop the top itemptr0 from stackS.
ifTS(time stamp) of ptr0 is smaller (earlier) than the
TS ofptrthen
Using thesibling links, traverse the sibling nodes of
ptruntil a node with TS equal to the TS of ptris met. Push the visited nodes includingptrinto the stack (starting from the rightmost node) for reprocessing.
end
foreach childC of ptr do
ifMBR/MDS of C is fully contained in MBR/MDS
ofQthen
AddC and its measure value to the result set. end
else
ifMBR/MDS of C overlaps MBR/MDS ofQ
then
ifC is the root of a sub-tree then
Send the queryQto the worker that contains the subtree.
end else
PushC into the stackS. end
end end end
Until: stackS is empty.
ifthe queryQis dispatched to a subtreethen
Wait for the partial results of the dispatched queries from workers.
Create the final result of the collected partial results. Send the final result back to the client.
end
End of Algorithm.
Algorithm 4: Subtree Query
Input:Q (OLAP query).
Output: A result set or an aggregate value
Initialization: Setptr=root
Pushptr into a local stackS for queryQ. Repeat:
Pop the top itemptr0 from stackS.
ifTS(time stamp) of ptr0 is smaller (earlier) than the
TS ofptrthen
Using the sibling links, traverse the sibling nodes of
ptruntil a node with TS equal to the TS of ptris met. Push the visited nodes includingptrinto the stack starting from the rightmost node for reprocessing.
end
foreach childC of ptr do
ifMBR/MDS of C is fully contained in MBR/MDS
ofQthen
AddC and its measure value to the result set. end
else
ifMBR/MDS of C overlaps MBR/MDS ofQ
then
PushC into the stackS. end
end end
Until: stackS is empty.
Send the result back to the master or client depending on whether Qis an aggregation query or a data report query.