Sponsored Data Plan: A Two-Class Service Model in
Wireless Data Networks
Liang Zhang
†, Weijie Wu
#, Dan Wang
†‡ †Department of Computing, The Hong Kong Polytechnic University
‡
The Hong Kong Polytechnic University Shenzhen Research Institute
#School of Electronic, Information and Electrical Engineering, Shanghai Jiao Tong University
{cslizhang, csdwang}@comp.polyu.edu.hk, [email protected]
ABSTRACT
Data traffic demand over the Internet is increasing rapidly, and it is changing the pricing model between Internet service providers (ISPs), content providers (CPs) and end users. One recent pricing proposal issponsored data plan, i.e., when accessing contents from a particular CP, end users do not need to pay for that volume of traffic consumed, but the CP will sponsor for this data consumption. In this paper, our goal is to understand the rationale behind this new pricing model, as well as its impacts to the wireless data market, in particular, who will benefit and who will be hurt from this scheme. We build a two-class service model to analyze the consumers’ traffic demand under the sponsored data plan with consideration of QoS. We use a two-stage Stackelberg game to characterize the interaction between CPs and the ISP and reveal a number of important findings. Our con-clusions include: 1) When the ISP’s capacity is sufficient, the sponsored data plan benefits consumers and CPs in the short run, but the ISP does not have incentives to further improve its service in the long run. 2) When ISP’s capacity is insufficient, the ISP and end users may achieve a win-win trade, while the ISP and CPs always compete for the revenue. 3) The sponsored data plan may enlarge the un-balance in revenue distribution between different CPs; CPs with higher unit income and poorer technology support are more likely to prefer the sponsored data plan.
Categories and Subject Descriptors
C.4 [Performance of Systems]: Modeling techniques, Per-formance attributes; J.4 [Social and Behavioral Sciences]: Economics
General Terms
Theory; Algorithm
Keywords
Sponsored Data; Stackelberg Game
Permission to make digital or hard copies of all or part of this work for personal or classroom use is granted without fee provided that copies are not made or distributed for profit or commercial advantage and that copies bear this notice and the full cita-tion on the first page. Copyrights for components of this work owned by others than ACM must be honored. Abstracting with credit is permitted. To copy otherwise, or re-publish, to post on servers or to redistribute to lists, requires prior specific permission and/or a fee. Request permissions from [email protected].
SIGMETRICS’15,June 15–19, 2015, Portland, OR, USA. Copyright©2015 ACM 978-1-4503-3486-0/15/06 ...$15.00. http://dx.doi.org/10.1145/2745844.2745863.
1.
INTRODUCTION
With the popularity of bandwidth-intensive mobile de-vices like smart phones and tablet computers, data traffic is increasing fast recently. The trend of intensive interac-tions of mobile devices and public clouds suggests that the amount of future wireless data traffic can be even daunting. This poses huge burden to the Internet service providers (ISPs) since supporting such demand-supply gap requires large investments. To share such costs with users, flat-rate pricing plans used in broadband networks are phasing out. ISPs now propose pricing plans with a cap. By paying a flat fee, users can consume any traffic volume below this cap, but they are either not allowed or highly charged for consuming traffic volume beyond this cap. This cap is usu-ally conservative. For example, Google revealed that almost 85% of the plans offer less than 10 GB data per month, and 36% offer less than 1 GB per month [1]. Such caps would be easily reached in less than seven hours under the current 3G bandwidth [2]. There is thus a great demand on better pricing models. One research direction is time dependent pricing [3, 4]. The key observation is that the user traf-fic demands are not uniform at different times. Therefore, higher (lower) prices can be applied to peak (off-peak) hours so as to change the users’ consumption patterns over times. Another recent proposal issponsored data plan, originated from 1-800 services of phone calls [5]. In particular, ISPs provide platforms for the content providers (CPs) to spon-sor their end users, but with some payments or indirectly sharing advertising revenue, such that when end users access the content from one CP joining the sponsored data plan, their traffic from this CP is partially or fully exempted from their data caps. For example, Google has joined with India’s Bharti Airtel to offer free access to certain Google-based ser-vices such as Gmail, Google+ and first pages of websites via Google search without ringing up data charges [6]. This pricing strategy is expected to create a positive cycle: End users will access more contents which will be exempted from their caps; content providers can attract more users and earn more from advertisement incomes; ISPs can obtain higher revenue to support better quality of service (QoS) and carry out technology upgrades. Early works [7, 8] have confirmed its benefits to CPs and end users.
Nevertheless, a key problem is whether such a plan may lead to unfair competition advantage to certain parties. Sim-ilar debates, e.g., network neutrality, appeared in the past. Opponents, including network neutrality advocators and rep-resentatives from public interest groups, concern that such a plan will favor rich and big CPs over small ones [9]. This
may impede Internet innovation and ultimately hurt
con-sumers. Proponents, mostly ISPs and some CPs, argue
that this plan can promote competition and improve effi-ciency [10]; ultimately, consumers will benefit from better services and cheaper traffic. The pioneer ISP, AT&T, ex-pressed confidence that the sponsored data plan complies with Federal Communications Commission (FCC) network neutrality rules. The core of network neutrality is that packet flows at the ISP level should not bear priorities1. Otherwise, when congestion occurs, low priority flows can be dropped before high priority ones, causing unfair compe-tition in QoS among different CPs. Sponsored content, in fact, does not trigger differentiated services at the ISP flow level. When congestion occurs, packet flows of sponsored contents have the same probability to get dropped as non-sponsored ones. The FCC is inclined to side with proponents though its chairman claimed that the commission will care-fully watch the sponsored data program and intervene if it finds the sponsored content practice violates the Open Inter-net Order [11]. After a long time of planning, AT&T finally announced its sponsored data program in January 2014. Its sponsored data partner, Syntonic Wireless, launched “toll-free” content store six months later [12].
In this paper, we show that an unfair competition advan-tage may still exist. In particular, there might be a competi-tion disadvantage for certain CPs, such that tiered services will be created and ultimately users might be hurt. Un-der this plan, there will be a sponsored class services and an ordinary class services, where the sponsored class brings higher revenue to CPs. Yet to join the sponsored class, CPs need to pay a non-trivial premium for each unit of content it delivers. Only CPs with high unit profit can afford such a premium. This discriminates CPs in the sense that they need to compete for capital, i.e., the capability they pay a premium for their content, rather than their services, i.e., the quality of the contents or the quality of services. In addition, we find that in the long run, the ISP has no in-centives to enlarge its traffic cap when its traffic capacity is sufficient; this greatly hurts consumers and CPs. Although these results seem discouraging for the sponsored data plan, we also show that if the traffic cap is regulated properly so as to guarantee the majority part of capacity being allocated to the ordinary class, then the ISP’s optimal strategy is aligned with the consumers’ surplus.
In this paper, we study a set of CPs, a monopolistic ISP and a set of users2. We model the users’ traffic demand dy-namics under the sponsoring plan with QoS consideration (Sec. III-A and III-B). Based on this, we develop a Stackel-berg game framework (Sec. III-C and III-D) and analyze the interactions between the ISP, end users, and CPs (Sec. IV and V). In particular, we find that the equilibrium may not always exist and discuss the outcome of the interactions. We also develop efficient polynomial time algorithms to search the outcome in the exponential solution space. Finally, we determine and characterize the actions of the ISP and CPs in the steady state, i.e., the solution to the Stackelberg game. Our major findings are:
1
Priorities for traffic engineering might be acceptable; yet priorities targeting on certain application types (e.g., P2P) or some particular CPs (e.g., Google), should be prohibited. 2In this paper, we use the terms “users” and “consumers” interchangeably.
• If the ISP’s capacity is sufficient, then the sponsored data plan benefits consumers and CPs in the short run; but in the long run, the ISP has no incentives to enlarge its traffic cap, which hurts consumers and CPs.
• If the ISP’s capacity is insufficient, then the ISP has strong incentives to enlarge its capacity, which benefits both CPs and consumers. However, the ISP’s optimal strategy to enlarge its profit is always contrary to CPs’ surplus. If the traffic cap is regulated properly, then this strategy is aligned with the consumers’ surplus.
• The sponsored data plan may enlarge the unbalance in the revenue distributions between different CPs; those with higher unit income and poorer technology support are more likely to prefer the sponsored data plan.
2.
RELATED WORK
Sponsored data plan has become an attractive topic since it was proposed by AT&T. Under this plan, content providers can transfer part of their revenues to consumers so as to pursue higher traffic usage and remedy their consumers’ low willingness to pay. Similar revenue transfer and sharing also happen between other interest groups with complementary requirements in the Internet [13, 14, 15, 16]. Based on the seminal work of two-sided markets by Armstrong [17], prior works [15, 16] studied the two-sided markets in the Inter-net, i.e., CPs and end users are the two sides that interact in a market enabled by the platform of ISPs. Njoroge et al. [15] found that through CP-side pricing, ISPs could ex-tract higher surplus and maintain higher investment levels. Hande et al. [16] set up a two-sided model in a rate alloca-tion market and concluded that subsidizing end users’ cost of connectivity by pricing content providers may benefit both end users and CPs. Xu et al. [18] proposed a cooperative profit-distribution model for eyeball ISPs and peer-assisted content providers based on Nash Bargaining Solution. Au-thors in [13, 14] studied the profit-sharing mechanism of multi-lateral ISP settlements. Ma et al. [13] proposed a Shapley profit-sharing mechanism. At the Nash equilibrium, the routing and connecting/peering strategies maximize ag-gregate network profits. Wu et al. [14] proposed a Nash bar-gaining process and found that all ISPs are simultaneously better than the noncooperative equilibrium.
The sponsored data plan faces new challenges due to the complexity of users’ behaviors and attracts lots of research interests. From the economic point of view, Andrews et al. [7] studied the contractual relationship between CPs and ISPs with random demand. They concluded that a coordi-nating contract can maximize the total system profit, and that the additional profit caused by sponsored data plan can be split between CPs and ISPs in an arbitrary manner. Zhang and Wang [8] formulated a competition problem be-tween one large CP and one small CP to show whether spon-sored content indeed favors large and rich CPs. Ma [19] cap-tured the regulated subsidization competition among CPs under a neutral network and concluded that certain CPs might be harmed with a main reason being the high access prices instead of the existence of subsidization. Joe-Wong et al. [20] formulated the interaction among ISPs, CPs and het-erogeneous users and derived their optimal behaviors. They found that sponsorship favors less cost-constrained CPs and more cost-constrained users, exacerbating CP inequalities
but making user demand even more. From technical point of view, Raj et al. [2] developed a new computing abstraction, called SIMlet, based on the idea of split billing. Andrews et al. [21] developed a detailed methodology for extracting the parameters required by models in their previous work [7] and discussed how to select the proper sites to join the sponsored data plan.
The above works provide initial analysis on the sponsored data plan; however, further understandings are still limited. In particular, much is unknown on whether this strategy brings unfair competition and hurts consumers, as well as how end users behave and QoS changes upon the adoption of this plan. In this paper, we model the sponsored data plan as a two-class service model, which has been widely adopted by [22, 23, 24, 25, 26]. Li et al. [26] provided the techni-cal support for two-class services with different QoS using a multicast protocol. Shetty et al. [23] investigated the effects of transition from a single-service class to two-service classes in the Internet by considering the interaction between end users and multiple ISPs. Yuksel et al. [24] focused on transit ISPs and quantified the extra capacity requirement for an over-provisioned classless network compared with the class network. Hermalin and Katz [25] examined the welfare ef-fects of product-line restrictions and analyzed the case of two technologically restricted quality levels. However, all the above works focused on the ISP’s side but not the CPs’ choices. We have only found that Ma and Misra [22] con-sidered the problem from similar directions with us. We adopt a similar methodology with Ma and Misra [22, 27] to obtain the equilibrium of the Stackelberg game. However, we do not consider QoS differentiation, but we focus on the sponsored data plan.
3.
GENERAL MODEL
In this section, we model the wireless data market with three parties: a set of CPsN(N=|N |), a monopolistic ISP and a set of end users with a total numberM. The CPs pro-vide services to end users. We assume that one CP supplies only one service. If a CP provides multiple services, then we treat it as multiple virtual CPs, each serving one particular service. The ISP provides Internet access services to CPs and end users. Usually, there is a transmission bottleneck for the connection services between CPs and end users. We define the traffic capacity (or capacity for short) of the ISP, denoted byµ, as the maximal possible amount of traffic vol-ume that can be transmitted through the bottleneck during a fixed period3. Based on the above model, we can use a triple (N, µ, M) to represent the whole system.
3.1
Users’ Traffic Demand
Users have different preferences towards various contents and services of CPs. We usevaluationto present this pref-erence. Facing different choices in the service set, a user prefers accessing a service with a high per unit valuation when he has a usage limitation (or traffic cap). We assume a user’s per-unit traffic valuation has a decreasing trend. For example, a user may have a high valuation on a VoIP ser-vice since he needs to have an important discussion with his 3Please be noted that the definition of “capacity” is different from the ISP’scapannounced to the users; the later concept refers to the maximal traffic that a user is allowed consume during a fixed period.
friend, but when he finishes this discussion, the extra traffic he consumes, e.g., for telling jokes, is with a low valuation. In other words, the marginal valuation decreases with the traffic volume consumed. We define a strictly decreasing
valuation density function gi(·) to capture this feature, and
the total valuation of consumingxiamount of traffic is given
byRxi
0 gi(s)ds. Further, we assume
R∞
0 gi(s)ds <∞. Each service requires a certain bandwidth to achieve good QoS. For instance, a bandwidth of 500 Kbps is required for YouTube videos. We denote this maximal requirement for the service of CP i(or serviceifor short) as ˆbi. However,
in reality it may not be totally satisfied due to ISP’s insuf-ficient capacity. We denote the achievable bandwidth asbi.
Obviously, we havebi≤ˆbi. When the maximal bandwidth
requirement cannot be satisfied, QoS decreases, resulting phenomenons like frequent screen freeze in video display. We define qi = bi/ˆbi as the ratio of the achievable
band-width over the maximal bandband-width requirement. It reflects the extent of QoS degradation; whenqi<1, it may lead to
a reduction of users’ valuations. In later parts of this paper, we callqithe “QoS index”. We capture this effect by aQoS
satisfaction function: hi(·) : [0,1]→[0,1], wherehi(0) = 0
and hi(1) = 1. We assume that it is a non-decreasing and
continuous function inqi. Whenqi<1, the marginal
valua-tion decreases togi(·)hi(qi), and thus the total valuation for
consumingxi amount of traffic becomesR0xigi(s)hi(qi)ds.
We assume that an end user accesses a service if and only if his per unit traffic valuation of this service is higher than a pre-set threshold denoted byti. This threshold may
come from the cost of bearing irritating pop-ups. Since the marginal valuation of a service reduces, there is a usage threshold for a user where his marginal valuation is equal toti. We define theusage thresholdfor serviceias
θi= max{s:gi(s)hi(qi)≥ti},
which reflects the maximal possible traffic usage for service
i. When the inverse function ofgi(·) exists, we denote it as
g−1 i (·), and we haveθi=g−i1 ti hi(qi)
. For any traffic usage
xi∈[0, θi], let us define the users’utilityas4
ψi(xi) =
Z xi
0
[gi(s)hi(qi)−ti]ds. (1)
We assume that the utility of consuming different services are additive. Therefore, the utility of accessing all services with traffic usagex= (x1,· · ·, xN) is
ψ(x) =X
i∈N
Z xi
0
[gi(s)hi(qi)−ti]ds. (2)
In later analysis, we also call it thesurplusof a consumer. Now let us observe the ISP’s role in users’ consumption decisions. An ISP usually applies a “flat-rate-like” pricing scheme but with a cap, i.e., by paying a flat rate, end users can use the traffic below the cap, but they are not allowed to consume traffic volume beyond this cap, or are charged by a much higher price for usage beyond5. Let us useC to de-note this cap. In this paper, we assume that each user’s data 4We do not include the Internet access fee charged by the ISP into the formula, since the access fee is a constant and does not impact any result.
5
For instance, in the “AT&T individual plan” for 4G smart phones, AT&T charges $10 for a traffic cap 1 GB per month, but another $5 for any additional 50 MB.
consumption is below this cap. This assumption is for math-ematical tractability; in reality, users do usually limit their usage below this cap due to the high fee charged for beyond. Under the sponsored data plan, traffic consumption of a par-ticular service can be partially or totally exempted from this cap. We denoteO(orS) as the set of ordinary (or sponsor-ing) content providers (or services). Content providers inS
sponsor the total traffic volume consumed on their content, while those inO do not participate in the sponsored plan. Each CP inN is in either S or O. Thus, given the QoS index vector q = (q1,· · ·, qN), an end user can decide his
optimal traffic usage by maximizing his utility: max x ψ(x) = X i∈N Z xi 0 [gi(s)hi(qi)−ti]ds, s.t. X i∈O xi≤C, 0≤xi≤θi. (3)
Note that for end users, the total traffic usage for non-sponsored services should not exceed the cap. Given the choices of CPs, i.e., (O,S), the above optimization can be solved by KKT conditions [28]. We have the following lemma.
Lemma 1. A user’s optimal data consumption of the con-tent provided by CPi, denoted asxi, is:
xi= ( maxn0, gi−1ti+ν hi(qi) o i∈ O, θi i∈ S, (4)
where ν is the Lagrange multiplier associated with the cap constraint. In addition, ν is non-decreasing with respect to
qi, and non-increasing with respect toC.
Proof. Please refer to the technical report [29]. Lemma 1 derives the optimal traffic consumption of end users. The traffic consumption for services inS always ap-proaches the usage threshold, but that inO is constrained by the traffic cap and the usage threshold.
We defineνas thelevel of competitionfor the traffic cap, because a highνindicates a low traffic cap, so CPs inOface intense competition to attract users’ consumption within this limited cap. WhenCis large, the traffic consumption of services inOalso approaches the usage threshold. Services inS has no impact on the demand of traffic inO. Lemma 1 also states that the level of competition is also affected by the QoS index. A higher QoS index means a higher level of competition since it increases the traffic demand.
3.1.1
Discussion on QoS Satisfaction Functions
Users may have different requirements on QoS for different services. For example, for real-time applications like Netflix, the value of the QoS satisfaction function decreases dramat-ically with respect toqi. This is because inadequate
band-width for the realtime applications greatly hurts users’ ex-perience. In contrast, for delay-tolerant services like email, reduction in QoS does not hurt users’ experience too much. Therefore, in this paper, we define the QoS satisfaction func-tion in the following form:
hi(qi) =qiγi, (5)
whereγiis called thequality sensitivityfor servicei. A large
γirepresents a service with a high sensitivity on the quality,
while a smallγirepresents one with a low sensitivity.
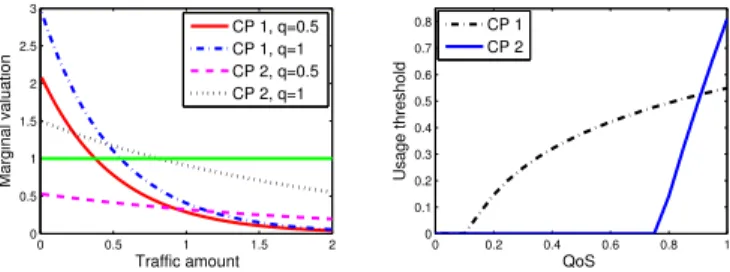
0 0.5 1 1.5 2 0 0.5 1 1.5 2 2.5 3 Traffic amount Marginal valuation CP 1, q=0.5 CP 1, q=1 CP 2, q=0.5 CP 2, q=1 0 0.2 0.4 0.6 0.8 1 0 0.1 0.2 0.3 0.4 0.5 0.6 0.7 0.8 QoS Usage threshold CP 1 CP 2
Figure 1: An example of consumers’ valuation model
3.1.2
Discussion on Valuation Density Functions
Define αi = limxi→0gi(xi). The value of the valuation density function approaches the maximumαiwhen the user’s
consumption on service i approaches zero. As the traf-fic amount increases to infinity, the marginal valuation de-creases to zero, i.e., limxi→∞gi(xi) = 0. The above
require-ment is needed to guaranteeR∞
0 gi(s)ds <∞. In particular, we consider the following canonical form:
gi(xi) =αie−βixi, (6)
where βi captures thetraffic sensitivityon the valuation of
servicei. A higher traffic sensitivity indicates that the val-uation of per unit traffic decreases more rapidly when more traffic is consumed by end users.
3.1.3
Illustration
We consider an example where two CPs are with parame-ters (α1, β1, γ1) = (3,2,0.5) and (α2, β2, γ2) = (1.5,0.5,1.5); CP 1 provides an Email type service with a high per unit valuation, a high traffic sensitivity and a low quality sensi-tivity, while CP 2 provides a video type service with a low per unit valuation, a low traffic sensitivity and a high quality sensitivity. Let the pre-set threshold beti= 1.
Figure 1 shows the marginal valuation with respect to the traffic consumed by both CPs (the left subfigure) and the usage threshold of the two CPs with respect to the QoS index (the right subfigure). The marginal valuation decreases with respect to the traffic amount consumed, and the decreasing trend becomes more rapid when congestion happens. For example, the marginal valuation of CP 1 decreases 63% when the traffic amount increases from 0.5 to 1. When the QoS index decreases, e.g., from 1 to 0.5, the marginal valuation of CP 1 decreases 28% further. A user consumes the traffic only when the marginal valuation is higher than the pre-set threshold. The critical point, i.e., the usage threshold, shifts to the left when congestion happens. When the marginal valuation line is all below the pre-set threshold line, the end user consumes no traffic and does not receive such service. The relationship between the usage threshold and the QoS index are shown in the right sub-figure. Each CP needs some QoS guarantee to attract its end users, while different CPs have different requirements. For example, CP 1 requires that the QoS index is larger than 0.1, while CP 2 requires it larger than 0.75. Comparing to CP 1, quality degradation has a more serious effect on CP 2. Decrease of the QoS index from 1 to 0.9 results in 39% reduction of the usage threshold for CP 2 but only 4% for CP 1.
Up till now we have captured end users’ traffic demand under certain QoS. Next we will analyze the correlation be-tween the end users’ demand and QoS of the system.
3.2
Capacity Sufficiency and Rate Allocation
Mechanism
In this subsection we analyze the aggregated traffic de-mand of all services, based on which we define the sufficiency and insufficiency of the ISP’s capacity. Later, we capture the interactions between the traffic demand, sufficiency of capacity, and the quality of service.
Let us first consider the aggregated traffic demand of M
end users receiving services in the sponsored class S, i.e., P
i∈SM xi(q). According to lemma 1, the optimal usage for
each service approaches the usage threshold, i.e.,xi=θi(qi)
for anyi∈ S. The aggregated traffic demand for services in
SisP
i∈SM θi(qi). Then let us consider the aggregated
traf-fic demand inO, i.e.,P
i∈OM xi(q). When the traffic cap is
sufficiently large, each end user’s optimal traffic usage is the usage threshold, so the aggregated traffic demand in O is P
i∈OM θi(qi). Otherwise, if the cap for the users is smaller
thanP
i∈OM θi(qi), then the aggregated traffic demand is
M CwhereCis the cap set by the ISP. Therefore, the aggre-gated demand for services inOisMminP
i∈Oθi(qi), C .
The aggregated traffic demand from all users is
D(q) =X i∈S M θi(qi) +Mmin X i∈O θi(qi), C . (7)
Now let us formally define the sufficiency (insufficiency) of the ISP’s capacity.
Definition 1. We say that the ISP’s capacity C is suf-ficient ifC≥D(1), or insufficient otherwise.
When C is insufficient, we can by no means guarantee that each user receives each service under the best QoS; in other words, congestion happens. Lots of bandwidth cating mechanisms have been used to address the rate allo-cation problem under congestion [22, 30]. One well adopted method is the proportional share mechanism [22], where each flow reduces the same percentage of rates under conges-tion. In other words, the ratios of the achievable bandwidth over the maximal bandwidth requirement for any two ser-vices i and j are the same, i.e., bi : ˆbi = bj : ˆbj, so the
QoS indices for each service are the same, i.e., qi =q for
any i ∈ N.6 Thus, the traffic demand function D(q) can be simplified byD(q). Whenq <1, users’ demand for each service reduces. When reaching a steady state, the traffic demand is equal to the capacity of the ISP:
D(q) =µ. (8) We call the QoS indexq that satisfies the above equation anequilibrium QoS. Let us defineλ=µ/M as the average capacity (or per user capacity). Given the sets (O,S), the equilibrium QoS is captured by the following lemma.
Lemma 2. Given the sets(O,S), there is a unique equi-librium QoSq∈[0,1]. Further, it is a non-decreasing func-tion with respect toλ, and a non-increasing function with respect toC.
Proof. Please refer to the technical report [29].
6In practice, the QoS indexqmay be dynamic over time due to volatile traffic demand (e.g., high QoS index during valley period and low QoS index during peak period). However, the QoS index during peak period is relatively stable [31]. In this paper, we focus on the traffic capacity during peak period and treatqas the average QoS index over the period.
Lemma 2 shows that the ISP can improve QoS by en-larging its capacity, in particular, when q < 1. It is also interesting to note that if we merely increase the ISP’s traf-fic cap, i.e., users are allowed to consume more traftraf-fic, then QoS becomes worse since the traffic demand from users in-creases but the ISP’s capacity remains the same.
3.3
Utility of Content Providers and the ISP
Now let us formally define the utility functions of content providers and the Internet service provider. This serves as the foundation for our further game analysis.
3.3.1
Utility of Content Providers
We usevito denote the per unit revenue of CPi. Content
providers may have quite different per unit revenue [32]. For example, Google search has a much higher per unit revenue than YouTube. The revenue can be generated by advertise-ments (e.g., YouTube), or value-added services (e.g., Ten-cent), or other e-commerce (e.g., Amazon). The cost of CP
iconsists of two parts: 1) the costcifor the connection
ser-vice of per unit traffic, and 2) the additional costpfor per unit sponsored traffic. Thus, the utility of CPi, denoted by
φi, is:
φi(ci, p) =
(vi−ci)xi(q) i∈ O,
(vi−ci−p)θi(q) i∈ S. (9)
Content providers’ surplus, defined as the summation of util-ities of all CPs, can be expressed as
φ=X
i∈N
φi. (10)
3.3.2
Utility of the ISP
We use the ISP’s revenue to represent its utility7, mainly from two sources: 1) the unit price charged to CPs for the connection service, i.e., ci, and 2) the unit price charged
to CPs for the sponsored traffic, i.e., p. We omit the price charged to end users because it is only a constant under the cap scheme. Thus, the utility (or surplus) of the ISP, denoted byπ, is: π(ci, p) = X i∈S (ci+p)θi(q) + X i∈O cixi(q). (11)
Note that we treat the unit sponsoring price for different CPs as equal so as to cope with the network neutrality rules.
3.4
A Two-stage Stackelberg Game
We model the interactions of the ISP and CPs as a two-stage Stackelberg game in the system (M, µ,N). In partic-ular, we have the following settings:
• Players: The ISP and the set of CPs.
• Strategies: The ISP decides the unit price charged to CPs for the sponsored traffic, and the traffic cap for end users, i.e., the ISP’s strategy profile is sI ∈
{(p, C) : p ≥ 0, C ≥ 0}. Each CP decides to join either the ordinary class or the sponsored class. We usesN = (O,S) to denote CPs’ strategy profile, with O ∩ S=∅andO ∪ S=N.
7We ignore the cost for delivering per unit traffic since the fixed cost is majority while the marginal cost is negligible.
• Rules: The ISP is the first mover who decides its price and traffic cap and announces them to CPs and end users. CPs are second movers and decide which class to join. Each CP makes its own decision independently.
• Outcome: The outcome is determined by backward induction. In particular, given any ISP’s decision, each CP chooses which class to join to maximize its utility. Based on this knowledge, the ISP decides its optimal price and traffic cap that maximize its utility. Note that we do not include the decision of ci, i.e., the
unit price for connection services, into the ISP’s strategy profile. This is because we want to focus on the sponsored data scheme, which influences end users’ decisions, but has limited impacts onci. Therefore we assumeci is
predeter-mined and known. We apply the Stackelberg game where the ISP is the first mover and CPs are second movers. This reflects the reality where ISPs usually have the monopolistic power and are active to promote the sponsored data plan. Once the ISP fixes its charging scheme, it cannot frequently change it as its contract with CPs and end users are normally of long term. After the ISP’s decision, CPs decide whether they sponsor the content. Since CPs make their decisions simultaneously, we call their decision process a simultane-ous gamedenoted by (M, µ,N, sI). Following the backward
induction, we analyze the CPs’ decisions, i.e., the simulta-neous game, in Section 4, and later, the ISP’s decision, in Section 5.
4.
CONTENT PROVIDERS’ DECISIONS
In this section, we analyze content providers’ decisions, i.e., the outcome of the simultaneous game (M, µ,N, sI). In
the decision phase, a CP joins a particular class (O or S) where he can obtain a higher utility. Note that upon joining a particular class, this CP may impact the QoS index and the traffic consumption of other services. However, we consider when the number of CPs is large, this effect is ignorable, and thus definecompetitive equilibriumas follows:
Definition 2. A strategy profilesN = (O,S) is a com-petitive equilibrium of the game(M, µ,N, sI)if for any CP
i, its utility satisfies:
vi−ci−p vi−ci ≤xi(O,S) e θi(O,S) ifi∈ O, >exi(O,S) θi(O,S) ifi∈ S, (12)
wherexeiandθeiare the estimation of the ex-post traffic usage
xi(O ∪ {i},S/{i})andθi(O/{i},S ∪ {i})accordingly.
Definition 2 states that under the competitive equilibrium, CPs in each class cannot obtain a higher profit by joining the other class. The competitive equilibrium depends on the estimation of the ex-post traffic usage for exi and eθi which
are obtained by exi = g−i1 ti+eν hi(eq) and θei = gi−1 ti hi(eq) , i.e., we can calculate the ex-post traffic usage by estimating the ex-post QoSqeand ex-post level of competitionνe. This estimation for the two parameters (ν,eqe), calledcongestion metric, alleviates each CP from estimating all other CPs’ characteristics and greatly simplifies our analysis.
4.1
Outcome of the Simultaneous Game
Intuitively, we can use the competitive equilibrium to cap-ture the steady state of the system, or the outcome of the
simultaneous game. However, we will show later that there does not always exist a competitive equilibrium for the game. In this section, we derive the conditions for the existence of the competitive equilibrium, and explore how to determine the outcome of the game when there is no equilibrium. We also design an algorithm to quickly find out the unique out-come of the game over the feasible space of exponential size.
4.1.1
Sufficient Capacity
According to Definition 1, when the ISP has a sufficient capacity, it can support the traffic demand from all users when all services are with the best QoS, i.e., q = 1. This is the reality of the broadband (or wired) network, in par-ticular, with fiber access. As for the wireless network, with the development of 4G LTE, the total demand may be fully satisfied in the future so as to fulfill a sufficient capacity condition. In this case, an end user’s traffic consumption of serviceiis: xi= ( max n 0, g−i1(ti+eν) o i∈ O, g−i1(ti) i∈ S. (13)
To see each CP’s decision, we first define therelative pri-ority of CPias:
ρi=gi (vi−ci−p)gi−1(ti)/(vi−ci)−ti. (14)
This relative priority is the highest critical level of competi-tion that CPican tolerate in the ordinary class. A smaller relative priority of a CP means a higher incentive or priority to join the sponsored classS. Then, CPi’s choice is:
i∈
O ifρi≥eν,
S ifρi<eν.
(15) The key point to find an equilibrium is to decide the cor-responding level of competitioneν. We first relabel the CPs according to a non-increasing order ofρisuch thatρi≥ρjif
i < j. Then, we define setHlas the set of firstlCPs. Given
the choices of CPs as (Hl,N/Hl), we can obtain the level
of competition ν(Hl) according to the optimization
prob-lem (3), and this value increases with respect to l. When the sequences{ν(Hl)}and{ρl}are smooth enough, i.e., the
differences between any two neighboring elements are small enough, we can approximately view them as continuous se-quences. The intersection points of these two sequences, if exist, are the levels of competitionνe. Otherwise, the level of competition is zero orν(HN). We use this rough
descrip-tion to illustrate the idea on finding the level of competidescrip-tion; in what follows we describe the detailed conditions for the existence of competitive equilibria based on this idea.
Theorem 1. If there does not exist a positive number l
such that ν(Hl−1) < ρl < ν(Hl), then there exists at least
one competitive equilibrium.
Proof. Please refer to the technical report [29].
When there exists a positive numberlsuch thatν(Hl−1)<
ρl< ν(Hl), neitherS norO will be chosen by CPl. When
CPl choosesO, thenS becomes a better choice sinceρl<
ν(Hl); when CPlchoosesS, thenObecomes a better choice
sinceν(Hl−1)< ρl. The intuition is that CPl’s decision to
join either class results in a jump on the level of competi-tion, i.e., ν(Hl)−ν(Hl−1). This jump can in turn change the original decision of CPl.
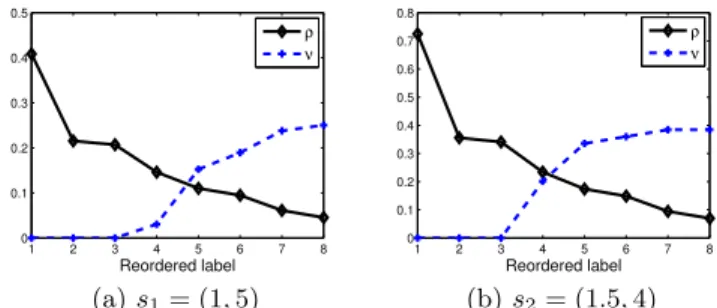
1 2 3 4 5 6 7 8 0 0.1 0.2 0.3 0.4 0.5 Reordered label ρ ν (a)s1= (1,5) 1 2 3 4 5 6 7 8 0 0.1 0.2 0.3 0.4 0.5 0.6 0.7 0.8 Reordered label ρ ν (b)s2= (1.5,4)
Figure 2: Examples of equilibria under sufficient capacity
When there is no competitive equilibrium, we still need to analyze the outcome of this game. Due to the fact that the sponsored data plan contracts between the ISP and CPs are usually of long term, it is impossible for CPs to always change their decisions, but in fact, their decisions will last for a relatively long time. To determine such decisions as the outcome of the game, we assume that any particular CP, say, CPl, makes its decision according to the following nearest point rule:
l∈
O ifν(Hl)−ρl≤ρl−ν(Hl−1),
S ifν(Hl)−ρl> ρl−ν(Hl−1).
(16) The key point for this rule is that the unstable CP joins the set with the level of competition nearer to its relative pri-ority. A binary-search algorithm can be designed to find the outcome of the game when the ISP’s capacity is sufficient. We denote the binary-search algorithm asF indEqInt() with input{ρl},{Hl}and{ν(Hl)}. This algorithm adopts
half-interval search to find the intersection point between sorted sequence{ρl}and {ν(Hl)} according to the nearest point
rule.
Numerical Example: To intuitively understand the out-come of the game, we give a numerical example of eight CPs with parametersαi∈ {1,3},βi∈ {1,2}andγi∈ {0.5,1.5}.8
We setci = 1 andti = 0.5. The per unit revenues for the
eight CPs are{3,· · ·,10}accordingly.
Figure 2 shows the level of competition sequences{ν(Hl)}
and relative priority sequences{ρl}under two cases of the
ISP’s strategies, i.e., s1 = (1,5) and s2 = (1.5,4). The set HN = {2,4,1,6,8,3,5,7} and the first four CPs join
O under both strategies s1 and s2 since ρl > ν(Hl) for
l∈ {1,2,3,4}. Then let us consider CP 8 under s1. When it joinsO, it findsρ5 < ν(H5) and thus joining S is a bet-ter choice. However, when it joinsS, it finds ρ5 > ν(H4) and thus joiningOis better. Therefore, there is no equilib-rium for CP 8 unders1. This oscillation does not happen unders2 since ρ5 < ν(H4). Thus CP 8 joins S, and the equilibrium of the simultaneous game isO={2,4,1,6}and
S ={8,3,5,7}. When we adopt the nearest point rule in Eq. 16, CP 8 joins the O unders1, so the outcome of the game isO={2,4,1,6,8}andS={3,5,7}.
4.1.2
Insufficient Capacity
8In this example, the sequence of parameters of CPiis given by (γβα)2 = (i−1)10, where α= 0 indicates CPichooses the first value ofαi, i.e.,αi= 1; otherwiseαi= 3 is chosen.
Similarly,βiandγi are determined by sequencesβandγ.
Currently wireless data networks often lack capacity. ISPs often cannot support all traffic demand under the best pos-sible QoS. Traffic cap is usually set to limit end users’ traffic usage so as to alleviate the congestion problem. Finding an equilibrium of the game (M, µ,N, sI) under the
insuffi-cient capacity is complex since we need to consider a pair of parameters (eν,eq) rather than one single parameter eν. The interactions betweeneν andeqmake the problem more com-plicated. To find an equilibrium, we first fix the QoS in-dex q. Then we can obtain the relative priority sequence
{ρl(q)}under this QoS index. Similar to the sufficient
ca-pacity case, the competitive equilibrium O(q),S(q) can be calculated according to the binary-search algorithm. This equilibrium results in a new QoS index, i.e.,q0 O(q),S(q)
. When this new QoS index is equal to the original QoS index, i.e., q0 O(q),S(q)
=q, then we obtain a competitive equi-librium O(q),S(q)
. The following theorem quantifies the condition for the existence of competitive equilibria under the insufficient capacity case.
Theorem 2. If there does not exist a QoS indexq∗such that q O(q+),S(q+)
< q∗ < q O(q−),S(q−)
whereq−=
q∗−,q+=q∗+(is any sufficiently small positive num-ber), then there exists at least one competitive equilibrium.
Proof. Please refer to the technical report [29].
If there exists a QoS indexq∗such thatq O(q+),S(q+)< q∗< q O(q−),S(q−)
, then the choices of CPs oscillate. Un-der different choices of CPs, the QoS index changes around
q∗but never converges to a stable point. Similarly, in order to capture the outcome of the simultaneous game, we also adopt the nearest point rule, i.e.,
(O,S)← O(q−),S(q−) ifq∗≥q, O(q+),S(q+) ifq∗< q, (17) whereq=1 2 q O(q − ),S(q−) +q O(q+),S(q+) . Algorithm 1FindEq() Input: (N, µ,M, sI) Output: (O,S) 1: Initialize (ν[0], q[0]); 2: Calculate (O[0],S[0]) induced by (ν[0], q[0]); 3: t←0; 4: do
5: Calculate{ρl(q[t])}and sort them according to a
non-increasing order; 6: Calculate{Hl[t]}and{ν(Hl[t])}; 7: (O[t+1],S[t+1])←F indEqInt({ρl(q[t])},{Hl[t]},{ν(Hl[t])}); 8: Calculate (ν0[t], q0[t]) induced by (O[t+1],S[t+1]); 9: q[t+ 1]←q[t] +g[t](q0[t]−q[t]); 10: t←t+ 1; 11: untilt < T or (O[t],S[t]) == (O[t−1],S[t−1]) 12: return(O[t],S[t]).
We design Algorithm 1, calledF indEq(), to search the outcome of the game under the insufficient capacity. It starts with initializing congestion metric (ν[0], q[0]) and calculat-ing CPs’ choices (O[0],S[0]) (line 1 to 3). In each step t, after obtaining the relative priority of CPs under the QoS indexq[t], the algorithm calculates the outcome according to the binary-search algorithm F indEqInt() (line 5 to 7).
0.5 0.6 0.7 0.8 0.9 1 0.5 0.6 0.7 0.8 0.9 1 q ˜ q ˜ q=q ˜ q=q′(q) (a)s1= (0.5,5) 0.5 0.6 0.7 0.8 0.9 1 0.5 0.6 0.7 0.8 0.9 1 q ˜ q ˜ q=q ˜ q=q′(q) (b)s2= (1,4)
Figure 3: Examples of equilibria under insufficient capacity
Then it updates the QoS index q[t+ 1] based on q[t] and the induced QoS index q0[t] (line 8 to 10). The step size parameter g[t] can be time-static or decreasing in t. The algorithm terminates when the round time approaches the maximal number, i.e.,T, or the outcome is stable (line 11).
Numerical Example: We provide a numerical example with the same CPs under the sufficient capacity case (in Sec-tion 4.1.1). We set the capacity asµ= 6. Figure 3 shows the QoS index under the outcome for two ISP’s strategies, i.e.,
s1 = (0.5,5) ands2= (1,4). This QoS index is determined by the cross point of ˜q = q0(O(q),S(q)) and ˜q = q as dis-cussed previously. Figure 3(a) shows non-existence of equi-libra. We haveq∗ = 0.8815 such that q O(q+),S(q+) < q∗ < q O(q−),S(q−)
. The CPs’ choices oscillate between (O,S) = ({2,6,8,4,5,7},{1,3}) with QoS index ˜q= 0.9453 and (O,S) = ({2,6,8,4,5},{1,3,7}) with QoS index ˜q = 0.7891. When we adopt the nearest point rule in Eq. 17, ¯q= 0.8672< q∗, the outcome is (O,S) = ({2,6,8,4,5,7},{1,3}). Figure 3(b) shows the case with no oscillation and thus there is a unique equilibrium (O,S) = ({2,4,1},{3,5,6,7,8}).
4.2
Characteristics of the Outcome
Given the ISP’s decision sI = (p, C), content providers
play the simultaneous game (M, µ,N, sI). We denote the
outcome of the game (M, µ,N, sI) as (O,S) and the
cor-responding congestion metric as (ν, q). Given different de-cisions of the ISP, CPs play different simultaneous games and may lead to different outcomes. We have the following theorem to quantify the condition that leads to the same outcome.
Theorem 3. Consider a new decision of the ISP s0I
sI and denote the outcome of the new simultaneous game
(M, µ,N, s0I)as(O
0
,S0
). If(O0
,S0
) = (O,S), then for any
˜
sI satisfyingsI˜sIs0I,(O,S)is also the outcome of the
new game(M, µ,N,s˜I).
Proof. Please refer to the technical report [29]. Theorem 3 states that when two decisions of the ISP lead to the same outcome of the simultaneous game, then any decision in between has the same outcome. This stability of CPs’ outcome provides some flexibility for the ISP’s strat-egy. For example, the ISP may increase the price charged to the sponsored data and reduce the traffic cap slightly so as to increase its revenue and improve QoS, where the
si-multaneous game has the same outcome. AsN → ∞, this
stability shrinks and finally disappears. Extended from the above theorem, we can easily obtain the following corollary.
Corollary 1. Denote the relative priority of CP i un-der the outcome of the game(M, µ,N, sI)and the new game
(M, µ,N, s0I) as ρi and ρ0i, respectively. If s0I sI and
(O,S) is the outcome of both games, thenρ0i−ν
0
≥ρi−ν.
Corollary 1 states that the gap between the relative priority and the level of competition for each CP increases when the ISP increases its price charged to the sponsored data or the traffic cap. According to CPs’ choices in Eq. 15, this gives each CP higher incentives to join the ordinary class.
Theorem 4. The congestion metric(ν0, q0)under the out-come of the new game(M, µ,N, sI)(≥1)satisfies at least
one of the following properties: 1) ν0≤ν; 2)q0≥q. Proof. Please refer to the technical report [29].
Theorem 4 states that if the ISP’s capacity increases, then QoS improves, or the level of competition reduces. High QoS increases the traffic demand in S, while low level of competition increases the traffic demand in O. Therefore, when the ISP’s capacity increases, it may benefit CPs inS, or those inO, or both.
Each CP’s decision depends on their own features (vi, ci),
the quality sensitivity γi, the pre-set threshold ti of end
users, and the traffic sensitivity βi. To investigate the
in-centives of various CPs on joining the sponsored plan, we study a setT of CPs with the same pre-set thresholdtiand
traffic sensitivity βibut different features (vi, ci) and
qual-ity sensitivqual-ityγi. This setting represents those with similar
services but differing in size or technology. We say that CPs inT are of thesame type. We have the following theorem.
Theorem 5. If CP j ∈ T joins S under the outcome of the game (M, µ,N, sI), then any other CP i ∈ T that
satisfiesvi−ci≥vj−cj andγi≥γj also joinsS.
Proof. Please refer to the technical report [29].
Theorem 5 indicates that for the same type of CPs, those with high per unit revenue or quality sensitivity usually have high incentives to join the sponsored class, and in turn they have potential to achieve higher revenue. This may result in unfair competition and encourage CPs to pursue capital instead of improving their quality of service.
5.
MONOPOLISTIC ISP’S STRATEGY
In the previous section, we have analyzed the outcome of the simultaneous game, i.e., the second stage of the Stackel-berg game. In this section, we discuss the first stage of the Stackelberg game, i.e., the monopolistic ISP’s best choice, so that we can understand the outcome of the Stackelberg game and its impacts to CPs and end users.
5.1
Sufficient Capacity
When the ISP has a sufficient capacity, it can support all demands with the best QoS. However, this does not imply that the ISP has an incentive to release the cap to users.
Theorem 6. Given any strategy sI = (p, C) of the ISP
and a sufficiently small >0, the strategysI is dominated
by s+I = (p, C +) if and only if CPs’ decisions remain
unchanged under the new game(M, µ,N, s+
I).
Theorem 6 states that the ISP has an incentive to enlarge its traffic cap until the CPs’ decisions change. The intuition is that when CP’s decisions remain unchanged, a large cap increases the revenue fromO. Yet, this may lead CPs inS
switching toO. When this happens, the profit fromS has a jump of reduction. The total profit of the ISP increases if the profit increase fromOdominates the loss from S, or decreases otherwise. If the sponsored data plan is prohib-ited, i.e.,p→ ∞, then the ISP will set the cap to infinity. This is because when the capacity is not a constraint, the ISP wants to attract users’ demand as much as possible, so that it delivers as much traffic as possible for CPs, and this generates a large income to the ISP charged from CPs.
We conduct simulations with 100 CPs and one ISP to explore the key features of the ISP’s strategy. The pre-set thresholdtiis randomly selected from [0.1,1]9. The per unit
traffic cost of connection services for each CP is normalized asci= 1. We set the CPs’ per unit revenuevirandomly
dis-tributed over [1,10] that excludes the CPs unable to afford connection services. The quality sensitivityγi is uniformly
distributed over [0,2]. The parameter pair (αi, βi) is chosen
randomly from [1,10]×[1,2]10. We set the ISP’s per user capacity as 500, larger than the maximal capacity needed for one user, representing a sufficient capacity. Note that our simulations do not depend on particular settings, and our purpose is to show qualitative trends in general.
We first consider the ISP’s optimal traffic cap under dif-ferent prices, as shown in Figure 4(a). When the traffic cap is small, e.g.,C = 20, the ISP’s profitπdecreases with the traffic cap. This means the profit loss from S dominates the increase fromO. Charging higher prices to CPs leads to a larger reduction of the ISP’s profit when the traffic cap increases. When the traffic cap is large, e.g.,C = 100, the ISP’s profitπincreases with respect to the traffic cap. This means the profit increase fromOdominates the loss fromS. This happens when most CPs joinO. Enlarging the traffic cap increases the ISP’s profit until the traffic usage in O
approaches the maximal demand. Figure 4(b)(c) show that CPs’ and consumers’ utilities both increase with respect to the traffic cap.
We then show the ISP’s optimal price under various traffic caps in Figure 5(a). When the price is low, e.g., p= 0.1, the ISP’s profit increases with the price due to high revenue obtained fromS. When the price is high, e.g., p = 7, the ISP’s profit reduces with the price since more CPs choose to joinO, resulting in the reduction of the sponsored traffic. The ISP decides the optimal price that balances the per unit income from the sponsored traffic, and the amount of this traffic. Figure 5(b)(c) show that CPs’ and consumers’ utilities decrease with respect to the traffic cap.
Remark: When the ISP’s capacity is sufficient, the ISP, CPs and consumers all benefit from the sponsored data plan in the short run. However, the ISP may not have incentives to enlarge its traffic cap. Keeping a small traffic cap (e.g.,
C = 10) and charging a high price (e.g., p = 4) to the sponsored traffic can bring in more revenue for the ISP. This selfish strategy greatly hurts the benefits of both CPs and 9
We exclude the interval [0,0.1] since consumers always have non-ignorableti; otherwise they will consume infinite traffic.
10
We exclude [0,1] forαito ensure non-zero traffic usage and
narrow the range ofβito avoid some CPs’ traffic dominating
the capacity.
consumers in the long run. To remedy this problem, the authority may need to put some regulations to the ISP so as to protect the consumers’ surplus in the long run. In general, there are two regulation methods. The first method is to allow the sponsored data plan but regulate the traffic cap, i.e., encouraging the ISP to enlarge the cap. The price for the sponsored data will also decrease accordingly. The other method is to forbid the sponsored data plan. In this case, the ISP has incentives to extend its traffic cap or even provide limitless usage service.
5.2
Insufficient Capacity
When the ISP’s capacity is insufficient, the traffic cap set by the ISP is a good choice to limit the traffic of consumers. We analyze the ISP’s strategy with insufficient capacity un-der the sponsored data plan. We also assume thatci=cin
this subsection. We have the following theorem:
Theorem 7. Given the ISP’s strategy sI = (p, C) and
a traffic cap C0 ≤ C, sI is always dominated by (p, C0) if
the outcome of the simultaneous game(M, µ,N, sI)satisfies
S 6=∅andq <1.
Proof. Please refer to the technical report [29].
Theorem 7 says that the ISP is willing to set a small traf-fic cap so as to increase its profit. The reasons are: 1) the capacity is fully utilized, so it is good to limit users’ con-sumption; and 2) the sponsored traffic brings in more profit to the ISP than the ordinary traffic. When a smaller traffic cap is given, more CPs will joinS, indicating a larger profit. We also evaluate the effects of the sponsored strategy un-der an insufficient capacity via simulations. The basic set-tings are the same as the previous subsection. The price charged for the sponsored traffic isp= 4, and the average capacity is λ = 100 unless otherwise specified. We define the traffic cap ratio asκ=C/λ.
We first consider the effect of the ISP’s capacity under various traffic caps, as shown in Figure 6. Figure 6(a) shows the ISP’s profitπunder different capacities. When the ca-pacity is small, the ISP’s profit increases linearly with re-spect to the capacity, i.e., (c+ (1−κ)p)λ. This happens when the capacity allocated toS(or sponsored capacity for short) is fully utilized. When this capacity is under-utilized, the ISP’s profit reduces when the capacity increases since more CPs joinO. In addition, the ISP can obtain a higher profit by reducing the traffic cap. Figure 6(b) shows that the CPs’ surplus increases with respect to the traffic capac-ity until all CPs joinO. Figure 6(c) shows that consumers’ surplus increases with respect to the ISP’s capacity. When the sponsored capacity is under-utilized, consumers’ surplus increases at a much lower rate. In addition, CPs and con-sumers benefit more from the increasing cap. Figure 6(d) states that QoS improves with respect to the capacity as long as the sponsored capacity is fully utilized. Given a fixed capacity, a larger traffic cap may not indicate a higher QoS.
We then focus on the effect of the price charged to the sponsored traffic under various traffic caps, as shown in Fig-ure 7. FigFig-ure 7(a) shows the ISP’s profit πunder different prices. When the pricepis small, the ISP’s profit increases linearly with respect to the price, i.e.,cλ+ (1−κ)λp. This happens when most CPs can afford the cost of the sponsored traffic so that the sponsored capacity is fully utilized. When
0 50 100 150 0 50 100 150 200 250 300 350 400 450 Traffic cap ISP’s profit p=0.1 p=1 p=4 p=7 p=∞
(a)πvs. traffic cap
0 50 100 150 0 100 200 300 400 500 600 700 800 900 Traffic cap CPs’ surplus (b)φvs. traffic cap 0 50 100 150 0 50 100 150 200 250 Traffic cap Consumers’ surplus (c)ψvs. traffic cap
Figure 4: π, φ, ψversus traffic cap with varying prices
0 2 4 6 8 100 200 300 400 500 600 Price ISP’s profit cap=10 cap=50 cap=100 (a)πvs. price 0 2 4 6 8 0 100 200 300 400 500 600 700 800 900 Price CPs’ surplus (b)φvs. price 0 2 4 6 8 100 150 200 250 Price Consumers’ surplus (c)ψvs. price
Figure 5: π, φ, ψversus price with varying traffic caps
100 200 300 400 50 100 150 200 250 300 350 400 450 Avg. capacity ISP’s profit (a)πvs. capacity 100 200 300 400 300 400 500 600 700 800 900 Avg. capacity CPs’ surplus (b)φvs. capacity 100 200 300 400 50 100 150 200 250 Avg. capacity Consumers’ surplus (c)ψvs. capacity 100 200 300 400 0.2 0.3 0.4 0.5 0.6 0.7 0.8 0.9 1 Avg. capacity Quality of service κ=0.1 κ=0.3 κ=0.5 κ=0.7 κ=0.9 (d)qvs. capacity
Figure 6: π, φ, ψ, qversus capacity
0 2 4 6 8 50 100 150 200 250 300 350 400 450 Price ISP’s profit (a)πvs. price 0 2 4 6 8 0 100 200 300 400 500 600 700 800 900 Price CPs’ surplus (b)φvs. price 0 2 4 6 8 50 100 150 200 250 Price Consumers’ surplus (c)ψvs. price 0 2 4 6 8 0.4 0.5 0.6 0.7 0.8 0.9 1 Price Quality of service κ=0.1 κ=0.3 κ=0.5 κ=0.7 κ=0.9 (d)qvs. price
pis large, the ISP’s profit reduces as the price increases. This happens when the sponsored capacity is under-utilized. The optimal price of the ISP is aroundp= 4. Figure 7(b) shows that CPs always prefer higher traffic cap and lower price charged to the sponsored traffic. Figure 7(c) shows that consumers’ surplus is almost aligned with the ISP’s profit. This happens when the traffic cap is not too small. The op-timal price for end users is also aroundp= 4. The intuition is that a low price results in serious QoS degradation and reduces the valuation of per unit traffic, while a large price results in the sponsored capacity under-utilized and reduces the traffic amount. Figure 7(d) shows that the QoS index increases with respect to the price until it reaches its maxi-mal value, i.e.,q= 1, since more CPs joinOand less traffic is consumed.
Remark:When the capacity is insufficient, the ISP still has no incentives to enlarge the traffic cap under the sponsored strategy. The traffic cap has a negligible effect on the QoS. Other factors, i.e., the price and the capacity, can be uti-lized to impact QoS. This may relieve the concerns of QoS
degradation by the sponsored data plan. The ISP has a
strong incentive to enlarge its traffic capacity until the best QoS achieves. This benefits both CPs and users. The ISP also prefers to set a high price due to a linear increase of its profit, i.e., (c+ (1−κ)p)λ. Yet, when the price is too high, more CPs will join the ordinary class and the spon-sored capacity may be under-utilized. A suitable traffic cap and price charged for the sponsored traffic can increase the ISP’s profit so as to support it on enlarging the traffic ca-pacity in the future. The CPs prefer the sponsored strategy with a large traffic cap and a low sponsored price, which is always on the contrary to the ISP’s optimal strategy. The ISP’s and consumers’ surplus can increase simultaneously if the majority of capacity is allocated to the ordinary class.
6.
DISCUSSION AND LIMITATION
Sponsored data plan was originated from the 1-800 ser-vices, but the market for wireless data networks is quite different. Currently, the main 3G and 4G LTE data plans set traffic caps to limit consumers’ usage due to insufficient capacities. The sponsored data plan proposed by AT&T provides a method for specific CPs to traverse the traffic caps. A potentially higher revenue may support the invest-ment for larger capacities and thus improve QoS. For the time being, AT&T only provides the toll-free services for its sponsored data plan, probably because consumers have a strong preference to a simple data plan. Our two-class ser-vice model (i.e., ordinary class and sponsored class) is built based on the data plans at status quo.
In fact, the sponsored data plan does not differentiate services from CPs in the ordinary and the sponsored classes. In other words, the quality of services is the same for both classes. This is different from PMP [33] or Public Option ISP [22]. However, CPs in the ordinary class face serious levels of competition. This is, in some sense, like the bad QoS challenge faced by CPs in the lower charged channel of PMP [33] or the public option ISP [22]. The ordinary class is mainly preferred by CPs with lower per unit revenue, e.g., startup companies. Content providers with higher per unit revenue, e.g., Google, prefer joining the sponsored class. This may also happen to CPs that are sensitive to QoS since they may fail to compete for the traffic from end users’ scare
traffic cap. Although the sponsored data plan opens a door for CPs to increases their traffic demand, it also brings the risk that when competition happens, it benefits more to CPs with higher per unit revenue, instead of those with better technology support.
The sponsored data plan brings higher revenue to ISPs. However, ISPs may prefer high prices for the sponsored data and small traffic caps (Theorem 7) under current wireless data networks. This selfish strategy hurts both consumers and CPs. Fortunately, the damage for consumers is negnigi-ble when the majority capacity is allocated to the ordinary class (Figures 6(c) and 7(c)). ISPs can also relieve from the concerns of poor QoS caused by the sponsored data plan (Figures 6(d) and 7(d)). Suitable revenue encourages ISPs to provide more investment to extend the capacity, which benefit both consumers and CPs. Despite the potential risks, we believe that a fair and transparent sponsored data plan would provide a unified platform for competition among CPs and create a healthy ecosystem in wireless data networks.
Although we build our two-class service model based on the currently dominated data plans and capture the interac-tions among various components, our work has several lim-itations. First, our model may not capture the short-term off-equilibrium that usually happens in practice due to some players’ non-rational or non-optimal decisions. Second, our two-class model only focuses on a single ISP and its fixed end users. We set up this model not only for mathematical simplicity, but also capture one ISP’s monopoly access power for a majority of CPs even in the market with multiple ISPs. Current long-term contracts also limit end users’ transition from one ISP to another. However, it is still interesting to explore the competitive market with multiple ISPs. Finally, our numerical evaluations are limited to capture qualitative trends. Carrying out real experiment or detailed validation could be very challenging, since it is quite difficult to obtain an accurate estimation on a number of parameters in our model. Despite these limitations, we still believe our anal-ysis has captured some important insights and might help the scheme and regulation designs for future wireless data pricing markets.
7.
CONCLUSION
In this paper, we propose a two-class service model, ana-lyze the interaction among end users, content providers and the ISP, and study the impact of the sponsored data plan on the Internet service market. In particular, we focus its impact on the quality of service, the profit of CPs and the ISP, and on shaping the users’ traffic consumption behav-iors. Our interesting findings include: 1) when the ISP’s capacity is sufficient, the sponsored data plan benefits con-sumers and CPs in the short run, but the ISP does not have incentives to further improve its service in the long run; 2) when the ISP’s capacity is insufficient, the ISP and end users may both benefit from the scheme, while the ISP and CPs always compete for the revenue; and 3) the sponsored data plan may enlarge the unbalance in revenue distribution be-tween different CPs and result in unfair competition. Our findings provide important insights to designing sponsored data plans and potentially necessary regulations. We be-lieve that given proper regulations, a fair and transparent sponsored data plan would be a promising trend of pricing models for future wireless data networks.
8.
ACKNOWLEDGMENT
The authors would like to thank the anonymous reviewers for their constructive comments. Dan Wang is supported in part by National Natural Science Foundation of China No. 61272464 and RGC/GRF PolyU 5264/13E. Weijie Wu is supported in part by National Natural Science Foundation of China No. 61402287 and Shanghai Yangfan Project No. 14YF1401900.
9.
REFERENCES
[1] Google, “International broadband pricing study: Dataset for public use.”
http://policybythenumbers.blogspot.gr/2012/08 /international-broadband-pricing-study.html. [2] H. Raj, S. Saroiu, A. Wolman, and J. Padhye,
“Splitting the bill for mobile data with simlets,” in
Proc. of ACM HotMobile, 2013.
[3] S. Ha, S. Sen, C. J. Wang, Y. Im, and M. Chiang, “Tube: Time-dependent pricing for mobile data,” in
Proc. of ACM SIGCOMM, 2012.
[4] L. Zhang, W. Wu, and D. Wang, “Time-dependent pricing in wireless data networks: Flat-rate vs. usage-based schemes,” inProc. of IEEE INFOCOM, 2014.
[5] AT&T, “Sponsored data from at&t.”
http://developer.att.com/apis/sponsored-data. [6] P. Goldstein, “Google joins with india’s bharti airtel
for toll-free wireless internet service.”
http://www.fiercemobileit.com/story/att-ceo-content-providers-asking-toll-free-data-plans/2012-07-18. [7] M. Andrews, U. Ozen, M. I. Reiman, and Q. Wang,
“Economic models of sponsored content in wireless networks with uncertain demand,” inProc. of IEEE Smart Data Pricing Workshop, 2013.
[8] L. Zhang and D. Wang, “Sponsoring content:
Motivation and pitfalls for content service providers,” inProc. of IEEE Smart Data Pricing Workshop, 2014. [9] S. Marek, “Verizon’s shammo: Content providers see
value in toll-free data model.”
http://www.fiercewireless.com/story/verizons- shammo-content-providers-see-value-toll-free-data-model/2013-05-22.
[10] J. Ankeny, “At&t ceo: Content providers asking for ’toll-free’ data plans.”
http://www.fiercemobileit.com/story/att-ceo-content-providers-asking-toll-free-data-plans/2012-07-18. [11] I. Fried, “Fcc chairman says at&t sponsored data
plans warrant watching.”
http://recode.net/2014/01/09/fcc-chairman-says-att-sponsored-data-plans-worth-monitoring/.
[12] P. Goldstein, “At&t sponsored data partner syntonic wireless to launch ’toll-free’ content store.”
http://www.fiercewireless.com/story/att-sponsored- data-partner-syntonic-wireless-launch-toll-free-content-store/2014-07-10.
[13] R. T. B. Ma, D. M. Chiu, J. C. S. Lui, V. Misra, and D. Rubenstein, “Internet economics: The use of shapley value for isp settlement,” inProc. of ACM CoNEXT, 2007.
[14] Y. Wu, H. Kim, P. H. Hande, M. Chiang, and D. H. Tsang, “Revenue sharing among isps in two-sided markets,” inProc. of IEEE INFOCOM, 2011.
[15] P. Njoroge, A. E. Ozdaglar, N. E. Stier-Moses, and G. Y. Weintraub, “Investment in two-sided markets and the net neutrality debate,”Review of Network Economics, vol. 12, no. 4, pp. 355–402, 2013.
[16] P. Hande, M. Chiang, R. Calderbank, and S. Rangan, “Network pricing and rate allocation with content provider participation,” inProc. of IEEE INFOCOM, 2009.
[17] M. Armstrong, “Competition in two-sided markets,”
RAND Journal of Economics, vol. 47, no. 3, pp. 668–691, 2006.
[18] K. Xu, Y. Zhong, and H. He, “Can p2p technology benefit eyeball isps a cooperative profit,”IEEE Transactions on Parallel and Distributed Systems, vol. 25, no. 11, pp. 1101–1111, 2014.
[19] R. T. B. Ma, “Subsidization competition: Vitalizing the neutral internet,” inProc. of ACM CoNEXT, 2014. [20] C. Joe-Wong, S. Ha, and M. Chiang, “Sponsoring
mobile data: An economic analysis of the impact on users and content providers,” inProc. of IEEE INFOCOM, 2015.
[21] M. Andrews, G. Bruns, and H. Lee, “Calculating the benefits of sponsored data for an individual content provider,” inProc. of IEEE CISS, 2014.
[22] R. T. B. Ma and V. Misra, “The public option: a non-regulatory alternative to network neutrality,” in
Proc. of ACM CoNEXT, 2011.
[23] N. Shetty, G. Schwartz, and J. Walrand, “Internet qos
and regulations,”IEEE/ACM Transactions on
Networkin, vol. 18, no. 6, pp. 1725–1737, 2010. [24] M. Yuksel, K. K. Ramakrishnan, S. Kalyanaraman,
J. Houle, and R. Sadhvani, “Quantifying
overprovisioning vs. class-of-service: Informing the net neutrality debate,” inProc. of IEEE ICCCN, 2010. [25] B. E. Hermalin and M. L. Katz, “The economics of product-line restrictions with an application to the network neutrality debate,”Information Economics and Policy, vol. 19, 2007.
[26] S. Li, K. Xu, Y. Liu, and J. Wu, “Edge overlay multicast to support comparable multi-class services,”
Journal of High Speed Networks, vol. 17, no. 1, pp. 13–36, 2008.
[27] R. T. B. Ma and V. Misra, “Congestion equilibrium for differentiated service classes,” inProc. of 49th Annual Allerton Conference, 2011.
[28] S. Boyd and L. Vandenberghe, “Convex optimization,”
Cambridge, U.K.: Cambridge Univ. Press, 2004. [29] L. Zhang, W. Wu, and D. Wang, “Sponsored data
plan: A two-class service
model in wireless data networks,” tech. rep. Available at http://www4.comp.polyu.edu.hk/~cslizhang/sigmetric15-TR.pdf.
[30] J. Mo and J. Walrand, “Fair end-to-end window-based congestion control,”IEEE/ACM Transactions on Networking, vol. 8, no. 5, pp. 556–567, 2000. [31] Citrix, “Mobile analytics report, otcober 2012.”
http://www.citrix.com/.
[32] A. Odlyzko, “The volume and value of information,”
International Journal of Communication, vol. 6, 2012. [33] A. Odlyzko, “Paris metro pricing for the internet,” in