School of Engineering and Technology
i
University of Hertfordshire
School of Engineering and Technology
Detection of Driver Drowsiness and Distraction
using Computer Vision and Machine Learning
Approaches
Ofonime Dominic Okon
Submitted to the University of Hertfordshire in partial fulfilment
of the requirements for the degree of Master of Philosophy (MPhil)
ii
Abstract
Drowsiness and distracted driving are leading factor in most car crashes and near-crashes. This research study explores and investigates the applications of both conventional computer vision and deep learning approaches for the detection of drowsiness and distraction in drivers.
In the first part of this MPhil research study conventional computer vision approaches was studied to develop a robust drowsiness and distraction system based on yawning detection, head pose detection and eye blinking detection. These algorithms were implemented by using existing human crafted features. Experiments were performed for the detection and classification with small image datasets to evaluate and measure the performance of system. It was observed that the use of human crafted features together with a robust classifier such as SVM gives better performance in comparison to previous approaches. Though, the results were satisfactorily, there are many drawbacks and challenges associated with conventional computer vision approaches, such as definition and extraction of human crafted features, thus making these conventional algorithms to be subjective in nature and less adaptive in practice.
In contrast, deep learning approaches automates the feature selection process and can be trained to learn the most discriminative features without any input from human. In the second half of this research study, the use of deep learning approaches for the detection of distracted driving was investigated. It was observed that one of the advantages of the applied methodology and technique for distraction detection includes and illustrates the contribution of CNN enhancement to a better pattern recognition accuracy and its ability to learn features from various regions of a human body simultaneously. The comparison of the performance of four convolutional deep net architectures (AlexNet, ResNet, MobileNet and NASNet) was carried out, investigated triplet training and explored the impact of combining a support vector classifier (SVC) with a trained deep net. The images used in our experiments with the deep nets are from the State Farm Distracted Driver Detection dataset hosted on Kaggle, each of which captures the entire body of a driver. The best results were obtained with the NASNet trained using triplet loss and combined with an SVC. It was observed that one of the advantages of deep learning approaches are their ability to learn discriminative features from various regions of a human body simultaneously. The ability has enabled deep learning approaches to reach accuracy at human level.
School of Engineering and Technology
iii
Acknowledgement
I am immensely thankful to God Almighty, in which in his mercy and loving grace, has protected me and blessed me with wisdom and knowledge to complete this project and research study. He shielded me with love, mercy, and from woes, during my stay at the University. I am eternally grateful and appreciative to him.
With gratitude, I would like to thank my supervisor, Dr. Lily Meng, for her wisdom, ongoing support, attentiveness and impartial advice, whenever I was faced with issues, concerns or challenges during the development and final stages of this project. Thank you for guiding and reinforcing me with patience and unflinching support while on my way to success.
While creating and developing my project, I was blessed and privileged to have continuous support from my dear father, Obong Dominic Edet Okon Umoetok. Thank you for providing me with the much-needed support, advice and also for helping me to see things in perspective. May the good Lord continue to bless you. To my mother, Late Mrs. Dominica Dominic Okon, which bestowed upon on me the motivation and patience to carry out my project successfully. She was a blessing to me and may her soul rest in peace. Furthermore, I would like to thank my siblings, Irene, Dorathy, Anthonia, Pius and Dominica Jnr. for their generous assistance and encouragement. May God bless all of you. I would also like to take this opportunity to thank with recognition, to all members of my family and friends, who has granted me with the inspiration, patience and tranquility during the competition of my project. May God bless you all.
iv
Dedication
I dedicate this project to God Almighty, my father Obong Dominic Edet Okon Umoetok, and also my dear mother, late Mrs. Dominica Dominic Okon.
School of Engineering and Technology
v
Declaration
DECLARATION STATEMENT
I, Ofonime Dominic Okon, the author of this project, hereby declare that this research study titled “Detection of Driver Drowsiness and Distraction using Computer Vision and Machine Learning Approaches” is my own genuine work from beginning to end. All the materials, sources, information and research used in this thesis, were correctly and
satisfactorily acknowledged by means of IEEE Numeric Referencing and Harvard System of Referencing. (ref. UPRAS/C/6.1, Appendix I, Section 2 – Section on cheating and plagiarism)
Student Full Name: Ofonime Dominic Okon
Student Registration Number: 14179916
Signed:
………. Date: 05/11/2018
vi
TABLE OF CONTENTS
LIST OF FIGURES ... x
LIST OF TABLES ... xiii
LIST OF ABBREVIATIONS ... xv
CHAPTER 1 INTRODUCTION ... 1
1.1. Introduction and Background ... 1
1.2. Problem Statement ... 4
1.3. Research Questions ... 5
1.4. Thesis Layout ... 5
CHAPTER 2 SUBJECT REVIEW ... 6
2.1. Drowsiness Behaviors and Levels ... 6
2.2. Types of Distraction and Their Causes ... 7
2.3. Stages of Drowsiness and Distraction Detection ... 10
2.4. Conventional Approaches for Drowsiness and Distraction Detection ... 11
2.5. Deep Learning ... 31
2.6. The Architecture of Convolution Neural Networks ... 34
2.6.1. Convolution Layer ... 34
2.6.2. Pooling Layer ... 35
2.6.3. Fully Connected Layer ... 35
2.7. Activation Functions ... 36
2.7.1. Simple Threshold Function ... 36
2.7.2. Sigmoid Function ... 36
2.7.3. Hyperbolic Function ... 37
2.7.4. Rectified Linear Unit (ReLU) ... 37
School of Engineering and Technology
vii
2.8.1. Mean Squared Error (L2 Loss) ... 37
2.8.2. Hinge Loss ... 38
2.8.3. Cross-Entropy Loss ... 38
2.9. Optimisation Methods ... 39
2.9.1. Backpropagation ... 39
2.9.2. Gradient Descent ... 39
2.9.3. Stochastic Gradient Descent ... 40
2.9.4. Adam Optimiser ... 42 2.10. Regularisation Methods ... 43 2.10.1. Dropout ... 43 2.10.2. Batch Normalisation ... 44 2.10.3. L1 and L2 Normalisation ... 44 2.10.4. Early Stopping ... 45 2.11. Classification Method ... 46 2.11.1. Softmax Classifier ... 46
2.11.2. Support Vector Machines as the Classification Layer of CNN ... 48
2.12. Deep Learning Approaches for Drowsiness and Distraction Detection ... 49
CHAPTER 3 CONVENTIONAL APPROACHES ... 57
3.1. Introduction ... 57
3.2. Face Detection ... 57
3.2.1. Viola and Jones Face Detection Algorithm ... 58
3.3. Eye Detection ... 61
3.4. Yawning Detection ... 64
3.5. Head Pose Detection ... 67
3.6. Support Vector Machine (SVM) Classifier ... 68
viii CHAPTER 4
EXPERIMENTS WITH CONVENTIONAL APPROACHES ... 71
4.1. The Detection Algorithms ... 71
4.2. Image Datasets ... 72
4.3. !-Fold Cross Validation ... 76
4.4. Head Pose Detection Results ... 77
4.5. Yawning Detection Results ... 79
4.6. Eye Blink Detection Results ... 82
CHAPTER 5 DEEP LEARNING APPROACHES ... 86
5.1. Introduction ... 86 5.2. Deep CNN Architectures ... 86 5.2.1. AlexNet ... 86 5.2.2. ResNet ... 88 5.2.3. MobileNet ... 90 5.2.4. NASNet ... 92
5.3. Theory of Transfer Learning ... 93
5.4. Distance Metric Learning ... 94
5.5. Triplet Loss ... 95
5.6. Activation Functions with Triplet Loss ... 96
5.6.1. Margin Triplet Loss ... 97
5.6.2. Naïve Triplet Loss ... 98
5.6.3. Batch Triplet Loss ... 98
5.7. Triplet Mining ... 100
5.8. Offline Mining Triplet ... 101
5.8.1. Triplet Sampling ... 102
School of Engineering and Technology
ix CHAPTER 6
EXPERIMENTS WITH DEEP LEARNING APPROACHES ... 104
6.1. Introduction ... 104
6.2. Implementation ... 105
6.2.1. Preliminary Experiments ... 105
6.2.2. Experiment 2: Softmax vs SVC ... 106
6.2.3. Experiment 3: Triplet Loss ... 109
6.3. Kaggle Dataset ... 115
6.4. Implementation Frameworks ... 116
6.5. Evaluation Criteria ... 118
6.5.1. Kaggle Scores ... 118
6.6. Experimental Results ... 119
6.6.1. Preliminary Experiment Results ... 119
6.6.2. Experiment 2 Results ... 127
6.6.3. Experiment 3 Results ... 135
6.7. Conclusion ... 146
CHAPTER 7 CONCLUSION AND FUTURE WORK ... 147
7.1. Conclusion ... 147
7.2. Future Work ... 149
x
LIST OF FIGURES
Figure 2.1: Basic Structure of Drowsiness Detection System using Computer Vision Based
Techniques by Fuletra and Bosamiya [27]. ... 11
Figure 2.2: Block Diagram of Stress Detection System Proposed by Gao et al. [34]. ... 13
Figure 2.3: Distance Parameters and Filtering Area for Eye Blink Detection and Textural Changes Proposed by Nakamura et al. [20]. ... 14
Figure 2.4: The Block Diagram of the System Used in [37] to Detect Facial Expression in a Single Video Frame. ... 15
Figure 2.5: Relation between Artificial Intelligence, Machine Learning and Deep Learning [66]. ... 31
Figure 2.6: Functional Working Diagram of Deep Learning [66]. ... 33
Figure 2.7: A Typical CNN Architecture. ... 36
Figure 2.8: Illustration of Dropout Concept (Taken From [87]). ... 43
Figure 3.1: Haar-Like Features Proposed by Viola and Jones for Face Detection. ... 59
Figure 3.2: Cascade Classifier Structure of the Viola and Jones Algorithm. ... 60
Figure 3.3: Block Diagram of Steps Involved in the Viola and Jones Object Detection Algorithm [102]. ... 60
Figure 3.4: Demonstration of the eye Detection with Region Parameters. ... 62
Figure 3.5: Principle of PERCLOS Computation Proposed by the Weijie et al. [107]. ... 63
Figure 3.6: The Ratio of the eye-Height and Eye-Width Proposed by Weijie et al. [107]. ... 64
Figure 3.7: Mathematical Model of Mouth Proposed by Wang et al. [100]. ... 66
Figure 3.8: General Block Diagram and Respective Output for Mouth Detection [100]. 66 Figure 3.9: Vector Space Representation of a Linear Binary SVM Classifier [115]. ... 69
Figure 4.1: Block Diagram for the Proposed Eye Closure, Yawning and Head Pose Detection Mechanisms. ... 72
Figure 4.2: Examples from Head Pose Dataset. ... 74
Figure 4.3: Examples from Yawning Dataset. ... 75
Figure 4.4: Examples from Eye Blinking Dataset. ... 76
Figure 4.5: (a) Examples of Correct Head Pose Detection (b) Examples of Wrong Head Pose Detection. ... 77
Figure 4.6: Confusion Matrices For "-Fold Cross Validation Results Head Pose Detection ... 79
Figure 4.7: (a) Examples of Correct Yawning Detection (b) Examples of Wrong Yawning Detection. ... 80
Figure 4.8: Confusion Matrices For k-Fold Cross Validation Results Yawning Detection. ... 81
School of Engineering and Technology
xi
Figure 4.9: (a) Examples of Correct Eye Blink Detection (b) Examples of Wrong Eye Blink
Detection. ... 82
Figure 4.10: Confusion Matrices For "-Fold Cross Validation Results Eye Blinking Detection. ... 83
Figure 5.1: Structure of the Adopted AlexNet Deep Architecture used in this Research. 87 Figure 5.2: Residual Learning, Building Block of ResNet (Taken From [75]). ... 89
Figure 5.3: Architecture of ResNet Proposed for the ImageNet Challenge (Taken From [75]). ... 89
Figure 5.4: Concept of Depthwise Convolution Proposed by Howard et al. [130]. ... 91
Figure 5.5: Architecture of MobileNet CNN Proposed by Howard et al. [130]. ... 92
Figure 5.6: Overview of Neural Architecture Search (NAS) (Taken From [126]). ... 93
Figure 5.7: Example of Triplet Before and After Training to Illustrate the Advantage of Triplet Loss Function. ... 96
Figure 5.8: Illustration of Overlapping Issue in Triplet Loss [144]. ... 99
Figure 6.1: Summary of All the Processes Followed in Experiment 2. ... 107
Figure 6.2: Comparison of the Architectures used for Traditional Softmax and SVC. .. 108
Figure 6.3: Summary of Process Followed in Experiment 3. ... 113
Figure 6.4: Example of Single Training Instance using Adaptive Triplet Sampling Strategy. ... 114
Figure 6.5: Pipeline for the Classification of Features Extracted from Neural Network. ... 115
Figure 6.6: Sample Images from Each Kaggle Driver Distraction Challenge Class. ... 116
Figure 6.7: Classification Accuracy and Loss Plots for all Models in Preliminary Experiment. ... 120
Figure 6.8: Confusion Matrices for All Three Models in Preliminary Experiments. ... 121
Figure 6.9: Instances of Correct Classification as Class 7 and Wrong Classification for Class 7 as Class 2. ... 122
Figure 6.10: Instances of Correct Classification as Class 9 and Wrong Classification for Class 9 as Class 0. ... 123
Figure 6.11: Instances of Correct Classification as Class 3 and Wrong Classification for Class 3 as Class 0. ... 125
Figure 6.12: Training Accuracy and Loss Plots for All Models with Softmax Classifier ... 128
Figure 6.13: Confusion Matrices for Models with Softmax Classifier over Validation Dataset. ... 129
Figure 6.14: Confusion Matrices for Models with SVC over Validation Dataset. ... 130
Figure 6.15: Training Loss Plots for All Models with Margin Triplet Loss. ... 135
Figure 6.16: Training Loss Plots for All Model with Naïve Triplet Loss. ... 136
xii
Figure 6.18: Confusion Matrices for Models with Margin Triplet Loss Over Validation Dataset. ... 138 Figure 6.19: Confusion Matrices for Models with Naïve Triplet Loss Over Validation Dataset. ... 139 Figure 6.20: Confusion Matrices for Models with Batch Triplet Loss Over Validation Dataset. ... 140
School of Engineering and Technology
xiii
LIST OF TABLES
Table 2.1: Drowsiness State Levels and Corresponding Behaviors, States and Indicators . 7
Table 2.2: Different Sources of Distraction among Drivers Categorized by NHTSA [7]. . 9
Table 2.3: Contributions of Different Distraction Sources to Vehicle Crashes. ... 10
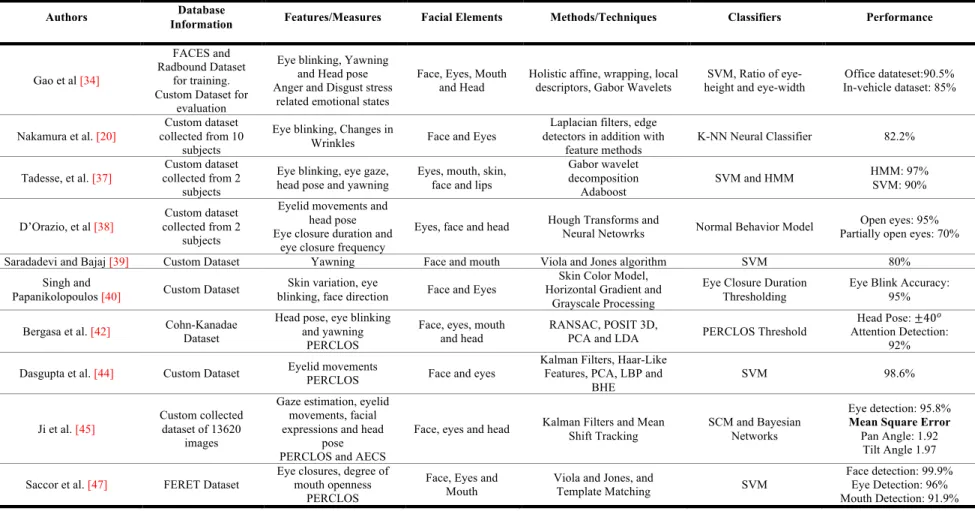
Table 2.4: Comparison of Literature Related to Drowsiness and Distraction Detection using Conventional Computer Vision Approaches. ... 27
Table 2.5: Categorization of Conventional Computer Vision Approaches from Literature for Distraction and Drowsiness Detection. ... 30
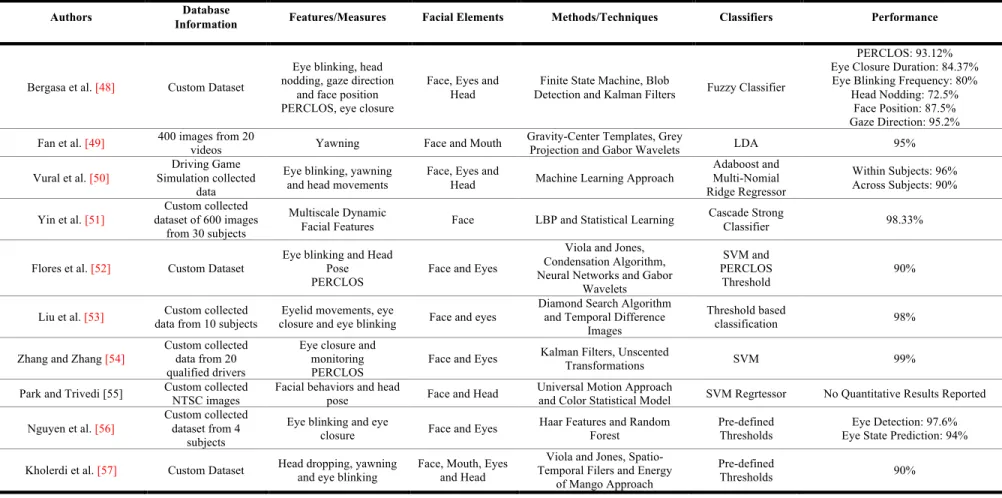
Table 2.6: Comparison of Literature Related to Drowsiness and Distraction Detection using Deep Learning Approaches. ... 55
Table 2.7: Categorization of Deep Learning Based Approaches from Literature for Distraction and Drowsiness Detection. ... 56
Table 4.1: "-Fold Cross Validation Results of Head Pose Detection Algorithm. ... 78
Table 4.2: "-Fold Cross Validation Results of Yawning Detection Algorithm. ... 81
Table 4.3: "-Fold Cross Validation Results of Eye Blink Detection Algorithm. ... 83
Table 4.4: Statistics of SVM Classification for Drowsiness Detection. ... 84
Table 6.1: Prediction Classes for Kaggle Task and Number of Images in Each Class [2]. ... 116
Table 6.2: Comparison of Common Deep Learning Implementation Frameworks. ... 117
Table 6.3: Percentages of Images being Classified as Safe and Distracted for All Three Models ... 124
Table 6.4: Percentages of Images being Classified as Correct and Wrong Distracted Driving for All Three Models. ... 126
Table 6.5: Summary of Experimental Results of Preliminary Experiment. ... 126
Table 6.6: Percentages of Images being Classified as Safe and Distracted for All CNN Model Configuration in Experiment 2. ... 131
Table 6.7: Percentages of Images being Classified as Correct and Wrong Distracted Driving for All CNN Model Configurations in Experiment 2. ... 132
Table 6.8: Kaggle Scores for Models with Softmax and SVC Classifiers Over Test Dataset ... 133
Table 6.9: Times for All Models with Softmax and SVC to Process Single Instance of Test Input. ... 134
Table 6.10: Numerical Comparison of All Models for Training and Validation Accuracies. ... 141
Table 6.11: Percentages of Images being Classified as Safe and Distracted Driving for All CNN Model Configurations in Experiment 3. ... 143
Table 6.12: Percentages of Images being Classified as Correct and Wrong Distracted Driving for All CNN Model Configurations in Experiment 3. ... 144
xiv
Table 6.13: Kaggle Scores for Models with Margin, Naïve and Batch Triplet Loss Functions Over Test Dataset. ... 145 Table 6.14: Times for All Models with Margin, Naïve and Batch Triplet Loss Functions to Process Single Instance of Test Input. ... 145
School of Engineering and Technology
xv
LIST OF ABBREVIATIONS
AAAFTS American Automobile Association Foundation for Traffic Safety
Adam Adaptive Moment Estimation
ADAS Advanced Driver Assistance System
AECS Average Eye Closure Speed
BAIR Berkley AI Research
BHE Bi-Histogram Equalization
BU-3DFE Birmingham University 3D Facial Expression
CCD Charge-Coupled Device
CNN Convolutional Neural Network
DBN Deep Belief Networks
DDD Deep Drowsiness Detection
DOO Degree of Openness
FC Fully Connected
FF-Bp Feed Forward Back Propagation
GPU Graphical Processing Unit
HMM Hidden Markov Model
HOG Histograms Oriented Gradient
LBP Local Binary Patterns
LDA Linear Discriminant Analysis
LRN Local Response Normalization
MAC Multiply and Accumulated
MLP Multiple Layer Perceptron
MSE Mean Squared Error
NAS Neural Architecture Search
NHTSA National Highway Traffic Safety Administration
xvi
NLL Negative Log Likelihood
PCA Principal Component Analysis
PERCLOS Percentage Eye Closure
PRC Percentage Road Centre
RBF Radial Basis Function
ReLU Rectified Linear Unit
RI Region of Interest
RNN Recurrent Neural Network
SGD Stochastic Gradient Descent
SIFT Scale Invariant Feature Transform
SVC Support Vector Classifier
SVM Support Vector Machine
School of Engineering and Technology
1
CHAPTER 1
1.
INTRODUCTION
1.1.
Introduction and Background
The integration of advanced safety systems in modern vehicles has reduced the number of road accidents significantly. However, the number of accidents are still not under an acceptable range. In their research, Murray and Lopez [1] reported that road accidents would be the third main reason for deaths by the year 2020. Fatigue and drowsiness among drivers result in fatal driving errors are considered one of the most important causes of road accidents [2, 3]. The involvement of the number of factors such as driver attention, cognitive skills and physical fitness makes driving a relatively complex task [4]. However, it is not uncommon for drivers to involve themselves in activities that distract their attention from driving tasks. These distraction-related activities significantly degrade the driving performance and, due to the complex nature of driving, result in road accidents. Some common distraction-related activities of drivers include conversations with other passengers, the use of technological devices (mobile phones, navigation systems, radios, etc.), eating and using makeup tools while driving [5]. According to a report published by National Highway Traffic Safety Administration (NHTSA), of all the road accidents, approximately 25% are due to the inattention of drivers [6], and half of those 25% are due to the distraction of drivers [7, 8].
Fatigue and drowsiness are the hypnosis effects among drivers, and the major causes of these effects include lack of sleep, long and continuous drives, illness and the use of drugs
[9]. Although the introduction of advanced comfort level and autonomy in modern day vehicles has improved the safety of drivers, it also contributes to fatigue and drowsiness of drivers [10, 11]. In a study, Sagberg et al. [11] reported that drowsy driving increased the probability of errors in driving due to drivers’ impaired mental capacity. Fatigue and drowsiness-related accidents are considered more fatal and more dangerous compared to normal accidents because of their direct effects on the decision-making abilities of drivers. Fatigue and drowsiness are technically different. Fatigue is defined as the extreme tiredness
2
because of physical and mental exertions when a person is executing some tasks, whereas drowsiness is the state resulted by lack of rest and sleep [3]. However, fatigue and drowsiness are often interchangeable. In many existing driver monitoring systems, both terms are used for the same meaning as the symptoms of both health conditions are almost identical. Hence, in this research, the term of drowsiness will be used to represent the mutual effect of fatigue and drowsiness on driving performance.
In the research carried out by Lal and Craig [12],they pointed out a number of symptoms that could facilitate the detection of drivers fatigue, including eye blinking rate, yawning frequency, variations in mouth positions, variations in head positions and driving patterns. In a report by Federal Motor Carrier Safety Administration [13], the relationship between the number of continuous driving hours and fatigue-related accidents has been indicated and stated that an increase in continuous driving hours increased the percentage of fatigue-related accidents (up to 4 percent increase for 10 continuous hours of driving). Kaggle challenge defined nine types of distracted driving.
According to Bayly et al. [14], the number of road accidents can be reduced by about 20% if there is a proper mechanism that can monitor in-drive behaviours of drivers. The development of efficient driver-attention monitoring systems using the state-of-the-art emerging technologies is one possible solution that can reduce the number of accidents and improve road safety. Dinges and Mallis [15] listed four types of drowsiness detection approaches: the mathematical model-based approach, fitness for duty technologies approach, vehicle performance-based approach and in-vehicle operator monitoring-based approach. The in-vehicle operator monitoring based approach is widely explored by researchers, which uses computer vision-based technologies and studies the physiological signals to detect the attention level of drivers. The computer vision-based approach is non-intrusive and easily applicable in real-time situations. Furthermore, the detection results of these approaches are more effective and adaptive than others; hence, they are active areas for researchers in this domain. In addition to drowsiness, distraction among drivers is equally significant while developing attention-monitoring systems. In one study, Thimbleby et al. [16] indicated how in-vehicle objects could distract drivers and affect their driving performance.
School of Engineering and Technology
3
State Farm has taken an initiative to improve road safety by introducing an initiative called Kaggle challenge for detection of distracted drivers, where camera images of the entire body of the driver are provided for the development of computer vision and machine learning-based algorithms.
This research study aims to improve road safety by applying efficient computer vision and machine learning based algorithms that can detect hazardous driving behaviours such as drowsiness and distraction. Computer vision approaches have been used for face/eye/mouth detection, image normalization, extraction of key features, etc. ML for classification of extracted features in conventional approaches and the learning, extraction and classification of features in the deep learning approaches. Initially, a comprehensive subject review of the most-related literature has been performed. Two different categories of approaches have been identified through the subject review and investigated in the practical work, the category of conventional approaches and the category of deep-learning approaches. The first phase of practical work has involved the use of conventional approaches for the drowsiness-related visual information analysis and predictions. The idea of using the combination of different drowsiness-related features such as eye blinking, yawning and head pose has been adopted to classify drowsy driving effectively.
For the second phase of the practical work, the focus was shifted towards studying deep learning approaches such as Convolutional Neural Networks (CNNs) for detecting distracted driving. In the literature, it has been identified that deep-learning approaches, for instance, CNN are type of deep networks explained in detail in Chapter 5, which involve the extraction and learning of features automatically from the number of hidden layers in the architecture which improves the overall generalization problem. Based on the comprehensive findings from the literature review, for the distraction detection, we have implemented four different pre-trained deep CNN architectures; AlexNet, ResNet, NasNet and MobileNet for detecting distraction among drivers. The proposed models were trained over the large dataset provided by Kaggle [17] and the performance was evaluated and compared.
4
1.2.
Problem Statement
Research carried out in this thesis is within the scope of detecting hazardous driving behaviours such as the distraction and drowsiness using the computer vision and machine learning-based approaches. The monitoring of driving behaviours and the detection of hazardous driving behaviours can significantly improve road safety. Automobile manufacturing companies are investing and interested in developing driving-attention monitoring systems to improve road safety. These systems can warn drivers, most especially when their attention level (distraction and drowsiness) exceeds a certain threshold. Although in the literature there is extensive research in the domain of drowsiness and distraction available, it is rare to see these systems in practice. Furthermore, if the accuracy of is still not satisfactory and false warning of distracted driving is constantly issued, this can be intrusive and thus distract drivers attention unnecessarily and cause unnecessary negative impact to road safety. The objectives of this research are as follows:
• To identify the existing approaches and potential limitations in their practical applications.
• To detect facial regions relevant to drowsiness and distraction detections such as eyes, mouth, face and head positions.
• To extract drowsiness and distraction-related features from the detected facial regions such as the yawning rate, blinking rate, head nodding and head pose.
• To develop an efficient classification algorithm that can classify the extracted facial features and decide the level of distraction and drowsiness based on the classification results.
• To provide a detailed study of CNN and deep learning approaches for object detections (Deep learning approaches).
• To implement deep CNNs which can solve the Kaggle challenge for distracted drivers.
School of Engineering and Technology
5
1.3.
Research Questions
Base on the problem statement, the research questions explored in this research are as follows:
• RQ1: What are the potential challenges hindering the practical implementation of vision based drowsiness and distraction detection systems?
• RQ2: What conventional vision approaches can offer in detecting drowsiness and distraction in drivers?
• RQ3: How to measure and compare the performance of the conventional approaches? How is the performance of the conventional approaches in terms of detection accuracies and generalization?
• RQ4: What deep learning approaches can offer in the detection of distraction in drivers?
• RQ5: How to measure and compare the performance of the deep learning approaches? How is the performance in terms of their training, hyper-parameter time, classification accuracies, processing time, and memory consumption?
1.4.
Thesis Layout
Rest of the chapters in the thesis are organized as follows. Chapter 2 presents the comprehensive subject review regarding the conventional and deep learning approaches for detection of hazardous behaviors in drivers. Chapter 3 presents the theoretical details of conventional vision approaches i.e. face detection, yawning detection, Viola and Jones, eyes detection. Chapter 4 presents the details regarding the implementation of conventional approaches and their corresponding results. Chapter 5 provides the theoretical background of deep learning approaches and different deep architectures used in this thesis. Chapter 6 presents the implementation of deep learning approaches and corresponding results and discussions. Finally, Chapter 7 concludes the thesis and provides potential future directions of research presented in this thesis.
6
CHAPTER 2
2.
SUBJECT REVIEW
This chapter presents a subject review on the detection of hazardous driving behaviours (drowsiness and distraction) using the computer vision approaches; both conventional and deep learning. This chapter explores the different symptoms of drowsiness and distraction and their effects on the driving performance. Furthermore, this chapter reviews the latest literature regarding drowsiness and distraction detection in order to compare the performed research with the state of the art. Finally, this chapter highlights some potential challenges, identified from the literature, which have prevented the practical implementation of real-time driver monitoring systems.
2.1.
Drowsiness Behaviors and Levels
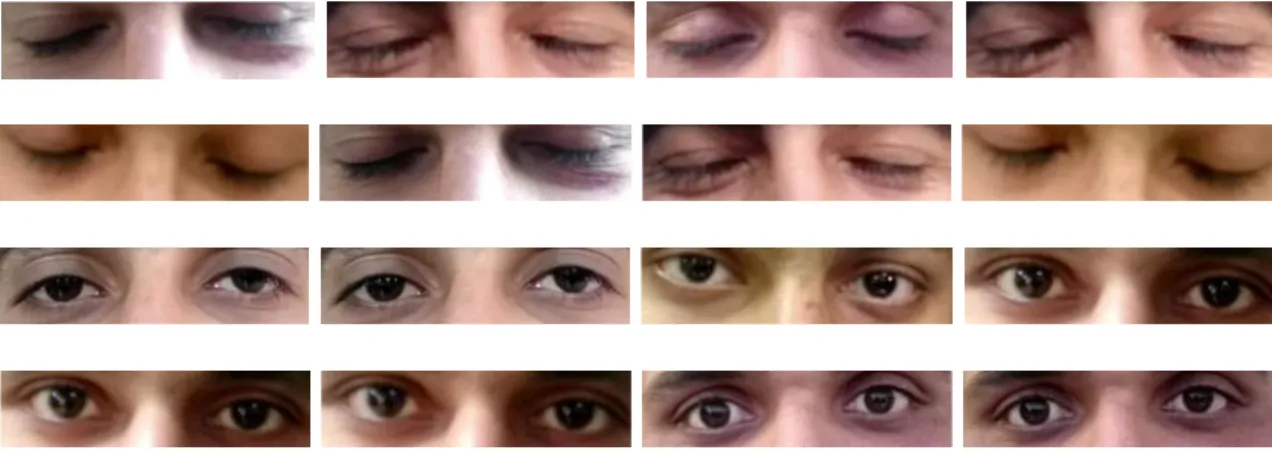
Critical symptoms of drowsiness reported in literature include eye-blinking rate variations, a decline in driving concentration, a change in driver posture, steering grips, signs of depression, head nodding frequency, an increase in yawning frequency, a change in facial expressions, steering behaviour variations, confused thinking, reduced reaction responses, heart rate variations, skin potential variations, variations in brain signals, shallow breathing and frequency of touching face [18, 19]. Eye blinking rate, yawning rate and head position are the most significant signs of drowsiness in drivers.
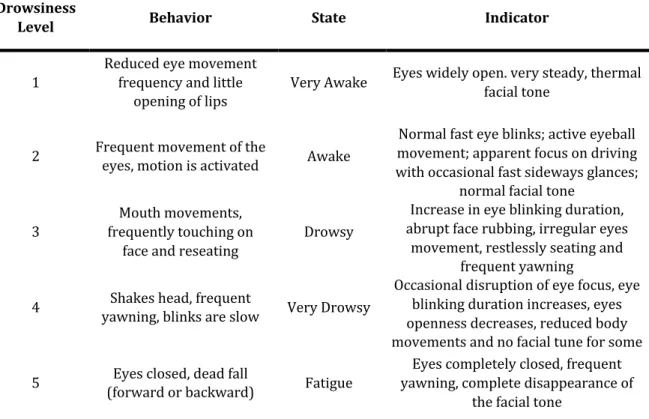
Behaviours of drivers vary according to the level of drowsiness experienced by them. Based on research in [20, 21], Table 2.1 shows five different drowsiness levels and their corresponding behaviours, states and indicators.
School of Engineering and Technology
7
Table 2.1: Drowsiness State Levels and Corresponding Behaviors, States and Indicators Drowsiness
Level Behavior State Indicator
1
Reduced eye movement frequency and little
opening of lips Very Awake
Eyes widely open. very steady, thermal facial tone
2 Frequent movement of the eyes, motion is activated Awake
Normal fast eye blinks; active eyeball movement; apparent focus on driving with occasional fast sideways glances;
normal facial tone 3
Mouth movements, frequently touching on
face and reseating
Drowsy
Increase in eye blinking duration, abrupt face rubbing, irregular eyes
movement, restlessly seating and frequent yawning 4 yawning, blinks are slow Shakes head, frequent Very Drowsy
Occasional disruption of eye focus, eye blinking duration increases, eyes openness decreases, reduced body movements and no facial tune for some
periods. 5 Eyes closed, dead fall
(forward or backward) Fatigue
Eyes completely closed, frequent yawning, complete disappearance of
the facial tone
2.2.
Types of Distraction and Their Causes
Distraction is a sub-type of in-attention, and the American Automobile Association Foundation for Traffic Safety (AAAFTS) as defined distraction as
“Slower response of drivers in recognizing the information needed to perform and complete successful/safe driving task because of some vehicles or outside vehicle events
which shift the attention of drivers from driving task” [22]
According to [22], there are four main types of distraction: visual distraction, biomechanical distraction, cognitive distraction and auditory distraction. The definitions of each type of distraction is given below.
8
• Visual distraction: It is a type of distraction which involves the shift of drivers’ visual field from driving by engaging in events such as observing in-vehicle objects or looking outside the vehicle [23].
• Biomechanical distraction: This involves the diversion of focus from driving because of the engagement of manipulating physical objects [24].
• Cognitive distraction: This type of distraction is directly related to thinking about other events while driving, a distraction that diverts the attention of drivers away from driving [25].
• Auditory distraction: It is a type of distraction which involves drivers’ listening to audio devices such as radio and mobile phones while driving. Furthermore, this type of distraction may be due to drivers conversing with other passengers while driving [25].
Although the distraction is divided into four main categories, it has been observed that occurrence of distracted driving does not take place individually, Rather, the driver may encounter different types of distraction at the same time. In practical scenarios, all four types are inter-linked with each other and occur in combinations collaboratively. A perfect example of this interconnection is a driver answering a phone call while driving. In this particular case, all the four types of distraction mentioned above will occur. Visual distraction occurs when a driver looks at the display information on the cell phone before answering the call and locates the button to answer the call. Physical distraction occurs when a driver moves his hand from the steering to find the mobile phone in order to receive an incoming call. Cognitive distraction occurs when a driver in a call conversation shifts his/her thoughts toward the topic of conversation. Finally, auditory distraction occurs when a driver involves in conversation with someone on a call.
In a report published by the NHTSA [7], thirteen different sources of distraction were identified. These sources can be further categorized into three main streams: technology-based sources, non-technology-technology-based sources and miscellaneous sources. Table 2.2 presents the categorization for the different sources of distraction.
School of Engineering and Technology
9
Table 2.2: Different Sources of Distraction among Drivers Categorized by NHTSA [7].
Type of Distraction Source
Technology-Based
Operating Radio and/or Music Devices Talking and/or Conversing on Mobile Phone
Dialling and/or Using Mobile Phone Adjusting Climate Controls
Using devices/objects brought into vehicles Using devices/controls integral to vehicles Non-Technology-Based
Eating or Drinking Outside Object, Event or Person
Other Passengers in Vehicles Moving Object in Vehicles
Smoking
Miscellaneous Other Distraction Sources Unknown Distraction Sources
Although the introduction of modern and state-of-the-art technological systems such as navigation and entertainment systems has facilitated drivers in many ways, they also contribute to distracted driving. This claim is well-supported by Stutts et al. [7] who predicted that the more the increase in advanced in-vehicle technologies, the more the chances of distraction-related accidents will rise. Stutts et al. [7] and Glaze and Ellis [26]
investigated the impact of distraction and its contributions to road accidents. Stutts et al. explored the data from Crashworthiness Data System and highlighted the contribution of different distraction types in road accidents. On the other hand, Glaze and Ellis investigated the data from Troopers Crash Record and were focused on highlighting different sources of distraction and their involvement in road accidents. Based on these two studies and above-mentioned sources of distraction, a comparison has been carried out to study the impacts of distraction on road accidents and the involvement of different distraction sources. Table 2.3 lists the results.
10
Table 2.3: Contributions of Different Distraction Sources to Vehicle Crashes.
Distraction Type
Stutts et al. Study [7] Glaze and Ellis’s Study [26] Distraction Sources Crashes % of Distraction Source Crashes % of
Technology-Based
Adjusting radio, cassette,
CD* 11.4
Adjusting radio, cassette,
CD* 6.5
Using/dialling mobile
phone* 1.5 Using/dialling mobile phone* 3.9 Adjusting vehicle/climate
controls* 2.8 Adjusting vehicle/climate controls* 3.6
- - Technology device* 0.3
- - Pager* 0.1
Total 15.7 14.4
Non-Technology-Based
Smoking related* 0.9 Smoking related* 2.1 Other occupant in vehicle* 10.9 Passenger/children
distraction* 8.7 Eating or drinking* 1.7 Eating or drinking* 4.2
Moving object ahead** 4.3 - -
Person, object or event** 29.4 - -
- - Grooming* 0.4
- - Other personal items* 2.9
- - Unrestrained pet* 0.6
- - Document* 1.8
Total 47.2 20.7
Miscellaneous
Other distraction 25.6 Other distraction inside
vehicle* 26.3
Unknown distraction 8.6 - -
Object brought in * 2.9 - -
Total 37.1 26.3
* Inside Vehicle Distraction Source ** Outside Vehicle Distraction Source
2.3.
Stages of Drowsiness and Distraction Detection
In general, a drowsiness detection system consists of two main stages; first stage of extracting drowsiness related features from the facial information captured by sensor and second stage of classifying the extracted features to decide on the current state of driver (Drowsy or Active). Face, mouth, eyes and head pose are considered the most relevant facial features to detect the drowsiness in drivers. Figure 2.1 presents the basic structure of
School of Engineering and Technology
11
a drowsiness detection system using computer vision technologies reported by Fuletra and Bosamiya [27].
Figure 2.1: Basic Structure of Drowsiness Detection System using Computer Vision Based Techniques by Fuletra and Bosamiya [27].
Towards the distraction detection, eye glance of drivers has been considered one of the credible measure by researchers [28]. In eye glance approach, total time for eyes off the road is measured for the drivers when involved in performing some secondary task other than driving [29]. Head movements and eye glances of driver are captured and monitored using the camera sensor. Further, modern computer vision based tools such as FaceLAB
[6] are used by the researchers in this domain to measure the eye glances based on eye tracking and head tracking information.
Visual occlusion is another commonly practiced approach by researchers towards detecting distraction in drivers. In visual occlusion technique, visual distraction of drivers is mimicked by temporarily blocking the view of drivers and to measure the road off the eyes. This approach considers that driver does not look on the road always but can be involved in short interval secondary tasks such as adjusting radio and controlling climate. All the secondary tasks which can be performed by driver within two second interval are classified as accepted tasks under this approach. For the defined occluded time interval, a driver can perform secondary tasks without visually looking at them which give the estimate of drivers visual demand to perform a task without getting distracted visually [30]. Visual occlusion based distraction detection approach is considered a promising approach by researchers
[31-33].
2.4.
Conventional Approaches for Drowsiness and Distraction
Detection
This section presents the review of some benchmark existing approaches in the literature regarding the detection of drowsiness and distraction state/level among drivers using the
Image Acquisition Face Detection Eyes Detection Eyes Tracking Drowsiness Detection Alarm
12
computer vision conventional approaches. Conventional approaches involve the extraction of features using the traditional vision-based approaches, the mathematical expressions or manually crafted approaches.
Gao et al. [34] proposed and developed a monitoring system to detect the emotional state of drivers in real-time scenario. The system was non-intrusive, and it used facial expression analysis to detect the emotional state. Facial expressions of drivers were captured in real-time by using in-vehicle camera sensors and were classified into two stress-related states: anger and disgust. The pose normalization approach was used to reduce the effect of head position on the detection and classification results. Figure 2.2 presents the block diagram of the system. The system in [34] included two modules: the face acquisition module and stress detection module working in sequential settings. In the face acquisition module, a Near-Infrared (NIR) was used to capture the real-time images of drivers, and facial landmarks were tracked using the face tracking system. In the stress detection module, at the first stage, the relevant facial features such as face and head pose were extracted using the local descriptors and holistic affine warping from the input captured data of the first module. Furthermore, before moving into the classification stage, pose normalization was applied. In the second stage, the module also provides a set of facial landmarks for the subsequent stress detection module. In the stress detection module, holistic or local texture features are extracted from the normalized facial images. They extracted features were classified using the Support Vector Machine (SVM) technique which is a space vector based machine learning classifier and aims to find the boundary between multiple output classes in a hyperplane, to decide the current emotional state of drivers. Based on the emotional state, the stress level of drivers was determined. SVM was trained offline over the pre-defined data. Two databases were used for this purpose, Radbound [35] and FACES
[36], containing frontal view, evenly illuminated images from 49 and 179 subjects, respectively. In [34] to evaluate their system, two datasets containing images and videos were captured using the in-vehicle NIR camera. Dataset1 was recorded in the office configuration and included data from 21 different subjects. Dataset2 was recorded in the vehicle configuration and included data from 12 different subjects. The algorithm proposed by [34] was independently evaluated for both datasets, and an accuracy of 90.5% and 85%
School of Engineering and Technology
13
was achieved for office and in-vehicle datasets, respectively. Although the algorithm exhibited promising performance over both evaluation datasets, it was not tested for different lighting conditions. In order to implement this system practically, it is of significant importance to validate the system over dataset containing images with different illumination conditions because it has been observed that the performance of vision based algorithms is sensitive to lighting conditions. Furthermore, the system only used the facial expression analysis to decide the stress level which is most probable to fail in situations where the face is not visible; thus, other approaches such as head movements and yawning can be integrated to further improve the results.
Figure 2.2: Block Diagram of Stress Detection System Proposed by Gao et al. [34]. Nakamura et al. [20] developed a system to detect the drowsiness among drivers by proposing the use of facial expression variations captured using infrared camera sensor. Authors proposed the idea of using variations in facial wrinkles along with the eye blink detection to make the system more robust and accurate. Variations in facial wrinkles were determined by calculating the local edge intensities of captured faces. Eye blinking was detected by calculating the distance between different feature points as demonstrated in Figure 2.3 (a). Textural variations were calculated by determining the local edge intensities at different facial regions such as mouth, eyebrows and nasolabial fold areas as demonstrated in Figure 2.3 (b). Laplacian filters were implemented using facial feature points. Extracted feature vectors of facial variations and local edge intensities were classified using a k-nearest neighbors algorithm (k-NN) based estimation algorithm to
Image Acquisition Face Tracking Feature Extraction Emotion Detection Stress Detection Offline Model Training
Face Acquisition Module Stress Detection Module
Pose Normalization
14
determine the precise drowsiness state of drivers. From the results, the authors reported an improvement in detection by using textural features and feature point distances. The recommended algorithm was evaluated over the custom collected dataset from ten different subjects. An overall accuracy of 82.2% was reported for the proposed algorithms from the experimental evaluation. Although the proposed method of using wrinkle based textural features is the novel approach in drowsiness detection, it is important to implement it in real-time. Besides, more extensive validation of the proposed algorithm over the large datasets, including different illuminations, is needed.
Figure 2.3: Distance Parameters and Filtering Area for Eye Blink Detection and Textural Changes Proposed by Nakamura et al. [20].
Tadesse et al. [37] proposed a drowsiness detection system based on the Hidden Markov Model (HMM), a dynamic modelling of facial expressions. [37] uses HMM to perform temporal analysis of the dynamics of facial expressions. The detection of facial in each video frame was carried out by a system as shown in Figure 2.4.They developed a temporal analysis based system which included, change in facial features images caused by the facial movements and compared the proposed temporal analysis based drowsiness detection system with the frame based drowsiness detection system (see Figure 2.4) to highlight its advantages. The dynamic temporal analysis based drowsiness system utilizes the changes in the facial expressions of drivers and tries to associate the relation of those variations with the current drowsiness state of drivers. The authors used yawning, eye gaze, eyelid position and eye blinking as the facial expressions. The inclusion of additional facial features, including the eye blinking, improved the overall accuracy of the system. To detect and track
School of Engineering and Technology
15
the face of drivers, Viola and Jones, and Camshift algorithms were applied to the input from the camera sensor. Important facial features from the captured faces were extracted using the Gabor Wavelet Descriptors. Extracted features were selected in two stages before the final classification stage. In the first stage, a simple threshold-based Adaboost weak learning algorithm, which is a popular learning algorithm used for image classification and face detection. The main idea of AdaBoost is to construct a succession of weak learners through different training sets with different weights. The training sets are derived from resampling the original data and the weights of the hard-to-leam instances will increase during every resample which show the main feature of the AdaBoost. These weak learners are fused through a weighted vote to predict the class label of a new testing instance. They are very effective on the initial stages in eliminating unwanted features. Usually the performance of a weak learner should be slightly better than random guessing and the weak learner is called as base classifier or component classifier. After boosting the final strong classifier can achieve high accuracy and good generalization ability. The authors applied this algorithm in the first stage. In the second stage, adaptive-boosting-based strong classifier was used to. Finally, the selected features from the second stage were classified using the SVM and HMM to decide the drowsiness state of drivers. The proposed algorithm was evaluated over the custom collected dataset from two driving subjects through simulated driving environments for different driving conditions. From the experimental evaluation of the system, an overall accuracy of 97% and 90% was achieved for the HMM-based classifier and SVM-HMM-based classifier. Although the HMM-HMM-based classifier demonstrated a promising detection accuracy, the proposed method was not validated for different illumination conditions and diversity of drivers which are important features towards real-time implementation of drowsiness detection systems.
Figure 2.4: The Block Diagram of the System Used in [37] to Detect Facial Expression in a Single Video Frame.
Input Image Face Detection and Tracking Feature Extraction Feature
16
D’Orazio et al. [38] suggested an attention monitoring system for drivers by using eye analyses and head movements. The team of authors proposed the monitoring of drivers’ eyelids to check if it is opened or closed. Authors used two candidate regions that could contain eyes and used neural classifiers to recognize the eyes from input image sequences. Based on the openness of eyes, the current attentive state of drivers was decided. The eye closure duration and the frequency of eye closure were used as measures for behavioural analysis of determining the level of fatigue among drivers. The proposed algorithm was tested for its eye detection capability and behavioural analysis on a custom collected dataset. Datasets consisted of image sequences of drivers which were captured in the laboratory and in driving situations. An evaluation of the behavioural analysis was performed over eye closure parameters collected from image sequences of two different subjects. From the experimental evaluations, a maximum detection accuracy of 95% and 70% was achieved for subjects with open eyes and partially open eyes, respectively. The proposed algorithm could train itself adaptively during the driving and introduce the novel idea of reading driving habits of drivers to respond accordingly.
Saradadevi and Bajaj [39] developed a fatigue detection system for drivers by analysing the yawning information of drivers captured from the camera sensor. The Viola and Jones algorithm was used by authors to locate the face and mouth of drivers, and the SVM classifier was used to decide the fatigue level of drivers. The suggested algorithm was validated for a custom recorded dataset, and a performance of over 80% detection accuracy was achieved. Although the proposed system showed promising performance, it is more probable to fail when the mouth is not visible in the frame. Hence, the use of other visual information such as eyes and head movements will enhance the overall performance of the proposed system. Furthermore, the proposed system was not validated against extensive dataset; thus, it could not be implemented in real-time unless it was tested for large datasets containing images from the diversity of drivers under variable lighting conditions.
Singh and Papanikolopoulos [40] proposed a system to detect fatigue and distraction among drivers using the facial feature analysis. A colour camera was used by the authors to meticulously scan the driver face for relevant fatigue and distraction-related features such as eyes, mouth and head pose. Prominent skin pixel variations were captured using the skin
School of Engineering and Technology
17
colour mode. Skin like pixels from the input colour facial images were filtered using the skin colour model and were further processed using the blob processing approach to determine the connected areas and exact position of the face accordingly. To localize the eyes in the facial region, a horizontal gradient technique was implemented; however, the grey scale processing approach was used for real-time pupil detection. Information from this processing helped the system to capture the eye blinking variations and face directions. The proposed system was evaluated over a custom recorded dataset of drivers with different skin colours, gender and facial hair. From the experimental results, authors achieved a prolonged eye blink detection accuracy of approximately 95%. Although the proposed system exhibited promising results for the fatigue detection among drivers, it was not tested for different illumination conditions. Furthermore, other fatigue and distraction-related facial features such as yawning, expressions, and nostrils can be integrated to enhance the performance of the overall system.
Percentage Eye Closure (PERCLOS) [41] is one of the most commonly used and reliable measures for detecting visual distraction reported in the literature. PERCLOS is the percentage of eye closure over a given time interval. The feature of detecting slow eye closure rather than blinking makes PERCLOS an accurate measure to detect eye-blinking among drivers [41]. Bergasa et al. [42] proposed an attention monitoring system by detecting the level of drowsiness and distraction among drivers. The authors used the head position information to determine the level of distraction, and PERCLOS and yawning rate to measure the drowsiness level of driver. The combination of all three factors helped the system to detect the attention level of drivers efficiently. They also used RANSAC and POSIT 3D face tracking models to estimate the head movements. User-and-illumination-independent model for facial expression was used to detect different facial features. Principal Component Analysis (PCA) and Linear Discriminant Analysis (LDA) were applied to reduce the input data dimensions. PERCLOS threshold was used to decide the attention level of drivers. The proposed algorithm was evaluated over a custom recorded video dataset in simulating the environment and actual driving scenario. Cohn-Kanadae dataset [43] was used to train the facial expression classifier mode. Facial expressions were efficiently detected by the proposed algorithm for the given dataset and were not
18
significantly affected by illumination conditions: however, the authors did not report any numerical results. The face pose estimation algorithm was able to track the face with ±40& face rotation accurately. Based on the performance results of two subsystems, the authors achieved an accuracy of 92% in detecting the attention state of drivers.
Dasgupta et al. [44] proposed a driver attention monitoring system based on PERCLOS to determine the level of drivers attention. They used Kalman filtering and Haar-like features to track and detect the face captured by the camera sensor used in detection of eyes at day and night using feature techniques. The authors proposed two different methods for different lighting conditions to detect and extract the eyes from detected faces. In order to extract more effective features from the static images, Local Binary Patterns (LBP) features and the principal component analysis (PCA) approach are used. The PCA is used to reduce dimensions of the features which are combined by the gray pixel value and Local Binary Patterns (LBP) features is used as an important descriptor for the pattern analysis of image, the authors used these feature technique to get the texture information from the images. All the features are extracted from the active facial patches. The active facial patches are these face regions which undergo a major change during different lighting conditions. PERCLOS values were classified to determine the closeness and openness of eyes using the SVM classifier, and, accordingly, the attention level of drivers was determined. To compensate the face rotations during real-time driving scenarios, affine and perspective transformations were applied. Furthermore, the Bi-Histogram Equalization (BHE) approach was used to compensate for the different illumination conditions in real-time driving situations. The proposed algorithm for attention monitoring of drivers was evaluated for simulated driving conditions and actual driving conditions in both daylight and night scenarios. The scholars achieved an overall classification accuracy of 98.6% with 9.5 framers per second speed. Ji et al. [45] recommended a fatigue monitoring system for drivers in real-time situations based on IR illumination device and Charge-Coupled Device (CCD) camera. The idea of IR illumination devices was used by the authors to improve the monitoring results in low light conditions. Combination of different behavioural measures such as gaze estimation, eyelid movement, facial expressions and head pose was used to determine the driver alertness. Eyes detection was achieved by using SVM classifier while for eye tracking a
School of Engineering and Technology
19
combined approach of using Kalman filters and mean shift tracking was used. Talking more technically, PERCLOS and Average Eye Closure Speed (AECS) [46] were used as a measure to decide the driver alertness. A probabilistic model (Bayesian Networks) was established by the authors to mimic human fatigue and visual information was used to predict the current fatigue level of drivers. The proposed system was evaluated in two part by authors. In the first part, detection accuracies of individual computer vision based facial feature detection algorithms was validated while in the second part, fatigue parameters validity was evaluated. For eye detection, a huge dataset of 13620 images was used and detection accuracy of 95.8% was achieved by the researchers. For head pose, an estimated root mean square error of 1.92 degrees and 1.97 degrees was achieved for pan and tilt angles, respectively. For fatigue parameters evaluation, data from eight subjects was collected and response time was used as metric for performance. However, no numerical results were reported by the authors in this regard.
Sacco et al. [47] developed a driver alertness system in real-time by utilizing facial features of drivers. Important visual facial features such as the face, eyes and mouth from the camera input were detected using the Viola and Jones algorithm. Real-time tracking of the detected facial features was achieved by using the template matching approach. Extracted facial features were then classified using the SVM classifier. PERCLOS, average eye closure interval and degree of mouth openness were utilised in deciding the level of alertness among drivers. Viola and Jones face, eye and mouth detection algorithms were evaluated over 6,000 images dataset containing the exact half of negative and positive images. FERET dataset was used for the positive images, while negative images were captured from an in-vehicle video feed. As for the face detection, an accuracy of 99.9% was achieved, whereas as for the eye detection and mouth detection, detection accuracies of 96% and 91.9% were achieved. The overall accuracy of 93.24% and 95.20% were achieved by authors for SVM with linear kernel and SVM with Radial Basis Function (RBF) kernel, respectively.
Bergasa et al. [48] proposed a real-time non-intrusive driver vigilance monitoring system using the computer vision approach. The authors used the IR illuminated camera sensor hardware to capture the facial information of drivers. Six different vigilance related
20
parameters were calculated in the proposed research: the PERCLOS, eye closure interval duration, frequency of eye blinking, frequency of head nodding, position of face and fixed gaze directions. Computer parameters were combined into fuzzy-based classifier, and decision on the driver attentiveness was made. The suggested algorithm was evaluated over the custom collected dataset of real-driving from ten different users in both day and night lighting conditions. The authors achieved the detection accuracies of 93.12%, 84.37%, 80%, 72.5%, 87.5% and 95.2% for PERCLOS, eye closure duration, eye blinking frequency, head nosing frequency, face position and fixed gaze direction, respectively. Fan et al. [49] suggested a yawning detection system for measuring the fatigue among drivers. They used CCD camera sensor to capture the facial and mouth information of drivers. Face detection was achieved using the Gravity-Center template approach, while mouth corners were detected with the grey projection approach. Furthermore, the authors used the Gabor Wavelets approach to extract the texture related features from the mouth. Extracted yawning related features were then classified using the LDA classifier, and the decision on yawning was made. They also evaluated the proposed algorithm over 400 image sequences selected from twenty different video sequences. From the experimental results, the authors achieved an overall yawning detection accuracy of 95%.
Vural et al. [50] proposed a drowsiness detection system using machine learning on facial movements of drivers. Machine learning approach was used by the authors to determine the actual behaviours of drivers during drowsiness episodes. Machine learning classifiers were developed using 30 different facial actions from Facial Action Coding. Classifier included drowsiness-related facial actions such as eye blinking, yawning and head movements. Information of these facial actions was passed to Adaboost and multi-nomial ridge regressor to predict the sleep and crash episodes among drivers. Proposed algorithm was evaluated using a driving computer game simulation and classification accuracy of 96% and 90% was achieved by the authors for in-subject and across-subject, respectively. Yin et al. [51] proposed a novel approach for fatigue detection among drivers based on the multiscale dynamic features of facial images. Multiscale representations from input image sequences were achieved by using Gabor filtering technique. At the next stage, from each
School of Engineering and Technology
21
multiscale image, LBP were extracted. Resulted LBP of image sequences were divided into dynamic features and were concatenated with the histogram of each dynamic feature. A statistical based learning algorithm was used to select the most distinguished dynamic features and at the final stage a strong classifier was used to classify the state the drowsiness among drivers based on selected dynamic features. The proposed algorithm was evaluated over custom collected data set of 600 images coming from thirty different subjects. From the experimental results, the researchers achieved the classification accuracy of 98.33%. Flores et al. [52] proposed a computer vision and artificial intelligence based Advanced Driver Assistance System (ADAS) to automatically detect the drowsiness among drivers. They used the visual information such as face, eyes and head position to decide the drowsiness and distraction level of drivers. Viola and Jones algorithm was used to detect the face while eyes were located by defining the regions of interest in detected faces. To track the eyes and face, fusion of condensation algorithm and neural networks was applied. Finally, eye state detection was achieved by using SVM classifier. Important features of eye were extracted using the Gabor filters. Drowsiness index was determined based on the PERCLOS measurements. The proposed algorithm was evaluated over the custom collected dataset under different lighting conditions and from the diversity of drivers. From the experimental results, on average accuracy of 90% was achieved.
Liu et al. [53] proposed a drowsiness detection system based on the eyelid movements of drivers. They used the cascade classifiers for the detection of the face from input sequences and diamond search algorithm to track the face in real-time. Temporal difference image approach was used to detect the eyelid movements. To judge on the performance of the proposed system, the authors used eyelid closure duration, group of continuous blinks and eye blinking frequency as three measures. The suggested algorithm was evaluated over custom collected low resolution dataset of ten different subjects. From the experimental results, an accuracy of about 98% was achieved by the scholars.
Zhang and Zhang [54] proposed a fatigue detection system for drivers based on the non-linear Kalman filters and eye tracking. Unscented transformations were used by the authors to non-linearly track the eyes in real-time. PERCLOS was used as a measure to detect the
22
fatigue level among drivers. Face detection was achieved using the SVM based classifiers. The proposed algorithm was validated over 20 qualified drivers with different genders and different ages. From the experimental results, eye detection accuracy of over 99% was achieved by the authors.
Park and Trivedi [55] proposed a head posed detection system towards determining the attentiveness of drivers using Support Vector Regressor (SVR). They implemented the universal motion approach and colour statistical orders to monitor and track facial behaviours of drivers. The proposed method was reported to be failed if driver is rotating its head in certain direction, conversing with other in-vehicle passengers and if wearing the glasses. Proposed algorithm was evaluated over a custom recorded NTSC image dataset of subjects performing different driving related tasks. The authors did not report any extensive evaluation results in numerical rather presented the results as segmented images. Improvements in the proposed system can be made by integrating other sensors such as thermal images and steering images. Furthermore, the fusion of this approach with vision based attention monitoring approaches will enhance the overall performance.
Nguyen et al. [56] proposed a computer vision based system to monitor the real-time drowsiness among drivers using the facial features of driver. A camera sensor was used to capture the RGB visual information of driver. For face detection, Haar features based approach was applied while for eyes detection random forest approach was used. From the detected eyes, binary images of local eye regions were extracted. From the binary images, a decision on drowsiness was taken based on closeness and openness of eyes. A pre-defined threshold was used to determine if the driver is drowsy or not. Proposed algorithm was evaluated over data collected from four different subjects in normal illumination conditions. From the experimental results, the detection accuracy of 97.6% and 94% was achieved for eye detection and eye-state prediction, respectively.
Kholerdi et al. [57] proposed a human visual system-based image processing approach to detect the drowsy behaviour among drivers. Images captured by the camera were pre-processed for illumination conditions, including the noise before getting into the feature extraction stage. The luminance variation model was used for illumination variation, while
School of Engineering and Technology
23
spatio-temporal filters were applied to compensate for the noise. To detect the eyes and mouth from pre-processed images, the Viola and Jones algorithm was applied. Motion events around the eyes and mouth were captured by using energy of the Mango approach in the Region of Interest (RI). Finally, three measures – the head dropping, yawning and closed eyes –were used to define thresholds and conditions and decide the drowsiness level of drivers. The proposed system was evaluated for the custom defined dataset, and an overall classification accuracy of 90% was achieved by the authors.
Jo et al. [58] defined a term PERLOOK as a measure that detects the distraction level of drivers. A similar idea PERCLOS for drowsiness detection was used to define PERLOOK. They defined PERLOOK as the percentage of time interval which a driver is not looking straight i.e. a rotated head or eyes of the road. A certain threshold of PERLOOK was defined for active driving. If the detected PERLOOK value of drivers was greater than the defined threshold, the driver was classified as visually distracted. They used the yawning information to determine PERLOOK, and the eye blinking information to determine PERCLOS values of drivers. Then, they decided on the drowsiness and distraction level based on these values. PCA and LDA approaches were used to extract the features. Nabo
[59] used a software toll, SmartEye [60], to determine the value of PERLOOK from camera input towards detecting the distraction. Extracted features were then classified using the SVM with BF kernel to determine the attention level of drivers. To evaluate the proposed system, a dataset of 162,772 images from 22 different subjects was collected. The proposed system was evaluated for eye detection, eye state detection and inattention classification. The authors achieved the detection accuracy of 98.58%, 98.55% and 97.09% for eye detection, open eye state detection and closed eye state detection, respectively. For attention level measurements, 0% error was achieved for recognizing inattentive state as the normal state, while
![Figure 2.2: Block Diagram of Stress Detection System Proposed by Gao et al. [34].](https://thumb-us.123doks.com/thumbv2/123dok_us/784812.2599235/29.918.207.771.442.657/figure-block-diagram-stress-detection-proposed-gao-et.webp)

![Figure 3.5: Principle of PERCLOS Computation Proposed by the Weijie et al. [107].](https://thumb-us.123doks.com/thumbv2/123dok_us/784812.2599235/79.918.272.695.579.827/figure-principle-perclos-computation-proposed-weijie-et-al.webp)
![Figure 3.6: The Ratio of the eye-Height and Eye-Width Proposed by Weijie et al. [107]](https://thumb-us.123doks.com/thumbv2/123dok_us/784812.2599235/80.918.307.678.507.829/figure-ratio-eye-height-eye-width-proposed-weijie.webp)
![Figure 3.8: General Block Diagram and Respective Output for Mouth Detection [100].](https://thumb-us.123doks.com/thumbv2/123dok_us/784812.2599235/82.918.214.794.656.923/figure-general-block-diagram-respective-output-mouth-detection.webp)