Australia
Department of Econometrics
and Business Statistics
http://www.buseco.monash.edu.au/depts/ebs/pubs/wpapers/
Forecasting age-specific breast cancer mortality using
functional data models
Bircan Erbas, Rob J. Hyndman and Dorota M Gertig
February 2005
mortality using functional data models
Short title Authors
Forecastingmortality frombreastcancer BircanErbas
Departmentof Public Health,
TheUniversity ofMelbourne, VIC3053, Australia.
RobJHyndman
Departmentof EconometricsandBusiness Statistics, MonashUniversity,VIC 3800,Australia.
DorotaM Gertig
Centrefor GeneticEpidemiology,
TheUniversity ofMelbourne, VIC3053, Australia.
Corresponding author: BircanErbas
Departmentof Public Health, TheUniversity ofMelbourne,
Level2,723SwanstonStreet,Carlton,Victoria3053,Australia. Email: [email protected].
Telephone: +613 83440635. Fax: +613 93495815.
Abstract
Accurate estimates of future age-specific incidence and mortality are critical for allocation of resources to breast cancer control programs and evaluation of screening programs. The purpose of this study is to apply functional data analysis techniques to model age-specific breast cancer mortality time trends, and forecast entire age-specific mortality function using a state-space approach.
We use yearly unadjusted breast cancer mortality rates in Australia, from 1921 to 2001 in 5 year age groups (45 to 85+). We use functional data analysis techniques where mor tality and incidence are modeled as curves with age as a functional covariate varying by time. Data is smoothed using nonparametric smoothing methods then decomposed (using principal components analysis) to estimate basis functions that represent the func tional curve. Period effects from the fitted functions are forecast then multiplied by the basis functions, resulting in a forecast mortality curve with prediction intervals. To fore cast, we adopt a state-space approach and an extension of the Pegels modeling frame work for selecting among exponential smoothing methods.
Overall, breast cancer mortality rates in Australia remained relatively stable from 1960 to the late 1990’s but declined over the last few years. A set of K=4 basis functions min imized the mean integrated squared forecasting error (MISFE) and accounts for 99.3% of variation around the mean mortality curve. 20 year forecast suggest a continual decline at a slower rate and stabilize beyond 2010 and by age, forecasts show a decline in all age groups with the greatest decline in older women.
We illustrate the utility of a new modelling and forecasting approach to model breast cancer mortality rates using a functional model of age. The methods have the potential to incorporate important covariates such as Hormone Replacement Therapy (HRT) and interventions to represent mammographic screening. This would be particularly useful for evaluating the impact of screening on mortality and incidence from breast cancer. Keywords: mortality, breast cancer, forecasting, functional data analysis, exponential smoothing
Introduction
Despite an increase in utilization of mammographic screening as a form of early detec tion, and continual improvements in treatment options, breast cancer remains one of the main causes of mortality and morbidity in women. Regular and accurate estimates of fu ture age-specific incidence and mortality are necessary in making recommendations for the allocation of resources to state, regional and private health care, community-based prevention services and breast cancer control programs.
At present, most forecasting relies on age-period-cohort methods to estimate mortality (and incidence) from breast cancer [1, 2, 3], prostate cancer [4, 1] and cervical cancer [5, 6]. These models are based on regressions with the outcome defined as mortality or incident cases, and modelled using a Poisson error distribution and a log link function for the mean. The mean is modelled using the sum of parameters for age, period ef fects (variations in time which may apply to the whole population) and cohort effects (variations due to specific birth cohorts). The fitted models are then used to make linear projections of mortality and incidence. Common problems associated with age-period cohort models for estimating future cancer rates include issues with non-identifiability of the parameters, strong parametric assumptions, and sensitivity of the projections to most recent changes in cohort effects.
Little other progress has been made in developing statistical methodology for cancer pro jections, with studies concentrating on variations of age-period-cohort statistical meth ods. Dyba et al. [7] and Dyba and Hakulinen [8] proposed linear extrapolation and non-linear Poisson distributed models. Each proposal considered a number of different scenarios with known and linearly extrapolated values for period effects and age-specific rates. Bashir and Esteve [3] used a Bayesian age-period-cohort model with autoregress ive smoothing of each of the age, period and cohort components so that the resulting projections are estimated from current and past smoothed trends of the data.
method was recently developed for demographic forecasting [9] and has not previously been applied to cancer projections. The approach uses functional data analysis tech niques, and treats the age-specific mortality curves as the units of analysis rather than the discrete observations. In recent years, functional data analysis has received much at tention, particularly in medicine. Ramsay and Silverman [10] provide a comprehensive introduction and have stimulated much additional development of these methods. The Hyndman-Ullah [9] approach is a generalization of the method of Lee and Carter [11], and has the following advantages: a) mortality (or incidence) rates are modelled as continuous functions of age so that subtle patterns of variation between years are cap tured; b) data are smoothed prior to estimating the basis functions, thus reducing obser vational error; c) the approach forecasts the entire function for future time periods with prediction intervals; d) the method is robust to outlying years; and e) the flexibility of the approach allows the incorporation of important covariates such as screening and treat ment effects into the modelling. The purpose of this study is to demonstrate the utility of this new modelling and forecasting method for estimating future age-specific trends in breast cancer mortality, using unadjusted age-specific data for Australia from 1921 to 2001.
Methods
DataIn this study we obtained data on mortality from breast cancer in Australian women from the Australian Institute of Health and Welfare (AIHW), an organization that provides de identified health and welfare data to national and regional government and community organizations. National mortality data are compiled from medical certificates outlining cause of death from the Registrar of Births, Deaths and Marriages located in each state and territory. Additional diagnostic information is also available from the state- and territory-based cancer registries.
At present, breast cancer mortality represents 16% of all cancer deaths in Australian wo men [12]; 12% of deaths from breast cancer occur in women aged 40 to 49 years, 38.3% in women aged 50 to 69 years (the target age group for screening) and 46.2% in women over 70 years of age.
We use crude (unadjusted) age-specific mortality rates, defined as the number of deaths in a particular age group during the year divided by the corresponding population in that age group at 30 June of the same year. The rate is expressed per 100,000 people. Yearly age-specific breast cancer mortality rates were available for the period 1921 to 2001 and in 5 year age groups (45–49, 50–54, 55–59, 60–64, 65–69, 70–74, 75–79, 80–84, 85+).
Functional data analysis
With functional data methods, data can be smooth curves or functions. In the case of age-specific mortality, mortality rates are treated as smooth functions of age.
Letyt(x)denote the log mortality rate for age x and year t, t = 1, . . . , n. We assume there
is an underlying smooth function ft(x)that we are observing with error. Thus,
yt(xi) =ft(xi) +σt(xi)εt,i, (1)
where xi is the centre of age-group i (i = 1, . . . , p),εt,i is an independent and identically distributed standard normal random variable and σt(xi)allows the amount of noise to vary with age x.
Various smoothing techniques are available to estimate the function from the discrete observations. We smooth the data using local quadratic smoothing with the smoothing parameter (the “bandwidth”) selected using cross-validation [13]
�
�
After constructing the functional observations, we fit the model
K
ft(x) =µ(x) + βt,kφk(x) +et(x) (2)
k=1
where µ(x)is the mean log mortality rate across years, φk(x)is a set of orthogonal basis
functions, and et(x)is the model error.
We wish to estimate the optimal set of K orthogonal basis functions. Specifically, for a givenK, we want to find the basis functions {φk(x)}which minimize the mean integrated
squared error: 1 n � 2 MISE = et(x)dx . (3) n t=1
This is achieved using functional principal components decomposition [14] which gives the least number of basis functions, enables more informative interpretations and gives coefficients which are uncorrelated with each other.
Hyndman and Ullah [9] proposed a robust method to estimate µ(x) and a robust ap proach to obtaining principal components when computing the basis functions. How ever, our data do not exhibit any outliers or other unusual behaviour, and so we use the mean and standard (functional) principal component decomposition.
To assess the overall goodness of fit, the residuals of the fitted mortality model are dis played using image plots.
Forecasting framework
We estimate future values of mortality yt(xi)by forecasting the entire function ft(x)for
t =n + 1, . . . , n +hand x1 < x < xp. The coefficients of the fitted function, βt,1, . . . , βt,K,
are forecast using time series models. The forecast coefficients are then multiplied by the basis functions, resulting in forecasts of mortality curves. Hyndman and Ullah [9] show how to obtain prediction intervals for the forecast curves.
�
� ahead forecast of fn+h(x). Then
K
fˆn,h(x) =µˆ(x) + βˆn,k,hφˆk(x). (4)
k=1
To forecast the coefficients in equation (4), a variety of time series forecasting methods are available. In this study we use state space models for exponential smoothing [15]. Forecasts from exponential smoothing methods are estimated recursively where recent observations are given more weight than historical data. The methods accommodate ad ditive and multiplicative trend and seasonal components of the time series. Makridakis, Wheelwright and Hyndman [16] present a modelling framework based on the taxonomy proposed by Pegels [17]. The framework is expanded in Hyndman et al. [15], who also provide state space models for each method, and show how models can be automatically selected for a given time series.
We evaluate the accuracy of the mortality forecasts by computing the Mean Integrated Squared Forecasting Error (MISFE) defined as
� �2
1 n �
MISFE(h) = yt+h(x)−fˆt,h(x) dx . (5) n −m + 1t=m
where m is the minimum number of observations used in fitting a model. In our imple mentation, we set m =10.
All analyses were performed using the R implementation of the S language [18].
Results
DescriptivesFigure 1 displays mortality from breast cancer in Australian women by age group for period 1921 to 2001. Breast cancer mortality rates remained relatively stable for women 45–49 years of age. For older women, there was an increase in mortality between 1921 and 1940, followed by a decline until 1960 for women aged 55 and 80. All age groups had relatively stable mortality rates from 1960 to the late 1990s, and all show a decline in mortality over the last few years. The greatest rate of decline has been in women 65 years and over. In general, mortality increases with age, and in each year, maximum mortality occurred in women over 85 years.
INSERTFIGURE2ABOUTHERE
Crude log mortality rates by age for 1941, 1961, 1981 and 2001 are displayed in Figure 2. We smooth the log mortality series by age using loess (locally quadratic) regression with the bandwidth chosen via cross-validation. The fitted smooth curves are overlaid on the observed discrete log mortality rates. Similar trends in the age-mortality relation were observed in each year. Although mortality rates increase with age, the rate of increase varies across age groups. In most years, there is a slight deceleration in the rate of increase for women 60 to 70 years of age, and a rapid acceleration thereafter.
Functional data analysis
INSERTFIGURE3ABOUTHERE
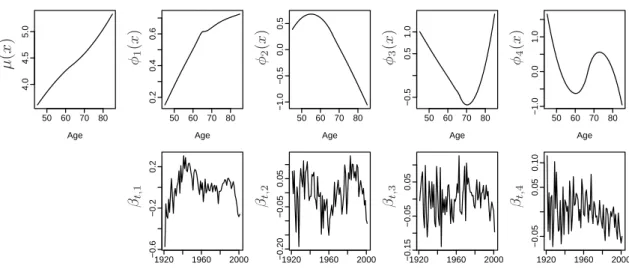
Using functional data analysis techniques and principal component decomposition to es timate the basis functions, a model with K = 4basis functions was selected. A set of
K = 4basis function minimized the MISFE, while estimating an additional basis func tion did not contribute to a further reduction in the MISFE. The estimated basis functions and corresponding coefficients β1, . . . , β4 are shown in Figure 3. Fitting a functional
re-gression model with K = 4basis functions accounts for 99.3% of the variation around the mean mortality curve. The proportion of variation explained by each basis function is 69.3%, 15.8%, 9.1% and 5.0% for k = 1, . . . , 4respectively.
The first basis function corresponds to the overall trend in the mortality curve. The second describes variation in mortality in lower age groups, capturing the rate of in crease in women approximately 50 to 60 years of age relative to older women. The third contrasts mortality rates in women around 70 with those much younger and those much older. The fourth component is complex and contrasts those under 55 or between 65 and 80, with the other ages.
Forecasting horizon 20 years
INSERTFIGURE4ABOUTHERE
We computed 20 year estimates of future age-specific breast cancer mortality using state space exponential smoothing models as described by Hyndman et al. (2002). The auto matic model-selection algorithm chose models with additive errors and a damped trend. The model parameters were selected by minimization of the one-step MSE.
Forecasts of βt,1 are shown in Figure 4 for 2002 to 2021, along with 80% prediction inter vals. This parameter controls the overall change in trend in breast cancer mortality. In Australian women, mortality from breast cancer is expected to continue to decline at a slower rate than that suggested by observed mortality trends during the late 1990s, and expected to level off and stabilize beyond 2010. Note that the wide prediction intervals provide a measure of the uncertainty in the future movements in this coefficient, and even allow for it to increase.
One-year and ten-year Age-specific breast cancer log mortality forecasts are shown in Figure 5, along with 80% prediction intervals. Very little difference in the overall shape of the age-mortality trends is likely to occur over the forecast horizon. In all age groups, the forecasts show a decline in breast cancer mortality, with the greatest declines in the oldest age groups.
Discussion
At present, statistical methods for mortality projections assume current age-adjusted breast cancer mortality trends will continue into the future, thereby projecting a con tinual rate of decline in breast cancer mortality in countries such as the United States, the United Kingdom, Canada, New Zealand and Australia.
In this study of breast cancer mortality in Australian women, we illustrate the utility of a new forecasting method that models mortality using a functional model of age. The model uses basis expansions which highlight important trends in the mortality-age rela tionship for the period of the study. Future mortality rates are then estimated using all available historical data rather than only the most recent observations.
Using our approach, the forecast horizon suggests a slower rate of decline in breast cancer mortality in Australian women within the next decade, stabilizing beyond 2010. Our data suggest relatively small changes in mortality for women 50 to 60 years of age who are at the lower end of the target age group for screening, assuming current screening and treatments are unchanged.
In Australia, crude mortality rates have increased during 1920–1940, decreased post war, remained relatively stable during 1960–1980, followed by a steady decline since the mid 1990s. However, when crude mortality rates are age-standardized to the world popula tion, Australian mortality trends follow a similar pattern to other Western countries such as the United States, the United Kingdom, Canada and New Zealand [19, 20]. In these
countries, mortality rates have shown very little variation beyond 1950 except for the more recent steady decline which began in the 1990s.
The reduction in mortality over the last decade is most likely a result of improvements in treatment regimes such as increased utilization of adjuvant therapy and increased mam mographic screening. In the United States substantial improvements in survival among postmenopausal women were observed following new treatment regimes in addition to tamoxifen [21]. The United Kingdom has adopted tamoxifen treatments in nearly all wo men over 50 years of age in the early 1990s [22]. Australia has seen similar improvements in adjuvant chemotherapy and hormonal therapy treatment regimes [23] and in 1995 new management guidelines for breast cancer treatment were widely adopted [24].
The more recent reduction in breast cancer mortality rates may in part be explained by the delayed mortality benefit of mammographic screening.
Although the interpretation of randomized control trials of mammographic screening is still subject to some controversy [25], the evidence suggests an approximately 30% reduction in mortality in screened populations due to early detection of tumours. In many countries, participation in mammographic screening has gradually increased since its introduction in the late 1980s and early 1990s. In Australia, 57% of women in the target age group for screening (50 to 69 years) were screened within a national BreastScreen program in 2001–2002 [12]. Participation rates are much higher in the United States with 78.6% of women between 50–64 years of age reported as having a mammogram in the previous two years [26].
Blanks et al. [2] predicted mortality from breast cancer for England and Wales using the widely used age-period-cohort approach. They provide mortality predictions separately for different age groups in the presence and absence of screening for the period 1990– 1999. Although they do not extrapolate beyond 1999, their findings suggest a constant decline in overall mortality, with a slight decline and then levelling off in women 50 to 65 years of age and an increase in women over 70 years of age.
Verdecchia et al. [27] adopt an alternative survival regression type approach to project breast cancer mortality, incidence and prevalence for the period 1993–2030 by 5-year age groups for women in Connecticut. They report a decrease in projected age-adjusted mor tality prior to 2003 and then a levelling off with very little variation beyond 2003. Mortal ity projections by age suggest a decrease in women 50 to 69 years of age and a continual increase in women over 70 years of age from 1990, 2000, to 2030. Our forecasts of over all mortality are similar to the findings of Verdecchia et al. [27], although we forecast a delay in the leveling off of mortality beyond 2010 and not earlier as they suggest. Our data comprise much longer periods of mortality (1921–2001) and show mortality rates decreasing most rapidly between 1990 and 2001. Our forecasts incorporate these trends. In this study we adopt a methodological approach which models age as a functional covariate rather than a fixed variable, so that the age-shape of mortality varies over time, thereby enabling the models and forecasts to pick up subtle variations. Other studies in demography have also realized the implications of this phenomenon when modeling all-cause mortality, particularly the acceleration in the rate of mortality decline in older persons [28, 29].
Functional data analysis is an effective exploratory and modelling technique for high lighting trends and variations in the shape of the age-mortality relationship over time. This analytical approach has a number of strengths. First, in contrast to the common age period-cohort models used to model trends in mortality, functional data analysis tech niques make no parametric assumptions about age or period effects. The shape of the mortality-age curve varies with time, so that at different ages, mortality declines at differ ent rates. This phenomenon is particularly apparent in breast cancer mortality, possibly due to hormonal effects or screening of women in target age groups. To our knowledge, no other study has modelled or forecast from a model with age as a functional covariate of breast cancer mortality over time.
Second, using a functional approach to forecast age-specific mortality models the entire age function and allows the possibility of a damped trend component, thereby
provid-ing greater accuracy when forecastprovid-ing age-specific mortality for future time periods. The damped trend is particularly useful for forecasting breast cancer mortality because in re cent years mortality from breast cancer has continued to decrease. Rather than assuming a continual decline into the future, the damping factor decelerates the trend component for the forecast horizon. In other forecasting applications [30], a damped trend model has proved particularly accurate for forecasting.
Functional data analysis methods can be further developed to incorporate interventions such as screening effects and covariates for hormone replacement therapy use. In addi tion, the shape of the age-mortality relation can be allowed to vary for different types of cancers and would be particularly useful for forecasting incidence of breast cancer. A potential limitation of this approach is the assumption that there are only period effects and no cohort effects. Examination of the residuals from the functional fit revealed very little birth cohort effects in breast cancer mortality in Australia. Furthermore, studies of breast cancer mortality in different countries using age-cohort mortality models also support our finding of constant cohort mortality ratios from breast cancer in Australian women [19]. However, birth cohort effects are an important component of modelling mortality trends and studies have shown strong birth cohort effects in mortality trends for the United Kingdom, Canada, the United States and Scotland [19, 31, 32].
Often birth cohort effects influence mortality trends in younger and older age groups [33]. Our modelling approach smooths the data prior to fitting the functional regression model, resulting in a smoothed functional age-mortality relation. The smoothing process may reduce much of the variation attributable to outlying observations at younger and older age groups where we expect birth-cohort trends to have the greatest effect. Any remaining birth-cohort trend is saturated in patterns of variation over time. This is not necessarily a problem as it does not hinder the functional age-mortality association over time, which is the focus of these studies. In future work, we intend to extend our model to allow for cohort effects.
approach to forecast age-specific mortality from breast cancer. Our estimates suggest mortality from breast cancer will continue to decline and then stabilize beyond 2010 with the greatest decline in oldest age groups. These models also have broader application to other cancers and chronic diseases.
Acknowledgements
This study was funded by a Annie S Glover Cancer Research Fellowship from The Fac ulty of Medicine, Dentistry and Health Sciences, The University of Melbourne.
References
1 HRISTOVA L, DIMOVA I, and ILTCHEVA M. Projected cancer incidence rates in Bul garia, 1968-2017,International Journal of Epidemiology 1997;26: 469–475.
2 BLANKS RG, MOSS SM, MCGAHAN CE, QUINN MJ, and BABB PJ.. Effect of NHS breast screening programme on mortality from breast cancer in England and Wales, 1990-8: comparison of observed with predicted mortality., British Medical Journal 2000; 321: 665–669.
3 BASHIR SA, and ESTEVE J. Projecting cancer incidence and mortality using Bayesian age-period-cohort models, Journal of Epidemiology and Biostatistics 2001; 6: 287–296.
4 NEGRI E, LAVECCHIA C, LEVI F, RANDRIAMIHARISOA A, DECARLI A, and BOYLE P. The application of age, period and cohort models to predict Swiss cancer mortal ity,Journal Cancer Research, Clinical Oncology1990; 116: 207–214.
5 COX B, and SKEGG DC. Projections of cervical cancer mortality and incidence in New Zealand: the possible impact of screening, Journal of Epidemiology and Com munity Health 1992;46: 373–377.
6 TAYLOR RJ, MORRELL SL, MAMOON HA, and WAIN GV. Effects of screening on cervical cancer incidence and mortality in New South Wales implied by influences of period of diagnosis and birth cohort, Journal of Epidemiology and Community Health 2001; 55: 782–788.
7 DYBA T, HAKULINEN, and PAIVARINTA L. A simple non–linear model in incidence prediction,Statistics in Medicine1997; 16: 2297–2309.
8 DYBA T, and HAKULINEN T. Comparison of different approaches to incidence pre diction based on simple interpolation techniques, Statistics in Medicine 2000; 19: 1741–1752.
9 HYNDMAN RJ, and ULLAH S. Robust forecasting of mortality and fertility rates: a functional data approach, Department of Econometrics and Business Statistics working paper, 2005.
10 RAMSAY RO, and SILVERMAN BW. Functional Data Analysis, Springer–Verlag: New York Inc, 1997.
11 LEE RD, and CARTER L. Modelling and forecasting the time series of U.S. mortality, Journal of the American Statistical Association 1992; 87: 659–671.
12 AUSTRALIAN INSTITUTE OF HEALTH AND WELFARE. Cancer in Australia, Series 28, www.aihw.gov.au, 2001.
13 BOWMAN AW, and AZZALINI A. Applied smoothing techniques for data analysis: the kernel approach with S-Plus illustrations, Oxford University Press: Oxford UK, 1997.
14 RAMSAY RO, and DALZELL CJ. Some tools for functional data analysis with dis cussions, Journal of the Royal Statistical Society Series B 1991; 53: 539–572.
15 HYNDMAN RJ, KOEHLER AB, SNYDER RD, and GROSE S. A state space frame work for automatic forecasting using exponential smoothing methods, International Journal of Forecasting 2002;18: 439–454.
16 MAKRIDAKIS S, WHEELWRIGHT SC, and HYNDMAN RJ. Forecasting: methods and applications, 3rd ed., New York: Wiley and Sons, 1998.
17 PEGELS CC. Exponential Forecasting: some new variations, Management Science 1969; 12: 311–315.
18 R DEVELOPMENT CORE TEAM. R: A language and environment for statistical com puting. R Foundation for Statistical Computing, Vienna, Austria, http://www.R project.org, 2004.
19 HERMON C and BERAL V. Breast cancer mortality rates are levelling off or begin ning to decline in many western countries: analysis of time trends, age-cohort and age-period models of breast cancer mortality in 20 countries, British Journal of Cancer 1996; 73: 955–960.
20 METTLIN C. Global Breast Cancer Mortality Statistics, CA Cancer J Clin 1999; 49: 138–144.
21 STEWART SL, KING JB, THOMPSON TD, FRIEDMAN C, and WINGO PA. Can cer mortality surveillance–United States, 1990-2000, MMWR Surveillance Summaries 2004; 53: 1–108.
22 QUINN M, and ALLEN E. Changes in incidence of and mortality from breast cancer in England and Wales since introduction of screening, British Medical Journal 1995; 311: 1391–1395.
23 SMITH CL, KRICKER A, and ARMSTRONG BK. Breast cancer mortality trends in Australia: 1921 to 1994, Medical Journal of Australia 1998; 168: 11–14.
24 NATIONAL HEALTH AND MEDICAL RESEARCH COUNCIL. Clinical practice guidelines for the management of early breast cancer, Australian Government Publish ing Service, Canberra, Australia, 1995, p.191.
25 OLSEN O, and GOTZSCHE PC. Cochrane review on screening for breast cancer with mammography, Lancet2001; 358: 1340–2.
26 SWAN J, BREEN N, COATES RJ, RIMER BK, and LEE NC. Progress in cancer screen ing practices in the United States, Cancer2003;97: 1528–1540.
of cancer prevalence from cancer registry data, Statistics in Medicine2002; 21: 3511– 3526.
28 HORIUCHI S, and WILMOTH JR. The aging of mortality decline, Annual Meetings of the Population Association of America, April 6, San Francisco, 1995.
29 LEE RD, and MILLER T. Evaluating the performance of the Lee-Carter method for forecasting mortality, Demography 2001; 38: 537-549.
30 MAKRIDAKIS S, and HIBON M. The M3-competition: results, conclusions and im plications,International Journal of Forecasting 2000; 16: 451–476.
31 TARONE RE, CHU KC, and GAUDETTE LA. Birth cohort and calendar period trends in breast cancer Mortality in the United States and Canada, Journal of the National Cancer Institute1997; 89: 251–256.
32 SWERDLOW AJ, DOS SANTOS SILVA I, REID A, QIAO Z, BREWSTER DH, and AR -RUNDALE J. Trends in cancer incidence and mortality in Scotland: description and possible explanations,British Journal of Cancer 1998;77: 1–16.
33 TARONE RE, and CHU KC. Implications of birth cohort patterns in interpreting trends in breast cancer rates, Journal of National Cancer Institute 1992; 84: 1402–1410.
Australia: Breast cancer death rates (1921−2001) Deaths 1920 1940 1960 1980 2000 50 100 150 200 250 300 45−49 50−54 55−59 60−64 65−69 70−74 75−79 80−84 85+ Year
Australia: Breast cancer death rates
Log death rate
3.5 4.0 4.5 5.0 5.5 50 60 70 80 Age 1941 1961 1981 2001
Figure2: Four years of log mortality from breast cancer by age group in Australia. Loess (locally quadratic) smooth curves are also shown.
50 60 70 80 4.0 4.5 5.0 µ ( x ) 50 60 70 80 50 60 70 80 50 60 70 80 50 60 70 80 −0.05 0.05 −1.0 −0.5 0.0 0.5 β t, 1 φ1 ( x ) −0.2 0.2 0.2 0.4 0.6 β t, 2 φ2 ( x ) β t, 3 φ3 ( x ) −0.05 0.05 −0.5 0.5 1.0 β t, 4 φ4 ( x ) −0.05 0.05 0.10 −1.0 0.0 1.0
Age Age Age Age Age
1920 −0.6 1960 2000 1920 −0.20 1960 2000 1920 −0.15 1960 2000 1920 1960 2000
Time Time Time Time
Figure 3: The components from the functional model for breast cancer mortality in Australia. Top line: the mean function and first four basis functions. Bottom line: the coefficients associated with each of the basis functions.
Forecasts from Damped Holt’s method
0.6 −0.4 −0.2 0.0 0.2 0.4 β t, 1 1920 1940 1960 1980 2000 2020 YearFigure 4: Twenty year forecasts of the first coefficient using a Holt’s damped trend model. The shaded region gives 80% prediction intervals.
50 60 70 80
50
100
150
Australia: Breast cancer mortality rates (2002 and 2011)
Death rate
2002 2011
Age
Figure5: Forecast age-specific breast cancer mortality in Australia for 2002 and 2011, with 80% prediction intervals. Actual values for 2001 are shown as circles. The forecasts show decreasing mortality for all ages, with the greatest decreases for the oldest women.