Prioritizing Missing Pedestrian Infrastructure
Abstract
Using 2014 data of Indianapolis' existing pedestrian network (i.e., sidewalks and multi-use trails), the missing pedestrian network is mapped along primary and secondary arterial roads and collector streets hosting major bus routes. Each segment within the missing pedestrian network is then ranked according to its proximity to areas of with differing population density and social indicators (i.e., net social index concentrations). For example, segments shown in red touch areas containing high net population density, high scores for social indicators representing potential pedestrian infrastructure need (i.e., income, minority status, education, linguistic
isolation, and age), and are close to potentially walkable destinations.
View interactive map: http://drjill.net/indys-most-needed-pedestrian-walkways/
The Study
Walkable cities contribute to people's overall health, safety, and quality of life. This study prioritizes missing pedestrian walkways to help identify where investment should be focused in Indianapolis.
Although it has some very walkable areas of town, overall Indy ranks low in nationwide surveys of walkability (walkscore.com). Recent efforts are underway in Indianapolis to enhance
walkability, as demonstrated by its recently adopted Complete Streets Ordinance and the Health By Design et.al. Indy WalkWays initiative. A large land area and limited budget require the City find tools and strategies to efficiently and effectively develop and maintain its infrastructure. This includes finding ways to prioritize the types of pedestrian infrastructure needed to enhance walkability, and the location of that infrastructure.
The map shows the results from a study of Indy's missing pedestrian infrastructure (i.e., sidewalks and multi-use paths). It reveals the gaps in pedestrian walkways and prioritizes them based on proximity to destinations, population density, and demographic factors that may contribute to an area's particular transit needs.
Three basic assumptions are followed:
1. You don't have walkability without destinations.
2. Walkways should go where people are (i.e., population density).
3. Certain social factors, such as age, income and education, may limit people's
transportation options thus making walkways a higher need (and that need should be a factor in prioritizing pedestrian infrastructure).
About the Map
The map shows missing pedestrian walkways. The walkway segments are color coded from low to high priority based on their proximity to available destinations, population density, and social indicators.
Using 2014 data of Indianapolis' existing pedestrian network* as a reference (i.e., sidewalks and multi-use trails), missing walkway segments are mapped along primary and secondary arterial roads and collector streets that host major bus routes. The resulting map represent the gaps in the existing pedestrian network along the city's main road corridors. Each missing walkway segment is then scored based its proximity to population density and social indicators (i.e., net social index concentrations). For example, segments shown in red (high priority) touch areas containing both high net population density and high scores for social indicators representing potential pedestrian infrastructure need, such as income, minority status, education, linguistic isolation, and age (2010 Census; 2013 ACS).
Additionally, missing walkway segments received scores for their proximity to 5- or 10-minute walk radius around destinations. Destinations include public libraries, college campuses, primary schools, secondary schools, vocational schools, museums, supermarkets, recreation facilities, greenways, parks, future Red Line bus rapid transit (BRT) stops, and city bus stops. The scores for each segment are tallied and the results are used to rank the missing
walkway segments from low to high in terms of their priority for future development.
For Further Study
This study shows one way that pedestrian infrastructure gaps can be prioritized for future investment, which is just one aspect of pedestrian infrastructure planning and management. Further areas of interest include: Where are crosswalks and what is their importance in the pedestrian network? What is the role of speed limit control in designing the pedestrian network? What additional prioritization should be considered for Safe Routes to Schools initiatives? How do accident reports factor into identifying priorities? Should we rate short segments of missing walkways higher where pedestrian infrastructure otherwise exists (e.g., prioritizing small gaps)? Where are we investing today versus where priorities have been identified? How do we balance the maintenance of existing infrastructure with the development of new pedestrian infrastructure?
* Special thanks to Kevin Kastner for providing the pedestrian network GIS data used in this study.
Data and Methodology
Mapping Missing Pedestrian Infrastructure
4
Identifying Destinations
5
Net Population Density
8
Net Social Index Concentration
10
Ranking Indy’s Most Needed Walkways (RESULTS)
13
Mapping Missing Pedestrian Infrastructure
The first step to Identify Indy’s most needed walkways is to map where the pedestrian infrastructure is missing.
“Missing Walkways” are shown as lines on the map where there are gaps in the existing pedestrian network. These are mapped along primary and secondary arterial roads, and collector streets hosting major bus routes.
For the purposes of this research, pedestrian infrastructure is defined as sidewalks and multi-use paths. Missing Pedestrian Infrastructure is a new GIS data set created for the purpose of this study. For simplicity, we refer to these as “missing walkways.”
Indianapolis maintains a comprehensive GIS dataset of existing pedestrian network (i.e., sidewalks and multi-use trails). Based on those data, the following steps were followed to produce a new dataset of Indianapolis’ missing walkways:
1. The 2014 data of Indianapolis' existing pedestrian network is displayed on the map. Primary and secondary arterial roads are displayed. Bus stops are displayed (bus stops are used to identify collector streets that host major bus routes).
2. Missing walkways are mapped by adding line segments along primary and secondary arterial roads, and collector streets hosting major bus routes, where there is no coverage from the existing pedestrian network.
3. Segments of missing walkways are typically drawn from road intersection to intersection, though longer segments may be broken at Census block group boundaries.
4. Each line segment is drawn so it touches its left and right adjacent Census block group. This enables further analysis of missing walkways segment location relative to Census data. Limitations:
The new data set does not distinguish places where sidewalks may exist along only one side of a road, or where existing sidewalks may switch back and forth between different side of the road, nor the quality of existing sidewalks. It also does not evaluate the existence of crosswalks (another essential component to the pedestrian infrastructure). Sidewalks within neighborhood subdivisions and along minor collector streets are not considered by this study.
DATA SOURCES
Indianapolis 2014 Pedestrian Infrastructure - data provided by Kevin Kastner.
Indianapolis Street Centerlines - GIS data obtained from Indianapolis Open Data http:// imaps.indy.gov/arcgis/rest/services/OpenData/FeatureServer/2 (updated Oct 2015).
2010 Census Block Groups - GIS data obtained for Indianapolis, Marion County, Indiana from US Census Bureau
Identifying Destinations
The first assumption followed by the study is you don't have walkability without destinations. “Destinations” are identified by 5- or 10-minute walk radius’ around bus stops, public libraries, elementary schools, middle schools, high schools, and vocational schools, higher education campuses, future bus rapid transit (BRT), groceries, greenways and parks.
Proximity to destinations is an important factor of walkability. The study maps the location of selected destinations (based in part on data availability). Each destination type is then assigned a walk radius buffer, as follows:
Where .25 mi (1320 ft) is approximately a 5 minute walk radius, and .5 mi (2640 ft) is approximately a 10 minute walk radius.
For each destination type, missing walkways segments are assigned a score of “1” if it
intersects at least one walk radius buffer. The scores are then tallied for each missing walkways segment.
Destination Walk Radius Score
bus stop 5 minute 1
public library 10 minute 1
elementary school 5 minute 1
middle school, high school, and vocational school
10 minute 1
higher education campus 10 minute 1
bus rapid transit (BRT) 10 minute 1
grocery 5 minute 1
greenway 10 minute 1
park 5 minute 1
For example, this section of missing walkways (Figure 1) along Westfield Blvd on the north side of Indianapolis scores high because it intersects with the walk radius of many destinations, such as schools, groceries, bus stops and greenways. (It also scores high due to its net social index concentration, which is described later.)
Limitations:
A potential limitation of this method is that longer Missing Walkways line segments may touch a destination walk radius, thus assigned a score, even though a large portion of the segment may not actually be within the walk radius. This limitation is mitigated by breaking Missing Walkways into smaller segments, particularly in more densely populated areas.
Areas with multiple destinations of the same type may be under-represented. As mentioned, for each destination type, missing walkway segments are assigned a score of “1” if it intersects at least one walk radius buffer. Therefore, if a segment intersects multiple walk-radius of the same destination type, for example 3 groceries, it still scores only a “1”. This is purposeful to prevent closely spaced destinations like bus stops from being over represented. It is mitigated to some extent by counting primary, secondary, and higher education schools as separate categories. As the perceived value of different destination types is very subjective, no destination type scored higher than another.
(See Appendix C - Mapping in qGIS)
DATA SOURCES
Marion County Libraries (subset IGS, 2007), IndianaMap. Marion County Museums (subset IGS, 2007), IndianaMap.
Marion County Recreation Facilities (subset IDNR, 2009), IndianaMap. Marion County Recreation Trails (subset IDNR, 2015), IndianaMap. Marion County Schools (subset schools IDOE (Polis) 2010) IndianaMap.
Marion County Schools - public and non-public school classification of primary (up to grade 6), secondary (grades 7-12) and vocational schools (IDOE 2015)
Marion County Schools Higher Education (subset schools Higher Ed 2007) IndianaMap. Indianapolis Parcels - http://imaps.indy.gov/arcgis/rest/services/OpenData/FeatureServer/4 Indianapolis Open Data.
Indianapolis Greenways - http://imaps.indy.gov/arcgis/rest/services/OpenData/FeatureServer/7 Indianapolis Open Data.
Indianapolis Buildings - http://imaps.indy.gov/arcgis/rest/services/OpenData/FeatureServer/9 Indianapolis Open Data.
Indianapolis Parks - http://imaps.indy.gov/arcgis/rest/services/OpenData/FeatureServer/6 Indianapolis Open Data.
Current Land Use Classification (supermarkets) - Indianapolis Open Data http://imaps.indy.gov/ arcgis/rest/services/Zoning/MapServer/19 (updated Aug 2015)
Net Population Density
The second assumption followed by the study is walkways should go where people are (i.e., population density).
“Net Population Density” is calculated as the number of people per habitable acre of land. Areas of non-habitable land use / land cover are excluded, such as lakes, rivers, parks, mineral land use, industrial land use, select commercial land use, select exempt property land use and hospitals.
In evaluating where pedestrian infrastructure is needed, it is important to look at a fine grained picture of population density. “Net Population Density” is a new GIS data set created for the purpose of this study.
Population density is traditionally calculated as follows:
population density = (total population) / (land area - water)
For this study, we’ll refer to this as gross population density. In the equation, areas of water are subtracted because the area is not habitable. This gross measure of population density does not account for other types of non habitable land cover, such as park land and commercial property.
Net population density removes additional non-habitable areas to provide a more precise view of density and distribution of people within each block group.
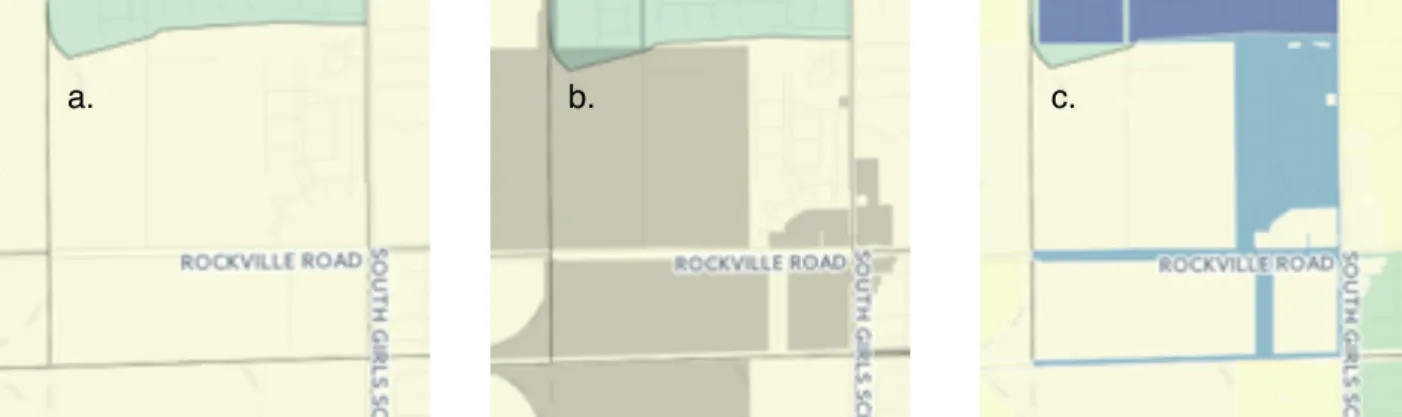
For example, the following Census block group is located on the west side of Indianapolis (Figure 2). According to the 2010 Census, its total population is 1265, and its gross population density is 4 people per acre (a). However, a large portion of the block group is comprised of non-habitable industrial and commercial land (shown overlain in grey) (b). The people are all located in the northeast corner of this block group. Subtracting non-habitable land, the net population density is 13 people per acre in the remaining land area, shown in blue (c).
a. b. c.
Figure 2. Census block group depicting the affect of non-habitable land use on population density measurements.
Clearly, net population density changes how the area would be evaluated for its public service needs, such as pedestrian infrastructure.
In this study, net population density is calculated as follows:
Net Population Density = (total population) / (total land area - lakes - rivers - parks - excluded land use)
Excluded land uses are data derived from joining Current Land Use Classification GIS data with land use codes consistent with non-habitable land uses, such as mineral land use, industrial land use, select commercial land use, select exempt property land use and hospitals (see Appendix A for the complete list of codes used).
DATA SOURCES
Total Land Area - 2010 Census block groups for Indianapolis, Marion County, Indiana from US Census Bureau.
Total Population - 2010 Census block groups for Indianapolis, Marion County, Indiana from US Census Bureau.
Marion County Lakes - Indianapolis Open Data http://imaps.indy.gov/arcgis/rest/services/ OpenData/FeatureServer/13 (updated Oct 2015).
Marion County Rivers - Indianapolis Open Data http://imaps.indy.gov/arcgis/rest/services/ OpenData/FeatureServer/14 (updated Oct 2015).
Indianapolis Parks - Indianapolis Open Data http://imaps.indy.gov/arcgis/rest/services/ OpenData/FeatureServer/6 (updated Oct 2015).
Current Land Use Classification - Indianapolis Open Data http://imaps.indy.gov/arcgis/rest/ services/Zoning/MapServer/19 (updated Aug 2015)
Property Class Codes from the Indiana Property Tax Management Systems Code List Manual, Indiana Department of Local Government Finance, http://www.in.gov/dlgf/files/
Net Social Index Concentration
The third assumption followed by the study is that certain social factors, such as age, income and education, may limit people's transportation options thus making walkways a higher need. “Net Social Index” show which parts of Indianapolis have the highest population density and concentration of people who may have limited transportation options, based on certain social factors, such as age, income and education.
The US Environmental Protection Agency (EPA) has developed a new environmental justice (EJ) mapping and screening tool, called EJSCREEN. It is an approach that combines environmental and demographic indicators in maps and reports.
We adapt the EJSCREEN methodology with local-scale (Census block group) data to calculate social index (SI) based on the following six demographic indicators:
1. Percent low income household — % where household income is less than or equal to 2 x the 2015 federal poverty level ($36,020 for average family size of 2.5 people/family) (Source: Census American Community Survey 2013 5-year Estimates)
% low income household = (sum households <= 34,999)/households) * 100
2. Percent non-white — % of population who list status as any other than “non-hispanic white alone” (Source: 2010 Census)
% non-white = ((total pop - non-hispanic white) / total pop) * 100
3. Percent with less than a high school education — % population over age 25 with less than a high school diploma (Source: Census American Community Survey 2013 5-year Estimates)
% less than HS education = ((sum < HS Diploma) / total over 25) * 100
4. Percent linguistic isolation — % of population living in linguistically isolated households, in which members of household over age 14 speak a non-English language and also speak english less than “very well” (Source: Census American Community Survey 2013 5-year Estimates)
% linguistic isolation = (SUM all households with limited speaking status / total estimated households ) * 100
5. Percent under 5 years of age — % of population under 5 years of age (Source: 2010 Census)
% under 5 = (pop under 5 / total pop) *100
6. Percent over 64 years of age — % of population over 64 years of age (Source: 2010 Census)
% over 64 = (pop 65 and over / total pop) * 100
The above indicators are used to calculate a social index (SI), as follows:
SI = (% low income + % non-white + % no HS + % limited eng + % under 5 + % over 64) / 6
Net Social Index Concentration
Net Social Index Concentration is a measure of the concentration of the social index based on net population density.
Concentration helps provide a picture of relative areas of greatest need in proportion to the population. For example, two block groups can have the same SI but wildly different population densities.
Net SI Concentration = SI * net population density
The net social index concentration is displayed on the map in five classes, high to low, based on quantiles (equal classes). This provides even distribution of values among classes as viewed on a histogram:
For each class (starting with the highest), we select missing walkway segments that intersect, touch, overlap, cross, or are completely within that class (herein “touches” the class), then assign a score to those missing walkways as follows:
If a missing walkway segment touches more than one class, it is assigned a score according to the highest Net Social Index Concentration class it touches.
These scores are used in combination with proximity to destination scores to rank missing walkways, as described in the following section.
(See Appendix D - Mapping in qGIS)
DATA SOURCES
Census American Community Survey 2013 5-year Estimates — Percent low income households; Percent with less than a high school education; Percent linguistic isolation.
2010 Census — Percent non-white; Percent under 5 years of age; Percent over 64 years of age Obamacare Facts — 2015 Federal Poverty Level http://obamacarefacts.com/federal-poverty-level/
EJ SCREEN (online resource accessed Sept 2015) http://www2.epa.gov/ejscreen
Net Social Index Concentration Score
> 300 5
194-299 4
110-193 3
58-109 2
Ranking Indy’s Most Needed Walkways (RESULTS)
The final step to prioritize Indianapolis’ missing walkways is to tally the scores for each segment, adding Net SI Concentration score and and proximity to destination scores.
For example, a missing walkway segment may receive the following scores:
Net SI Concentration 3
Grocery walk radius 1
Elementary school walk radius 1
Bus Stop walk radius 1
_____
total score 6
The final range of combined scores was 1 - 13.
The resulting map depicts a low to high priority ranking of missing walkways, presented in 5 classes as shown on the above histogram. The actual numbers represent a combined score of Net SI Concentration and scores representing proximity to destinations. The final scores are relative and thus presented as “low” to “high” priority rather than absolute values.
The results of the study are presented through four maps, displayed online through the CartoDB map service:
1. 2014 Existing Pedestrian Network 2. Missing Walkways
3. Destinations
Bridging Small Gaps
Short segments of sidewalk and multi-use trials (for example, under 200’) within the pedestrian network may represent key gaps. In particular, where these short segments also score high in combined Net Social Index Concentration and proximity to destinations, those segments should be field verified and evaluated for higher priority status.
Appendix A
From the Indiana Property Tax Management System Code List Manual
http://www.in.gov/dlgf/files/CODE_LIST_2010_-_PAGES_SEPARATED.pdf
Codes used to identify non-habitable land use, i.e., Excluded Land Uses:
200 MINERAL
300 INDUSTRIAL VACANT LAND 310 INDUSTRIAL FOOD & DRINK
320 INDUSTRIAL FOUNDRIES & HEAVY MANUFACTURING 330 INDUSTRIAL MEDIUM MANUFACTURING & ASSEMBLY 340 INDUSTRIAL LIGHT MANUFACTURING & ASSEMBLY 345 INDUSTRIAL OFFICE
346 INDUSTRIAL RESEARCH AND DEVELOPMENT FACILITY 350 INDUSTRIAL WAREHOUSE
360 INDUSTRIAL TRUCK TERMINALS 370 INDUSTRIAL SMALL SHOPS
380 INDUSTRIAL MINES AND QUARRIES 385 INDUSTRIAL LANDFILL
390 INDUSTRIAL GRAIN ELEVATORS
398 INDUSTRIAL BUILDING ON LEASED LAND 399 INDUSTRIAL OTHER STRUCTURES
420 COMMERCIAL SMALL RETAIL 421 COMMERCIAL SUPERMARKETS
422 COMMERCIAL DISCOUNT & JUNIOR DEPARTMENT STORES 424 COMMERCIAL FULL LINE DEPARTMENT STORES
425 COMMERCIAL NEIGHBORHOOD SHOPPING CENTER 426 COMMERCIAL COMMUNITY SHOPPING CENTER 427 COMMERCIAL REGIONAL SHOPPING CENTER 428 COMMERCIAL CONVENIENCE MARKET
429 COMMERCIAL OTHER RETAIL STRUCTURES 430 COMMERCIAL RESTAURANT, CAFÉ, OR BAR 431 COMMERCIAL FRANCHISE-TYPE RESTAURANT 435 COMMERCIAL DRIVE-IN RESTAURANT
439 COMMERCIAL OTHER FOOD SERVICE
440 COMMERCIAL DRY CLEAN PLANT OR LAUNDRY 441 COMMERCIAL FUNERAL HOME
442 COMMERCIAL MEDICAL CLINIC OR OFFICES 443 COMMERCIAL DRIVE-UP / WALK-UP BANK ONLY 444 COMMERCIAL FULL SERVICE BANKS
445 COMMERCIAL SAVINGS AND LOANS
447 COMMERCIAL OFFICE BUILDING 1 OR 2 STORY 448 COMMERCIAL OFFICE O/T 47 WALK-UP
449 COMMERCIAL OFFICE O/T 47 ELEVATOR
450 COMMERCIAL CONVENIENCE MARKET WITH GASOLINE SALES
COMMERCIAL CONVENIENCE MARKET / FRANCHISE-TYPE RESTAURANT WITH GASOLINE SALES
452 COMMERCIAL AUTO SERVICE STATION 453 COMMERCIAL CAR WASHES
454 COMMERCIAL AUTO SALES & SERVICE 455 COMMERCIAL GARAGE
456 COMMERCIAL PARKING LOT OR STRUCTURE 460 COMMERCIAL THEATERS
461 COMMERCIAL DRIVE-IN THEATERS 462 GOLF RANGE OR MINIATURE COURSE 463 COMMERCIAL GOLF COURSE
464 COMMERCIAL BOWLING ALLEY
465 COMMERCIAL LODGE HALL OR AMUSEMENT PARK 466 COMMERCIAL AMUSEMENT PARK
467 COMMERCIAL HEALTH CLUB 468 COMMERCIAL ICE RINK
469 COMMERCIAL RIVERBOAT GAMING RESORT 480 COMMERCIAL WAREHOUSE
481 COMMERCIAL MINI-WAREHOUSE 482 COMMERCIAL TRUCK TERMINALS
490 COMMERCIAL MARINE SERVICE FACILITY 495 COMMERCIAL MARINA
496 COMMERCIAL MARINA - SMALL BOATS 498 COMMERCIAL BUILDING ON LEASED LAND
600 EXEMPT PROPERTY OWNED BY THE UNITED STATES OF AMERICA 610 EXEMPT PROPERTY OWNED BY THE STATE OF INDIANA
620 EXEMPT PROPERTY OWNED BY A COUNTY 630 EXEMPT PROPERTY OWNED BY A TOWNSHIP
640 EXEMPT PROPERTY OWNED BY A MUNICIPALITY (but not any exempt property whose owner name contains the term “housing”)
650 EXEMPT PROPERTY OWNED BY A BOARD OF EDUCATION 660 EXEMPT PROPERTY OWNED BY A PARK DISTRICT
665 EXEMPT PROPERTY OWNED BY A PUBLIC LIBRARY
670 EXEMPT PROPERTY OWNED BY A PRIVATE ACADEMY OR COLLEGE
686 CHURCH, CHAPEL, MOSQUE, SYNAGOGUE, TABERNACLE, OR TEMPLE THAT IS GRANTED AN EXEMPTION
690 EXEMPT PROPERTY OWNED BY A CEMETERY ORG THAT IS GRANTED AN EXEMPTION
821 STATE ASSESSED PROPERTY OWNED BY A LIGHT, HEAT, OR POWER COMPANY THAT CONSTITUTES A PART OF ANY RIGHT-OF-WAY OF THE LIGHT, HEAT, OR
825 LOCALLY ASSESSED PROPERTY OWNED BY A LIGHT, HEAT, OR POWER COMPANY- INDUSTRIAL
830 LOCALLY ASSESSED PROPERTY OWNED BY A PIPELINE COMPANY-COMMERCIAL 840 LOCALLY ASSESSED PROPERTY OWNED BY A RAILROAD COMPANY-COMMERCIAL 841 STATE ASSESSED OPERATING PROPERTY OWNED BY A RAILROAD COMPANY 845 LOCALLY ASSESSED PROPERTY OWNED BY A RAILROAD COMPANY-INDUSTRIAL
(for qGIS selection)
"PROPERTY_S" = 200 OR
"PROPERTY_S" = 300 OR
"PROPERTY_S" = 310 OR
"PROPERTY_S" = 320 OR
"PROPERTY_S" = 330 OR
"PROPERTY_S" = 340 OR
"PROPERTY_S" = 345 OR
"PROPERTY_S" = 346 OR
"PROPERTY_S" = 350 OR
"PROPERTY_S" = 360 OR
"PROPERTY_S" = 370 OR
"PROPERTY_S" = 380 OR
"PROPERTY_S" = 385 OR
"PROPERTY_S" = 390 OR
"PROPERTY_S" = 398 OR
"PROPERTY_S" = 399 OR
"PROPERTY_S" = 420 OR
"PROPERTY_S" = 421 OR
"PROPERTY_S" = 422 OR
"PROPERTY_S" = 424 OR
"PROPERTY_S" = 425 OR
"PROPERTY_S" = 426 OR
"PROPERTY_S" = 427 OR
"PROPERTY_S" = 429 OR
"PROPERTY_S" = 428 OR
"PROPERTY_S" = 430 OR
"PROPERTY_S" = 431 OR
850 LOCALLY ASSESSED PROPERTY OWNED BY A SEWAGE COMPANY-COMMERCIAL 855 LOCALLY ASSESSED PROPERTY OWNED BY A SEWAGE COMPANY-INDUSTRIAL
860 LOCALLY ASSESSED PROPERTY OWNED BY A TELEPHONE, TELEGRAPH, OR CABLE COMPANY-COMMERCIAL
865 LOCALLY ASSESSED PROPERTY OWNED BY A TELEPHONE, TELEGRAPH, OR CABLE COMPANY-INDUSTRIAL
870 LOCALLY ASSESSED PROPERTY OWNED BY A WATER DISTRIBUTION COMPANY- COMMERCIAL
875 LOCALLY ASSESSED PROPERTY OWNED BY A WATER DISTRIBUTION COMPANY- INDUSTRIAL
"PROPERTY_S" = 435 OR
"PROPERTY_S" = 439 OR
"PROPERTY_S" = 440 OR
"PROPERTY_S" = 441 OR
"PROPERTY_S" = 442 OR
"PROPERTY_S" = 443 OR
"PROPERTY_S" = 444 OR
"PROPERTY_S" = 445 OR
"PROPERTY_S" = 447 OR
"PROPERTY_S" = 448 OR
"PROPERTY_S" = 449 OR
"PROPERTY_S" = 450 OR
"PROPERTY_S" = 451 OR
"PROPERTY_S" = 452 OR
"PROPERTY_S" = 453 OR
"PROPERTY_S" = 454 OR
"PROPERTY_S" = 455 OR
"PROPERTY_S" = 456 OR
"PROPERTY_S" = 460 OR
"PROPERTY_S" = 461 OR
"PROPERTY_S" = 462 OR
"PROPERTY_S" = 463 OR
"PROPERTY_S" = 464 OR
"PROPERTY_S" = 465 OR
"PROPERTY_S" = 466 OR
"PROPERTY_S" = 467 OR
"PROPERTY_S" = 468 OR
"PROPERTY_S" = 469 OR
"PROPERTY_S" = 480 OR
"PROPERTY_S" = 481 OR
"PROPERTY_S" = 482 OR
"PROPERTY_S" = 490 OR
"PROPERTY_S" = 495 OR
"PROPERTY_S" = 496 OR
"PROPERTY_S" = 498 OR
"PROPERTY_S" = 600 OR
"PROPERTY_S" = 610 OR
"PROPERTY_S" = 620 OR
"PROPERTY_S" = 630 OR
"PROPERTY_S" = 640 AND NOT "FULLOWNERN" ILIKE '%Housing%' OR
"PROPERTY_S" = 650 OR
"PROPERTY_S" = 660 OR
"PROPERTY_S" = 665 OR
"PROPERTY_S" = 670 OR
"PROPERTY_S" = 686 OR
"PROPERTY_S" = 690 OR
"PROPERTY_S" = 821 OR
"PROPERTY_S" = 825 OR
"PROPERTY_S" = 830 OR
"PROPERTY_S" = 840 OR
"PROPERTY_S" = 841 OR
"PROPERTY_S" = 845 OR
"PROPERTY_S" = 850 OR
"PROPERTY_S" = 855 OR
"PROPERTY_S" = 860 OR
"PROPERTY_S" = 865 OR
"PROPERTY_S" = 870 OR
"PROPERTY_S" = 875 OR
"FULLOWNERN" ILIKE '%Hospital%'
Appendix B
Styles applied to missing sidewalks In cartodb.com: /** choropleth visualization */
#missing_sidewalks_updated{ polygon-opacity: 0;
line-color: #FFFFB2; line-width: 5; } #missing_sidewalks_updated [ priority <= 13] { line-color: #C1373C; line-opacity: 1.0; } #missing_sidewalks_updated [ priority <= 10] { line-color: #fd8d3c; line-opacity: 0.9; } #missing_sidewalks_updated [ priority <= 7] { line-color: #fecc5c; line-opacity: 0.8; } #missing_sidewalks_updated [ priority <= 5] { line-color: #ffeda0; line-opacity: 0.8; } #missing_sidewalks_updated [ priority <= 3] { line-color: #ffffcc; line-opacity: 0.6; }
Appendix C
Mapping Destinations In qGIS:For each of the above destination walk radius, choose ‘Vector > Research Tools > Select By Location’. Select features in Missing Pedestrian Network that intersect, touch,
overlap, cross, or are completely within (herein “touches”) features in destination walk radius. Create a new selection in Missing Pedestrian Network.
In Missing_Sidewalks_UPDATED (this is a new layer for Missing Sidewalks), for each selection ‘Open Field Calculator’. Choose ‘Only update __ selected features’ and ‘Create a new field’. Name the field appropriate to an abbreviation for destination type and walk radius, and add a score of “1” to those selected features.
For each new destination attribute, select IS NULL and update to “0”.
Groceries - Since we did not have a point layer for groceries, we used polygons classified as “supermarket” in current land use. Not all parcels identified as groceries may be active in business.
Appendix D
Mapping Net Social Index Concentration In qGIS:
Steps to select a class in the layer Net_Social_Index_Concentration.
1) Choose layer Net_Social_Index_Concentration and ’Select by expression’ one of the following (start with highest class):
1) “NETSI_CONC" >= 300
2) "NETSI_CONC" < 300 AND "NETSI_CONC" >= 194 3) "NETSI_CONC" < 194 AND "NETSI_CONC" >= 110 4) "NETSI_CONC" < 110 AND "NETSI_CONC" >= 58 5) "NETSI_CONC" < 58 AND "NETSI_CONC" >= 0
2) With one of the above Net_Social_Index_Concentration classes selected, choose ‘Vector > Research Tools > Select By Location’. Select features in Missing Pedestrian Network that intersect features in Net_Social_Index_Concentration, using only the selected features from Net_Social_Index_Concentration. Create a new selection in Missing Pedestrian Network.
3) Add a score attribute to the selected Missing Pedestrian Network features, but do not change the score if a selected feature is already associated with a higher class, by the following steps:
1) Start with the highest Net_Social_Index_Concentration class (i.e., >300).
2) Open Missing Pedestrian Network attribute table and Move selection to top (this is just to view the selection. (Note, after the first records have been assigned a score, in subsequent selections some records may already have been assigned a higher score.)
3) Open ‘Select features using an expression’ and remove previously scored segments from the selection. (Note, this step is unnecessary the first time through since no records will have been assigned to another score yet.) For example:
"Net_SI_Con" = 10 OR "Net_SI_Con" = 8
Then choose ‘Remove from selection’ under the ‘Select’ button.
4) Choose ‘Open Field Calculator’. Choose ‘Only update __ selected features’. With the first selection, ‘Create a new field’ called “Net_SI_Con”. In subsequent selections, update the selected features from the existing field ‘Net_SI_Con’ and assigning its score as appropriate for the Net_Social_Index_Concentration class.
5) Save edits and repeat for each Net_Social_Index_Concentration class until every Missing Pedestrian Infrastructure segment is assigned a score.