Technological University Dublin Technological University Dublin
ARROW@TU Dublin
ARROW@TU Dublin
Dissertations School of Computing
2018
Predicting Happiness - Comparison of Supervised Machine
Predicting Happiness - Comparison of Supervised Machine
Learning Techniques Performance on a Multiclass Classification
Learning Techniques Performance on a Multiclass Classification
Problem
Problem
Dorota NiecieckaTechnological University Dublin
Follow this and additional works at: https://arrow.tudublin.ie/scschcomdis Part of the Computer Sciences Commons
Recommended Citation Recommended Citation
Nieciecka, Dorota (2018). Predicting happiness - comparison of supervised machine learning techniques performance on a multiclass classification problem. Masters dissertation, DIT, 2018.
This Dissertation is brought to you for free and open access by the School of Computing at ARROW@TU Dublin. It has been accepted for inclusion in Dissertations by an authorized administrator of ARROW@TU Dublin. For more information, please contact
[email protected], [email protected], [email protected].
This work is licensed under a Creative Commons Attribution-Noncommercial-Share Alike 3.0 License
Predicting happiness – Comparison of
Supervised Machine Learning
Techniques performance on a multiclass
classification problem
Dorota Nieciecka
A dissertation submitted in partial fulfilment of the requirements of
Dublin Institute of Technology for the degree of
M.Sc. in Computing (Data Analytics)
I
DECLARATION
I certify that this dissertation which I now submit for examination for the award of MSc in Computing (Data Analytics), is entirely my own work and has not been taken from the work of others save and to the extent that such work has been cited and acknowledged within the test of my work.
This dissertation was prepared according to the regulations for postgraduate study of the Dublin Institute of Technology and has not been submitted in whole or part for an award in any other Institute or University.
The work reported on in this dissertation conforms to the principles and requirements of the Institute‟s guidelines for ethics in research.
Signed: Dorota Nieciecka ____________________________
II
ABSTRACT
In the modern world, especially in contemporary economies and politics, a population's subjective well-being is a frequent subject of the public debate. As comparisons of happiness levels in different countries are published, different circumstances and their effect on the value of the subjective well-being reported by people are also analysed. However, a significant amount of the research related to subjective well-being and its determinants is still based upon survey answers and employing conventional statistical methods providing details regarding correlations and causality between different factors and subjective well-being. Application of Supervised Machine Learning techniques for prediction of subjective well-being may provide new ways of understanding how individual factors contribute to the concept value and allow for addressing any issues, which may potentially affect mental and physical health.
The focus of this research is to use the survey data and make predictions regarding subjective well-being (a multiclass target) using Supervised Machine Learning models. In particular, the study is aimed at comparing the performance of two techniques: Decision Tree and Neural Networks. The „C4.5 algorithm‟ used by the Decision Trees is considered as the benchmark algorithm, to which other supervised learning algorithms should be compared. At the same time, Neural Networks were previously proven to have high predictive power, even with multiclass categorisation problems. Two experiments are conducted as part of this research, one using original highly imbalanced data; the other using the dataset balanced using SMOTE. The experimental results gathered show that for the first experiment there is no statistically significant difference (p<0.01) between models performance, while for the second experiment Neural Network‟s performance is lower than the one of a Decision Tree model with a statistically significant difference (p<0.01). With the 62.1% of the highest accuracy achieved, it is suggested that further research should be conducted to verify if any other Machine Learning model or approach to multiclass target classification could present better results when making prediction using survey data.
Keywords: Subjective Well-being, Supervised Machine Learning, Multiclass Classification, Imbalanced Data, SMOTE
III
ACKNOWLEDGEMENTS
First and foremost, I would like to express my sincerest gratitude to my supervisor, Dr Deidre Lillis, for the patient guidance, constructive suggestions, expert advice and the encouragement provided throughout this research project. This accomplishment would not have been completed without her.
I would also like to thank all Dublin Institute of Technology (DIT) academic staff especially my professors at School of Computing for their knowledge, help, guidance and kindness, especially Dr Luca Longo, who has provided me with insight and the tools that I needed to choose the right direction and helped me at the start of this research project.
Additionally, I would like to acknowledge members of Healthy Ireland and ISSDA, who provided the resources used in this research (accessed via the Irish Social Science Data Archive - www.ucd.ie/issda), and declare that those, who carried out the original analysis and collection of the data, bear no responsibility for the further analysis or interpretation of it, done as a part of this research.
Finally, I would like to express my gratitude to my husband for providing me with continuous encouragement and support, not only through the process of researching and writing this thesis, but also throughout all years of study before it.
IV
TABLE OF CONTENTS
DECLARATION ... I ABSTRACT... II ACKNOWLEDGEMENTS ... III TABLE OF CONTENTS ... IV LIST OF TABLES ... VII LIST OF FIGURES ... VIII1. INTRODUCTION ... 1
1.1. Background ... 1
1.2. Research Project ... 1
1.3. Research Objectives ... 2
1.4. Research Methodologies ... 3
1.5. Scope and Limitations ... 3
1.6. Document Outline ... 4
2. LITERATURE REVIEW AND RELATED WORK ... 6
2.1. Subjective well-being ... 7
2.1.1. Concept definition ... 7
2.1.2. Factors affecting SWB ... 8
2.1.3. Health Ireland Initiative ... 12
2.2. Machine Learning ... 13
2.2.1. Types of Machine Learning ... 14
2.2.2. Decision Trees ... 16
2.2.3. Neural Networks ... 18
2.2.4. Multiclass Classification Problem ... 18
2.3. Machine Learning in SWB Research ... 19
2.3.1. Gaps in Research ... 20
3. DESIGN AND METHODOLOGY ... 21
3.1. Business Understanding ... 23
V
3.2.1. Dataset Description ... 23
3.2.2. Target Variable Investigation ... 24
3.2.3. Feature Investigation ... 25
3.2.4. Feature selection ... 25
3.3. Data preparation ... 26
3.3.1. Missing Values Handling ... 26
3.3.2. Feature Selection... 26
3.3.3. Imbalance reduction ... 26
3.3.4. Normalisation ... 28
3.4. Modelling ... 29
3.5. Evaluation ... 29
3.5.1. Model performance comparison ... 30
3.5.2. Statistical significance and hypothesis evaluation ... 33
3.6. Software ... 34
3.7. Strength and limitations ... 35
4. IMPLEMENTATION AND RESULTS ... 36
4.1. Business understanding ... 36
4.2. Data Understanding and Preparation ... 36
4.2.1. Target Variable ... 37
4.2.2. Independent variables – missing values handling ... 38
4.2.3. Independent variables – feature selection ... 40
4.2.4. Feature investigation ... 42
4.2.5. Data normalisation ... 45
4.2.6. Target variable - imbalance removal ... 45
4.3. Modelling ... 46
4.3.1. Decision Tree modelling ... 49
4.3.2. Neural Networks modelling ... 52
4.4. Evaluation ... 53
4.4.1. Model performance comparison ... 53
4.4.2. Statistical significance and hypothesis evaluation ... 58
VI
5. ANALYSIS AND DISCUSSION... 62
5.1. Strength and limitations of results ... 62
5.2. Considerations in regards to previous research ... 64
6. CONCLUSION ... 66
6.1. Research Overview ... 66
6.2. Problem Definition ... 66
6.3. Design/Experimentation, Evaluation & Results ... 67
6.4. Contributions and impact ... 68
6.5. Future Work & recommendations ... 69
BIBLIOGRAPHY ... 70
APPENDIX A: SAS CODE ... 79
VII
LIST OF TABLES
Table 3.1 Target variable question and answers details ... 24
Table 3.2 Fit Statistics Grouping by Prediction Type ... 31
Table 4.1 Target variable mapping ... 37
Table 4.2 Variables rejected due to missing values count ... 39
Table 4.3 Selected Features Categorisation ... 41
Table 4.4 Feature selection algorithms output comparison ... 42
Table 4.5 Summary Statistics for selected features ... 43
Table 4.6 Count of individual classes before and after over-sampling ... 45
Table 4.7 Fit Statistics - models selected ... 53
Table 4.8 Model Performance - Misclassification Rates ... 55
Table 4.9 Wilcoxon Signed-Rank Test Results - Experiment 1 ... 58
VIII
LIST OF FIGURES
Figure 2.1 Overview of Literature Review and Related Work Chapter ... 6
Figure 2.2 Factors contributing to subjective well-being (Eurostat, 2005) ... 11
Figure 2.3 Examples of Machine Learning Tasks (Kaplan, 2017) ... 16
Figure 2.4 Potential ID3-generated Decision Tree ... 17
Figure 2.5 Two-layer Neural Network (Han, Pei and Kamber, 2011) ... 18
Figure 3.1 Phases of the CRISP-DM reference model (Chapman, et. al. 2000) ... 21
Figure 3.2 High-level Experiment Design Phases (by author) ... 22
Figure 3.3 Imbalance removal techniques (Pozzolo, 2016) ... 27
Figure 3.4 Schematic representation of 10-fold cross validation ... 30
Figure 3.5 Confusion Matrix ... 32
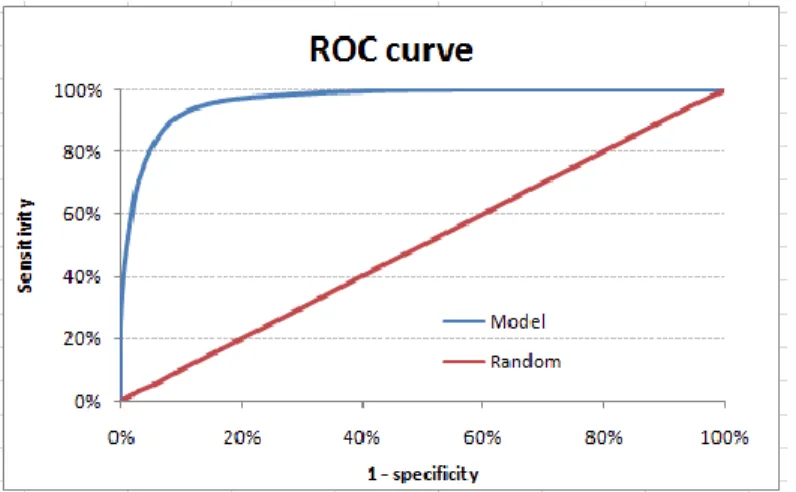
Figure 3.6 Example ROC curve (Bradley, 1997) ... 33
Figure 3.7 Example Agreement Plot (Giavarina, 2015) ... 34
Figure 4.1 Target variable classes‟ distribution ... 38
Figure 4.2 Feature distribution ranges ... 44
Figure 4.3 Imbalanced vs. balanced target ... 46
Figure 4.4 Experiment workflows ... 47
Figure 4.5 Distribution of target class in cross validation folds ... 48
Figure 4.6 Initial Decision Tree created ... 49
Figure 4.7 Sub-tree Assessment Plots - over-fitting model ... 50
Figure 4.8 Decision Tree – selected model settings... 51
Figure 4.9 Sub-tree Assessment Plots - model selected ... 51
Figure 4.10 Iteration Plots - selected NN model ... 52
Figure 4.11 Misclassification Rates of Model ... 54
Figure 4.12 Confusion Matrices for Imbalanced Data Experiment ... 56
Figure 4.13 Confusion Matrices for Balanced Data Experiment ... 57
Figure 4.14 Agreement Plot - Experiment 1 ... 59
1
1.
INTRODUCTION
1.1. Background
The concept of happiness, and how to achieve it, was of considered by the philosophers throughout the ages. However, as no formal definition was ever created, the philosophical concept of „„happiness‟‟ was renamed by the psychologists pioneering its scientific study who proposed the term “subjective well-being” to be used as an alternative (SWB; Diener, 1984).
In contemporary economies and politics, a population's subjective well-being (SWB) takes a central place in the public debate, where comparison of happiness levels in different countries are performed and different circumstances are discussed in the context of their effect on the value of the subjective well-being reported by people. Research performed to date proved that the SWB is in fact extremely complex and affected by a variety of different factors, including, but not limited to, socio-demographic or economic circumstances, social relationships, as well as, general health and health related habits, i.e.: diet, exercise and/or alcohol consumption.(Gerdtham and Johannesson, 2001; Adler, Dolan, and Kavetsos, 2017; Benjamin, et.al. 2014).
As the research continues, the exploration of the concept of using Machine Learning, or more specifically, testing the accuracy of making predictions regarding „subjective well-being‟, is an interesting area for research. Especially considering that there are various examples of successful applications of Machine Learning classification techniques for predictions in areas such as marketing and financial services, retail, travel, healthcare, sociology, and most recently social media, already exist (Finlay, 2014).
1.2. Research Project
The main purpose of the research is to build and compare performance of two Supervised Machine Learning models: Decision Trees and Neural Networks for the multiclass classification of the subjective well-being response. The data set used for
2
the experiment contains information regarding respondents self-reported level of subjective well-being, which was collected as a part of Healthy Ireland Survey. The remainder of the survey questions will be considered as the independent feature variables, thus they will be used to make predictions regarding the target variable. Two predictive models will be built and then tested using two sets of data: the original survey dataset (with imbalanced distribution of classes within the target variable), and the balanced dataset (where the instances for the minority classes was increased using SMOTE). The comparison of the classifiers performance will be then conducted, using the Misclassification Rate data collected in the cross-validation process and applicable statistical tests.
The main goal is to test the performance of two classification algorithms for the prediction of subjective well-being, where not only multiclass classification must be performed, but also the target variable is imbalanced, and to confirm if the performance difference present between the models is statistically significant. Thus, the main research question of this project can be defined as:
Which of the classifiers: Decision Trees or Neural Networks is more accurate in predicting subjective ‘well-being’ with the use of specified economic, social and health related factors?
The following hypotheses are considered to allow for addressing above research question:
H0: There is a statistically significant difference in the value of prediction accuracy of the subjective well –being between Neural Networks and Decision Trees with p-value <0.01
H1: There is no statistically significant difference in the value of prediction accuracy of the subjective well –being between Neural Networks and Decision Trees with p-value <0.01
1.3. Research Objectives
As the main goal of this research is to compare the performance of two classification algorithms on a multiclass classification problem and imbalanced data, the following objectives will have to be achieved in order to reach it: performed as mentioned below:
3
Perform a literature review of the research conducted in relation to subjective well-being and machine learning, including any research where Machine Learning algorithms were implemented
Perform initial data exploration followed by data cleaning and feature selection
Perform detail exploration of selected independent variables and apply any required changes, e.g. normalisation.
Build predictive models implementing Decision Tree and Neural Network algorithms.
Apply both models created on two datasets: balanced and imbalanced
Verify and compare models‟ performances using statistical tests and the Misclassification Rate obtained from k-fold cross validation process
Evaluate the study and present findings, conclusions and recommendations for future work
1.4. Research Methodologies
The focus of the research is the comparison of performance of two well-known supervised machine learning models for prediction of self-reported level of subjective well-being obtained as a part of the Healthy Ireland Survey, thus it is considered as secondary research.
Additionally, in order to accept or reject the research hypotheses, secondary quantitative data will be used to conduct an experiment involving development, employment, and evaluation of Machine Learning models. Results obtained through this process will then be compared using appropriate statistical tests. Therefore, the research methods for the report can be summarized as secondary, quantitative, empirical, and deductive.
1.5. Scope and Limitations
The major limitation of the research is the presence of imbalance in the multiclass target and fairly low correlation between the feature and the target variables, which may result in the low prediction accuracy of both models tested. Therefore, the two
4
models built will be tested on two datasets: the original survey dataset (with imbalanced distribution of classes within target variable), and the balanced dataset (where the instances for the minority classes was increased using SMOTE).
The first part of the experiment will allow for obtaining an insight on usefulness of the survey data in prediction of subjective feeling of happiness. The second part of experiment, where the balanced dataset will be used, will then provide the insight on how minority class imbalance removal may affect overall results. It is possible that the use of Synthetic Minority Over-sampling Technique on minority class may produce instances different than the real world data, which in effect may skew model results.
1.6. Document Outline
This research report consists six chapters in total, except for Chapter 1, the following sections can be identified:
Chapter 2 - Literature Review and Related Work: provides a review of research related to and important in terms of the research question and experiment. It is divided into three sections. The first one describes the concept of Subjective Well-Being, including its definition and affecting factors identified to date. Additionally, an overview of the Healthy Ireland Initiative is performed, to present not only the dataset background, but also the role of the Healthy Ireland Survey data collection in the process of improvement of overall well-being of the Irish population. The second part presents selected concepts related to Machine Learning, which were important for the decisions made in relation to experiment design and methodology. Finally, the last section presents SWB research to date, where Machine Learning was implemented as a tool, which serves as the foundation for identifications of any gaps present.
Chapter 3 – Design and methodology: describes in detail the design of the experiment performed as a part of the research, including explanation of each phase and step, including the details regarding the software used for it.
Chapter 4 – Implementation and results: describes the implementation of the experiment. It describes all the activities performed together with the actual results obtained; those include the preparation of the dataset, feature selection, model
5
building and adjustment, as well as model comparison in the cross-validation. The hypothesis testing is also performed here.
Chapter 5 – Analysis and discussion: presents detailed analysis and evaluation of experimental results. The strength and weaknesses of the experiment are analysed here. Additionally, the findings obtained in the experiment are then compared to other findings that were previously identified and discussed in the literature review.
Chapter 6 – Conclusion: provides a summary of the research undertaken including problem definition, critical analysis of the experiment design and implementation, as well as evaluation of the results. Additionally, it presents the discussion regarding possible improvements and future work.
6
2.
LITERATURE REVIEW AND RELATED WORK
This chapter provides a review of the literature of research and the work related to the concept of subjective well-being and some concepts from machine learning, which will allow for answering the research question. Four areas discussed here are: Healthy Ireland Initiative, Subjective Well-Being, Machine Learning, and Application of Machine Learning in SWB Research, all of these are presented in the Figure 2.1 below.
Figure 2.1 Overview of Literature Review and Related Work Chapter
The first section of literature review is concerned with the concept of subjective well-being and its first emergence in the literature. The details of the concept will be presented together with its importance for one‟s overall mental health. The Healthy Ireland Initiative will also be discussed here, as the data used for the research was originally collected in a survey as a part of this initiative. Findings from the original report regarding survey data and other publications related to the subjective well-being will be reviewed, as they are of relevance to the research question. Analysis of research related to different groups of factors affecting SWB will be performed, which
7
will be followed by the comparison of groups of factors available in the dataset used for the experiment.
The second section describes some of the Machine Learning definitions and concepts which are relevant to the experiment performed in this research, including a review of previous research leading to approach selection, together with categorisation and definition of algorithms and strategies selected.
Finally, the last section of the review is related to the analysis of the research and publications related to the use of Machine Learning for the prediction or exploration of SWB, together with a discussion regarding its advantages and disadvantages.
The chapter is concluded with an analysis of gaps identified in all review sections leading to the research question definition. Brief discussion regarding motivation behind the research and the limitations is also made here.
2.1. Subjective well-being
This section describes the concept of Subjective Well-Being, including its definition and affecting factors identified to date. Additionally, an overview of the Healthy Ireland Initiative is performed, to present not only the dataset background, but also the role of the Healthy Ireland Survey data collection in the process of improvement of the overall well-being of Irish population.
2.1.1. Co nc ept de fin it io n
One of the definitions of the concept of subjective well-being (SWB) describes it as personal, emotional, and cognitive evaluation of individual‟s life. The name „subjective well-being‟ is also alternatively called: happiness, peace, fulfilment, and life satisfaction (Diener, Oishi & Lucas, 2002).
Subjective well-being, or rather “happiness,” has been of significant interest throughout most of human history. Unfortunately, there is no uniform definition of the concept and how it can be achieved. In fact, the definition has been debated for as long as philosophers have been inquiring the concept. Starting with Ancient Greece, an exploration of the nature of happiness was made by Democritus (460 BC–370 BC),
8
which was then followed by such philosophers as Socrates, Plato, or Aristotle , and many others throughout different eras, from the Middle Ages through to the Age of Enlightenment up to 19th century‟s Utilitarianism (Tatarkiewicz, 1976). Review of those provides proof that although different philosophies through centuries differ significantly from one another, most of the philosophers agreed on one thing, which is the difficulty of defining the happiness. Thus, the philosophical concept of „„happiness” was renamed by the psychologists pioneering its scientific study; they proposed the term “subjective well-being” to be used as an alternative (SWB; Diener, 1984).
As previously mentioned, “subjective well-being” can be defined as individual‟s personal evaluation of their life. Thus, it includes both the cognitive judgment of life satisfaction and the appraisal of emotions. This definition of SWB emphasizes the subjective nature of the concept. (Diener & Suh, 1997). Nevertheless, although assessment of SWB is subjective by nature, the review of literature also provides the evidence that subjective well-being is affected by a number of separable although related factors. Thus, in order to understand the SWB, many researchers attempted to determine how individual components are affecting it. These are discussed in detail in section 2.1.2 of the research paper.
However, the purpose of this research is not to define the concept of SWB, but to verify the use of Machine Learning algorithms in the prediction of SWB using survey data, which includes questions related to different groups of factors. An ability to make predictions regarding one‟s SWB could be valuable, for example in relation to the WHO report: „Promoting Mental Health‟, where an emphasis is made on SWB importance to overall mental health and possible negative outcomes resulting from low or negative subjective well-being (e.g. suicide, health deterioration, etc.) (WHO, 2005).
2.1.2. Fa ct o rs affe ct ing S WB
Modern research, including studies conducted by psychologists, sociologists and economists, increased the understanding of how the individual components (or factors) affect the subjective well-being. The main groups of factors include: economic circumstances, social relationships, as well as health and health related habits. These are discussed in more detail below:
9
Economic Factors
The most frequently analysed economic factors are employment and income. ow income is always correlated with low SWB (Becchetti and Rossetti, 2009). The analysis of the literature in the field provided evidence that, while higher absolute income increases SWB, this positive correlation is present only up to a certain level (Mentzakis and Moro, 2009). The same findings are made in the research by Ferrer-I-Carbonell (2005), Pedersen and Schmidt (2011) and Frey and Stutzer (2005), where positive correlation between income and life satisfaction is present only until the presence of “frustrated achievement”, where the increase of income is in fact associated with the reduction in life satisfaction, related to a decrease in areas such as health and quality of social relationships.
Unemployment is the other factor of interest. Data analysis and results obtained by Gerlach and Stephan (1996) provide evidence of a consistent strong negative correlation between the SWB and unemployment, however with the different levels of SWB values between men and women. At the same time, Dolan, Peasgood, and White (2008), while also providing proof of overall lower levels of SWB for unemployed individuals, highlighted the importance of factors from other groups, namely the social relationship group.
Unfortunately, only employment status data, but not the income, is collected as a part of Healthy Ireland Survey used for this research. Thus, while it will be possible to analyse the correlation and its strength between the unemployment and the SWB, it will not be possible to identify any cases of “frustrated achievement”. As all the previous research discussed above showed strong negative correlation between the unemployment and the SWB, this variable may also be relevant to the predictive models.
Social Relationships
Social relationships are another group of factors, which were proved to have a strong influence on the subjective well-being Fernández-Ballesteros, et.al. (2001). The research conducted in relation to this group includes such individual factors as: family relationships (North et.al, 2008), marriage (Schoon, Hansson and Salmela-Aro, 2005), and/or lack of social interaction (Umberson and Montez, 2010).
10
North et.al. (2008) examined the role of family life and its influence on the reported level of happiness. The authors proved that income had a small, positive impact on happiness, in contrast to family and social support, which had a strong positive relationship to change in happiness. Similar findings are also identified by Schoon, Hansson and Salmela-Aro (2005), who proved a positive correlation between successful marriage and overall feeling of happiness.
Alternatively, Umberson and Montez (2010) emphasize the importance of social relationships on the subjective well-being and overall health status resulting from it. An observation is made here that quantity and quality of social relationships (friendships, marriage, belonging to religious organization) have both short-term and long-term effects on life-satisfaction level.
As the data used for this research includes a set of question regarding social relationships, including marital status as well as social connectedness questions, it is possible that some of those variables will be selected in the feature selection process. Unfortunately, as no income data is present it won‟t be possible to compare the findings to the ones from the research by North, et.al (2008), however, the analysis of correlation will provide detail regarding, which of the two factors, social relationships or employment, are more significant for the prediction of SWB.
Health and Health Related Habits
Finally, the last group of factors, which is frequently investigated in the SWB research, is the health and health related habits. Dolan, Peasgood, and White (2008) argues that there is a strong relationship between SWB and both physical and mental health, with the stronger correlation being present for the mental health than physical health. Nevertheless, it is proved that some specific conditions, such as heart attacks and/or stroke always negatively affects subjective well-being (Shields & Wheatley Price, 2005), with the causality being from the health condition to SWB. Oswald and Powdthavee (2006) present evidence between prolonged sickness and/or disability and the reduction of SWB.
Alternatively, research by Stoica (2015) examines SWB in the different aspect and provides evidence of importance of sleep in self-assessed subjective well-being. It also shows that the happiness is not only a product of external factors, but is also based in part on circadian rhythms of an individual. Moreover, Coyle and Vera (2013) provide
11
evidence of strong negative correlation identified between unexpected or prolonged stress and the overall perceived SWB.
In regards to health related habits, research by Fox (1999) provided evidence that even simple types of exercise are associated with increased SWB, especially for individuals over 60 years old. Additionally, physical activity among those over 60 years old was also negatively associated with depressive symptoms (Baker et al., 2005).
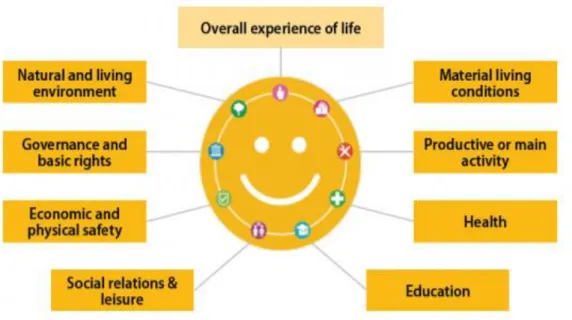
Health and health related factors are the main focus of the Healthy Ireland Survey questionnaire. Thus, it is possible that these factors will dominate over other inputs used by the predictive models. Thus, it will be important to analyse, which of the health related factors is the most strongly correlated with the SWB value prediction. All the above findings can be additionally considered in the context of government publications. The Eurostat reports (2015 and 2017) describe subjective well-being as a multidimensional concept of „overall experience of life‟, which can be considered the key indicators in the Quality of Life determination (see Figure 2.2, source: Eurostat, 2005). Therefore, the analysis of factors selected for the purposes of building the predictive models will be made with consideration to the categorisation made in those reports.
12 2.1.3. Hea lt h Ire la nd Init iat ive
Healthy Ireland is an initiative of the Irish Government with the purpose of improving the overall wellbeing of society, in terms of both physical and mental health. The initiative wants to reduce the risks to poorer health and wellbeing such as obesity, mental health problems, smoking, or alcohol abuse. Thus, one of the key activities of Healthy Ireland is to collect information not only about the health status, but also on how to improve it. This analysis also includes the collection of details related to the subjective well-being (Ipsos, 2016).
The data, which provides up-to-date information regarding the nation‟s health, is collected in the annual Healthy Ireland Survey, which is carried out by Ipsos MRBI on behalf of the Department of Health. The first survey was conducted between years 2014/2015 with the report on findings published in October 2015. The second survey was carried out between the years 2015/16 and a report of its findings published in October 2016 1. It is the data from this survey that will be used for the purposes of this research (Department of Health, 2016).
The report on key findings published by Ipsos (2016) didn‟t include the analysis of the individual questions, but focused on key fact from different sections of survey and their correlation with one another. Thus, it was reported that overall positive mental health is more likely higher among men than women. Additionally, physical activity and financial stability were the changes most frequently selected by the respondents, as the ones which would improve their health and wellbeing (Ipsos, 2016).
Literature review performed in regards to the research on subjective well-being provided the evidence that subjective well-being is affected by a number of separable although related factors. The main groups of factors include: economic circumstances, social relationships, and health and health related habits. As the purpose of this research is to verify the use of Machine Learning algorithms in the prediction of SWB using survey data, part of the data pre-processing will be to select individual features,
1
13
which includes questions related to above groups of factors. In effect it will be possible to categorise the factors selected, and compare their correlation to the target variable, with the one identified in the previous research.
2.2. Machine Learning
This section presents selected concepts related to Machine Learning, which were important for the decisions made in relation to experiment design and methodology. Machine learning is an interdisciplinary subfield in computer science that involves automated formulation of complex predictive models and algorithms through the use of multiple techniques from fields such as statistics, game theory, information theory and optimization. (Shalev-Shwartz and Ben-David, 2014). It was also defined as the process of converting experience into expertise (Carbonell, Michalski and Mitchell, 1983).
Machine Learning significantly evolved since its first emergence in Arthur Samuel‟s Checkers-playing program developed in 1952, and the initial work by Hunt, et al (1966) in inductive problem solving, Nilsson (1965) in statistical functions and data classification, Rosenblatt (1961) in Neural Networks, and Vapnik (1963) in Support Vector Machine. Currently, it is a widely acknowledged solution, which is used in such areas as pattern recognition, new knowledge development, and predictive analytics. (Siegel, 2016)
A review of literature related to Machine Learning provided a list of various examples of successful application of Machine Learning classification techniques for predictions making, regarding individuals in a large population, in areas such as: marketing and financial services, retail, travel, healthcare, sociology, and most recently social media (Finlay, 2014). This suggests that classification techniques could also be used for prediction making of the psychological concept of „subjective well-being‟
Additionally, as multiple different models can be listed, with the variety of them finding application in the commercial and public institutions, a review of empirical studies regarding model performance was performed. The findings from studies conducted by Caruana & Niculescu-Mizil (2006), Chavan, et.al. (2014), Zhang & Lee,
14
(2003) , (Iniesta, Stahl and McGuffin, 2016) and (Zoonen and Toni, 2016), which provide detailed comparison of various learning algorithms in different scenarios, including multiclass classification problems, allowed for the selection of Decision Trees and Neural Networks, as the algorithms which will be assessed to determine their effectiveness and accuracy in relation to prediction of „subjective well-being‟. As the accuracy of the classifier always varies for each individual dataset (Moran, He, & Liu, 2009), an experiment was conducted to determine which of the classifiers, Decision Trees or Neural Networks, is more accurate in predicting subjective „well-being‟ with the use of specified economic, social and health related factors.
Decision Trees were selected as they are the most fundamental machine learning models, which are able to provide interpretability and information about the importance of individual features. At the same time, Neural Networks were proven to outperform other models in multiclass categorisation when extension from binary is used (Pal and Mitra, 1992). Subsections 2.3.1 to 2.3.3 of this chapter will provide an overview of Machine Learning techniques chosen for the experimental purposes, as well as the main concept of interest related to them.
2.2.1. T ype s o f Ma c hine Lear ning
Machine Learning is a wide field, in which all the learning paradigms can be differently categorised. According to Shalev-Shwartz and Ben-David (2014), the following taxonomies should be considered:
Supervised versus Unsupervised
The first division of Machine Learning algorithms is based on the nature of their interaction between the learner and the environment.
In Supervised Machine Learning (Shalev-Shwartz and Ben-David, 2014) an algorithm is presented with a set of input variables (X) and an output variable (Y), and the goal of creating the mapping function, which then can be used to predict the output variables (Y) from new set of input data. Thus, the process is called supervised because algorithm training involves the oversight over the prediction made and knowledge of the correct answer. Therefore, learning can be stopped when the algorithm performance becomes acceptable.
15
On the other hand, Unsupervised Machine Learning (Shalev-Shwartz and Ben-David, 2014) involves a learning process where an algorithm is presented only with the set of inputs (X) and no output variables are specified. The purpose here is to model the underlying data structure or its distribution in order to obtain insight regarding any hidden patterns. Thus, as no correct answer exist, it is impossible to have an oversight over the model and its performance.
Active versus Passive Learners
Learning paradigms can also be categorised based on the role played by the algorithm, also called a learner, in addition to its interaction with the learning environment described in the previous point. It is possible to distinguish two types of learners: active and passive (Shalev-Shwartz and Ben-David, 2014). An active learner is a type which interacts with the environment during the training process (via queries or experiments), while a passive learner only uses the data provided without influencing it.
Online versus Batch Learning
Another parameter to consider is the distinction between situations in which the learner is presented with the data in sequential order, known as online learning, as opposed to batch learning, where the algorithms is trained and generates the best predictor by learning on the entire training data set at once(Shalev-Shwartz and Ben-David, 2014).
Learning Problem Type
Finally, the last categorisation of Machine Learning algorithms is considered with the output that‟s being produced by the model (Shalev-Shwartz and Ben-David, 2014). The most important types include:
o Classification, where a model, also called classifier, is trained to identify the discrete class of a target variable, when a set of inputs is given. It is possible to distinguish here: binary classification (target variable has only 2 classes) or
multiclass classification (where the problem can belong to one of three or more classes)
16
o Clustering, where all inputs are being divided into groups. However, the groups are not known before the training of an algorithm starts (Shalev-Shwartz and Ben-David, 2014).
This research considers only a subset of presented learning paradigms. The main focus of the experiment performed is to analyse and compare the performance of supervised classification batch learning with both passive learner (Decision Tree) and active learner (Neural Network).
Figure 2.3 Examples of Machine Learning Tasks (Kaplan, 2017)
2.2.2. Dec is io n Tree s
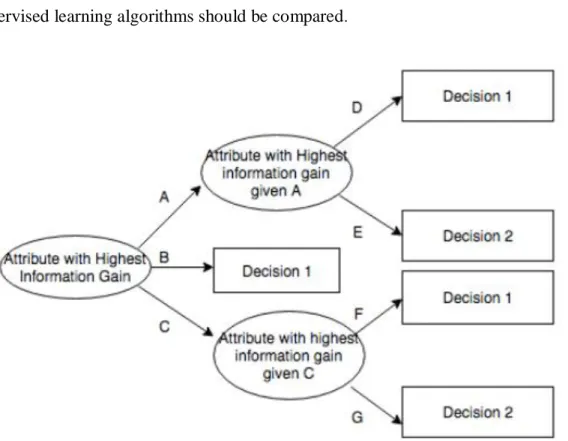
A decision tree models can be represented in a is a tree-like chart structure, where each internal node represents a test on an attribute, each branch denotes an outcome of the test, and each leaf node holds an output value The top node in a tree is called the root node (Swain and Hauska, 1977).
As the construction of a basic decision tree classifier does not require any domain knowledge or parameter setting, they can be used for exploratory analysis of the data. However, in order to build the most accurate model used for prediction making some manipulation is always required (Han, Pei and Kamber, 2011).
Three main algorithms used in Decision Trees are ID3, C4.5, and CART. ID3 (Iterative Dichotomiser 3) and C4.5 were developed and described by Quinlan (1986 and 1993), and expanded in earlier work by Hunt et.al. (1966). Both algorithms use Entropy or Information Gain to decide on the attribute selection for the split. Han,
17
Pei and Kamber (2011) identify C4.5 as the benchmark algorithm to which other supervised learning algorithms should be compared.
Figure 2.4 Potential ID3-generated Decision Tree2
The last algorithm - CART (Classification and Regression Trees) although developed independently in 1984, follows similar approach by using Gini Impurity and Information Gain for the process of learning decision trees (Breiman, 2017).
Additionally, all algorithms: ID3, C4.5, and CART adopt a greedy approach, where the trees are constructed in a top-down manner. However, while the ID3 and C4.5 allow for multi-way splits (where two or more branches are grown from a node), CART Gini Index selection measure, enforces the binary tree production (Han, Pei and Kamber, 2011).
2 Wikivisually.com (2017) Incremental decision tree. Retrieved from:
18 2.2.3. Neura l Net wo rks
Neural networks were originally studied by psychologists and neurobiologists, including previously discussed work by Rosenblatt (1961).
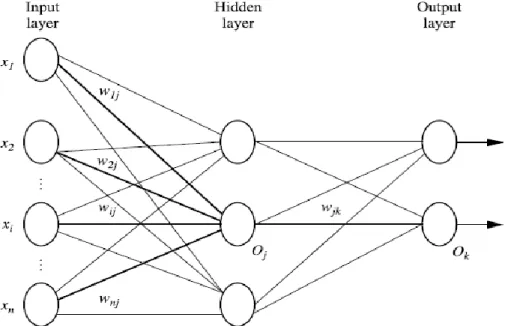
The model of neural network can be described as a set of connected input and output units, where each connection has an associated weight. In each Neural Network one Input and one Output layer exist, while the amount of hidden layers can vary. The outputs of any hidden layer can be inputs to another hidden layer or the output layer. During the learning phase, the weights are adjusted using back-propagation algorithm until the best accuracy of prediction is achieved in production (Han, Pei and Kamber, 2011). The multilayer neural network presented in Figure 2.3 is an example of two-layered network. Only the output and hidden layer units are included in the count, while the input layer is excluded.
Figure 2.5 Two-layer Neural Network (Han, Pei and Kamber, 2011)
2.2.4. Mu lt ic la s s C la s s ifica t io n Pro ble m
Multiclass classification problem is one which involves classification of instances into one of multiple possible target classes. As the multiclass learning problem is very often related to a real-life scenarios, various approaches were developed, which allow for the
19
classification. The most common approach is reduction to binary, which includes one-versus-one and one-versus-all approaches (Han, Pei and Kamber, 2011), however extension from binary is a new approach which can be taken (Aly, 2005).
One-versus-one approach involves training of K (K − 1) / 2 binary classifier, where K is the amount of classes. Each binary classifier is built using a pair of classes from the original data, and then final prediction is made using combined output from multiple binary classifiers The one-versus-all approach involves creation and training of models per binary class, where one original class is reduced as positive, while all the other as negatives. (Rocha and Goldenstein, 2014). Both these reduction techniques were also analysed in detail by Dietterich and Bakiri (1995), as well as Allwein, Schapire and Singer (2000), while their limitations were presented in the research by Daniely et al. (2011) and Daniely, Sabato & Shwartz (2012).
As mentioned earlier, it is possible to make predictions for the multiclass classification problem by extending some algorithms from the binary classification to multiclass. Research by Aly (2005) provides an evidence of successful implementation of this approach for both Decision Trees and Neural Networks. The research argues that both algorithms can naturally handle both binary or multiclass classification problems. In each case Decision Trees the leaf nodes can simply refer to any of the K classes to be predicted. At the same time, MultiLayer Neural Networks evolve from having just one neuron in the output layer, with binary output, to having K binary neurons (Aly, 2005). As both algorithms of interest of this research, Decision Trees and Neural Networks, can be applied using extensions from binary approach for multiclass prediction, this strategy will be selected for the experiment purposes.
2.3. Machine Learning in SWB Research
Some attempts were made to apply Machine Learning models on the subjective well-being related data. Conry, et.al. (2011) presents the results of exploration of self-rated health and quality of life data. The research is also concerned with the Irish population, however the data used was obtained from SLÁN 2007 data (national Survey of Lifestyle, Attitudes and Nutrition). The authors used clustering techniques to explore
20
associations between the data and reported better self – rated quality of life for the respondents with the healthiest habits (i.e. non-smokers, which exercise more). The paper presented a successful implementation of Unsupervised Machine Learning and the associations present between different clusters and mental health.
However, more significant findings are reported by Jaques, et.al. (2016) where the Multi-Task-Learning (MTL) models are compared (while predicting next-day health, stress, and happiness level). Three models were compared, including Multi-Task Multi-Kernel Learning, Hierarchical Bayes with Dirichlet Process Priors and Neural Networks. This research presents that increasing number of layers improves overall performance of Neural Networks, and allows the model to outperform the other two listed, which supports the selection of the model for the experiment conducted as a part of this research.
2.3.1. Gaps in R es earc h
Review of existing literature provides significant evidence and analysis of correlations and causality between individual independent variables (or even selective groups of individual independent variables) and the target variable, which resulted from the vast research performed by economists, psychologist and sociologists However, the amount of research related to application of Machine Learning in the concept research is scarce.
The research done by Jaques, et.al.(2016) is the only one considering a comparison of accuracy of prediction of target variable using Machine Learning classification techniques. However, this research focus is on Multi-Task-Learning models. Therefore, it would be of interest to compare two models: Decision Tree, using C4.5, which was identified as the benchmark algorithm to which other supervised learning algorithms should be compared (Han, Pei and Kamberm, 2011), and a Neural Networks, which Jaques et.al. (2016) found to have the highest predictive power. Thus, this research will determine effectiveness and performance of these two models in prediction of SWB.
21
3.
DESIGN AND METHODOLOGY
A significant amount of the research related to SWB, and its determinants, is based upon survey answers, where one or more questions ask respondents about their life satisfaction and/or happiness. Additionally, supporting questions are asked regarding income, age, employment, marital status, etc., so that the correlation and, ideally, causality of the various components on SWB can be determined. Statistical methods and tests are usually employed to determine those relationships (Benjamin, et. al., 2014; Gerdtham and Johannesson, 2001; Stoica, 2015; Dolan & Metcalfe, 2012). This chapter describes the general strategy in which research experiment, also based upon survey answers, however involving application of Machine Learning algorithms, will be undertaken. A set of steps and methods to be used is identified here, including data pre-processing and modelling steps, as well as description of evaluation methods and multiple software applications used for the purpose of conducting different stages of the experiment.
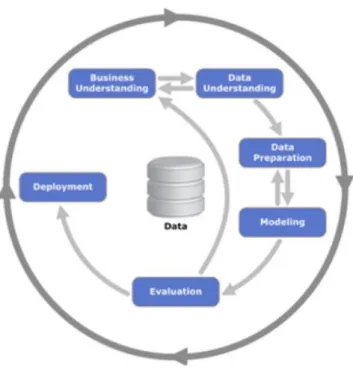
Figure 3.1 Phases of the CRISP-DM reference model (Chapman, et. al. 2000)
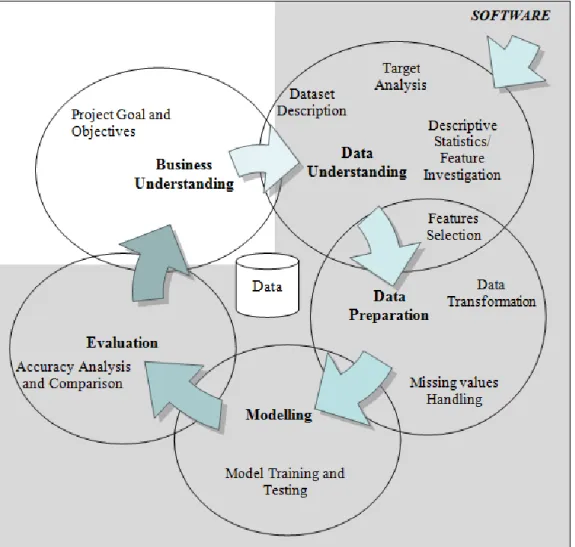
Individual steps of experiment plan were created by adapting The Cross Industry Standard Process for Data Mining (CRISP - DM) (Chapman, et. al. 2000). The standard approach of CRISP-DM, presented in Figure 3.1, was modified to meet the
22
need of both this paper and the experiment itself. As the idea behind the approach is that the sequence of the individual phases is not fixed and that going back and forth between them is not only advised, but necessary. The experiment was designed in such a way to benefit the most from this guideline. Figure 3.2 presents the steps of the experiment design, including its sub-tasks. The main phases of Business Understanding, Data Understanding, Data Preparation, Modelling and Evaluation are shared between the two figures; however deployment was removed from the modified approach chosen for this experiment. The approach taken allows for the outcome of each phase sub-task to determine which phase, or phase sub-task, should be performed next. Individual sections of this chapter correspond to the phases, and their subtasks, listed in Figure 3.2 and will provide details regarding each phase of the experiment.
23
3.1. Business Understanding
The purpose of the research is to build predictive models based on historical data collected as a part of Healthy Ireland Survey and compare them. The main goal is to test the hypothesis that, while different classifying algorithms can be used for the prediction of subjective well-being, a statistically significant difference exists in the value of prediction accuracy between the models. Thus, an experiment must be conducted. In order to layout methodology accurately it is crucial to begin with highlighting the research question, which then allow for listing research objectives associated with it.
The main research question of this project can be defined as: Which of the classifiers: Decision Trees or Neural Networks, is more accurate in predicting subjective ‘well-being’ with the use of specified economic, social and health related factors?
Thus, following hypothesis can be considered to allow for addressing above research question: H0: There is a statistically significant difference in the value of prediction accuracy of the subjective well –being between Neural Networks and Decision Trees with p-value <0.01.
3.2. Data Understanding
This section presents the data understanding phase steps, which enable to determine the quality of the data, and select appropriate strategies to be implemented in the data preparation phase.
3.2.1. Dat aset Descr ipt io n
The data used for the research was obtained from The Irish Social Science Data Archive (ISSDA) and contains 7539 responses to the Healthy Ireland Survey 20153, which was approved by the Research Ethics Committee at the Royal College of Physicians of Ireland (Department of Health, 2016). The survey was carried out
24
between late 2015 and early 2016, while a report of its findings was published in October 2016 (Ipsos, 2016).
A representative sample of the Irish population aged 15 and over was achieved by implementation of a multi-stage probability sampling process, in which interviewers were asked to visit pre-selected addresses and then interview a randomly selected individual living under it. The use of this approach allowed every member of the defined population to have the same calculable chance of being included (Department of Health, 2016).
A full survey included questions regarding participants‟ demographics, education, employment and marital status, but focused mainly on areas such as: general and mental health, and lifestyle factors such as smoking and alcohol consumption, physical activity, nutrition and diet. Additionally, participants interviewed for the survey were asked to complete physical measurement module, in which one‟s height, weight and waist circumference were recorded. This module was completed by 6,142 respondents (81% of overall study population) (Ipsos, 2016).
3.2.2. Target Var ia ble I nvest igat io n
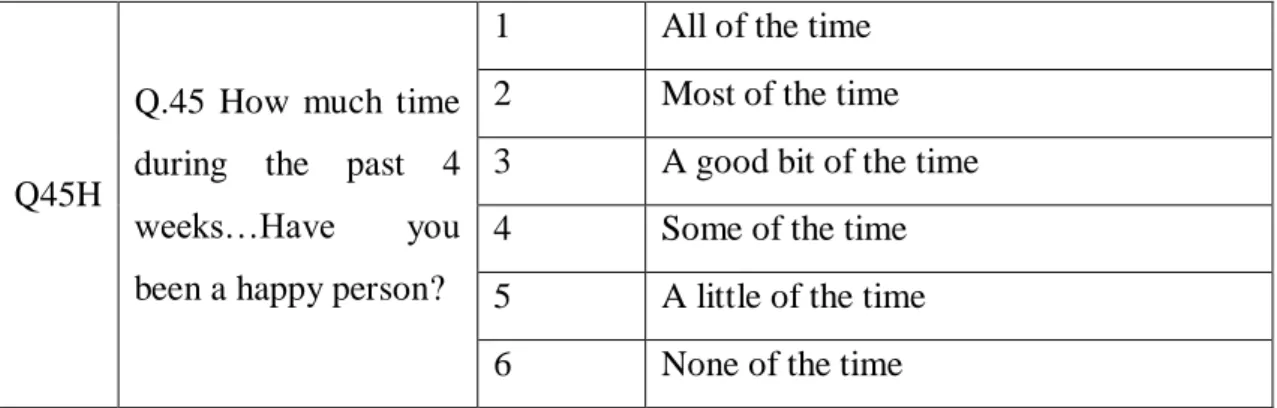
The target variable selected for the experiment is a multiclass variable, which involves presence of multiple possible target classes Table 3.1 below presents the exact question and answers from the survey. The values below are stored in the dataset in a coded format represented by numeric values in the range from 1 to 6.
Q45H
Q.45 How much time during the past 4 weeks…Have you been a happy person?
1 All of the time 2 Most of the time 3 A good bit of the time 4 Some of the time 5 A little of the time 6 None of the time
Table 3.1 Target variable question and answers details
Target variable investigation to be performed should include statistical analysis, with the main focus on the distribution of the individual classes within the target. As the
25
variable is a multiclass one, it is possible that an imbalance may exist between individual classes, which would have to be addressed in the data preparation phase.
3.2.3. Fe at ure Inve st igat io n
All independent variables are continuous and stored in the numeric format. Thus, descriptive statistics, such us mean, skewness and kurtosis, will be produced and analysis will be performed in order to verify data distribution, and in effect see if the data normalisation and/or standardisation is required.
Additionally, as the data is secondary and was already used for statistical purposes, no format issues or duplicate values are expected. However, as the data comes from survey, it is possible that some of the participants refused to answer specific questions. Thus, missing values analysis should be performed in order to identify any variables with this issue and select appropriate strategy for addressing it.
3.2.4. Fe at ure se lect io n
The selection of attributes is critically important for successful and meaningful modelling of the problem. Guyon and Elisseeff (2003), and Karegowda et.al. (2010) argue that inclusion of the redundant attributes not only may be misleading to the algorithms, but can also result in model over-fitting, which in effect may reduce the predictive power of the models built and cripple their overall accuracy. Thus, in the data preparation phase any redundant and/or irrelevant attributes from the dataset will be removed. The selection will be made using output from two feature selection methods: Information Gain ratio and Correlation based feature selection (Frank et.al. 2009). Both methods are provided in WEKA Explorer and use the “ranker” search method, which sorts features according to their evaluation. (Karegowda et.al. 2010). The first one relies on calculation of the information gain (or entropy) for each feature for the output variable. The values here are always in the range from 0 to 1, where 0 means no information, and 1 means maximum information. The attributes with the highest information gain value are then selected. The second method uses Pearson‟s correlation coefficient. After the correlation between each attribute and the target variable is calculated, only those attributes with the highest positive or negative
26
correlation are kept and those with a lowest correlation (value close to 0) are dropped. (Frank et.al., 2009)
3.3. Data preparation
This section describes any tasks related to the data preparation phase, which includes missing values handling, feature selection, and data transformation like imbalance removal and normalisation.
3.3.1. M is s ing V a lue s Ha nd ling
Any missing values identified in the feature investigation step will be addressed, as it was proved that the existence of missing values affects the performance of some Machine Learning classifiers (Pelckmans, Brabanter., Suykens, and Moor, 2005). The strategy for replacing missing values will be determined based on the results percentage missing. All variables with the count of missing >40% of overall count of observations will be removed. This threshold was selected based on the research done by Silipo, Adae and Hart (2015), where it proved to lead to the best accuracy achieved by the Machine Learning models. For the remaining variables, if they are selected as features for the model building phase, MCAR test will be performed, and the decision about an imputation of missing values will be made based on it.
3.3.2. Fe at ure Se le ct io n
As previously discussed in the Data Preparation section of this chapter, two techniques provided by WEKA will be used in order to perform Feature Selection: Correlation Based Feature Selection and Information Gain Based Feature Selection (Frank et.al., 2009). The variable list produced by both will be compared and all variables present on either of the list will be included in the final clean dataset.
3.3.3. I mba la nc e reduct io n
As previously discussed, the target is a multiclass variable, thu it is possible that an imbalance may exist between individual classes. Papers by Weiss and Provost (2001), and Chawla, Japkowicz, and Kotcz (2004), and He and Garcia (2009) document that
27
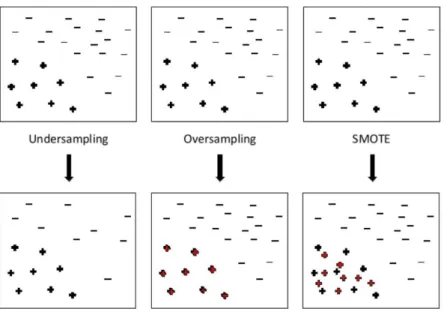
for multiple classifiers, imbalance removal leads to overall improvement in classification performance. The sampling methods, which may be used for resolving imbalanced dataset issue, include two main random sampling techniques: over-sampling and under-over-sampling, as well as SMOTE. All of those techniques are presented in Figure 3.3 (Pozzolo, 2016).
Figure 3.3 Imbalance removal techniques (Pozzolo, 2016)
Batista, et.al. (2005) defined Random Undersampling as a method, which aims to balance out target class distribution by random elimination of observations from the majority class. Respectively, Random Oversampling was defined as a method, which aims to balance out distribution of target class via random replication of instances in the minority class examples. Drawbacks of both techniques were also described. For Random Undersampling, it is that the use of this method can lead to deletion of potentially useful data, which could be significant for training of a model. For Random Oversampling, it is that the method can increase the likelihood of model over-fitting, as all the new instances created are always exact copies of the existing observations in the minority class. Therefore, the predictions made by the model constructed, are not really accurate, as they are made for the same one replicated instance. Additionally, all the previously mentioned papers (Weiss and Provost (2001), Chawla, Japkowicz, and Kotcz (2004), He and Garcia (2009) and Batista, et.al. (2005)) claim SMOTE (Synthetic Minority Over-Sampling) Technique offers an alternative to the two previously discussed. SMOTE is also an over-sampling method; however the main
28
idea behind it is to create new minority class instances by interpolating between several examples from original minority class data. Thus, the method doesn‟t risk information loss, or over-fitting of the models, and will be the one used for imbalance reduction, if required.
3.3.4. No rma lis at io n
The final task in the data pre-processing phase will be normalisation, which was proven to improve the accuracy and efficiency of Machine Learning algorithms such as Neural Networks, K-nn and rule based learners (Shalabi and Shaaban, 2006). Most common data normalisation methods include:
− Min-max normalisation - a technique, which normalises the data through application of a linear transformation and scaling it to the range of 0 to 1. The computation formula for Min-max normalisation is defined as:
v’ = (v-min)/(max-min) * (newmax-newmin) + newmin
where:
v = old variable
v‟ = transformed variable.
newmin = minimum of the normalised dataset newmax = maximum of the normalised dataset
− Z-score normalisation - is a technique, in which the values are normalised based on the mean and standard deviation of an attribute. Thus, normalisation formula for value v into v‟ is:
v’ = ( ( v – Ɩ ) / ıA )
where:
Ɩ = mean ıA = standard
− Decimal scaling – this technique normalises the data by moving the decimal point of values, which depends on the maximum absolute value of an attribute. A normalised value v‟ is therefore produced by computing:
v’ = ( v / 10j )
29
j = smallest integer such that Max(|v‟|) < 1.
The experimental results (Shalabi and Shaaban, 2006) suggest choosing the min-max normalisation method, as it proved to have the highest positive effect on the performance of all the machine learning algorithms tested, including Neural Networks and Decision Trees, which are in scope of this research study.
3.4. Modelling
The purpose of this research is to investigate and analyse in detail application of two Supervised Machine Learning techniques: Decision Trees and Neural Networks, and to compare the accuracy of predictions made by each of these models.
As previously discussed, multiple Supervised Machine Learning techniques exist, however the amount of the previous research on application of Supervised Machine Learning is scarce. Therefore, Decision Trees were selected for the purposes of this research, as they are the most fundamental machine learning models, which are able to provide interpretability and information about the importance of individual features. Additionally, Han, Pei and Kamber (2011) identify C4.5 used by the Decision Trees as the benchmark algorithm to which all other supervised machine learning algorithms should be compared. At the same time, Neural Networks were proven to have high predictive power (Jaques et.al. 2016), especially with multiclass categorisation (Aly, 2005).
Before moving into model comparison and evaluation phase each of the above models will be tuned and adjusted for the best performance. This step will be performed using full dataset split into 70% for training and 30% for validation parts. The best model will be chosen based on The Misclassification Rate, Average Squared Error and ROC index values produced.
3.5. Evaluation
This section of the reports presents the steps planned for the evaluation phase of the experiment, which include: the comparison of the model performance and the testing for statistical significance leading to hypothesis acceptance and/or rejection.
30 3.5.1. Mo de l p er fo r ma nce co mpar iso n
Model evaluation will be performed using the results gathered during the k-fold cross validation step, with k = 10 (Refaeilzadeh, Tang and Liu, 2009). As the purpose of this research is to evaluate and compare the accuracy of two predictive models, stratified k-fold cross validation will be used for the individual models validation (Moreno-Torres, Sáez and Herrera, 2012). K-fold cross validation allows to test the predictive accuracy of the model using training data only and without biasing the prediction (Bengio and Grandvalet, 2004). It achieves this through division of data into K equal subsets followed by iterative creation and testing of predictive models. Each time one of the subsets is withheld and used for the testing of the model, while the remaining folds are used for training (Refaeilzadeh, Tang and Liu, 2009). This means that the use of 10-fold cross validations automatically enforces 90%/10% split in Training and Test Sets respectively. The average results from the k-folds will be then taken to produce single overall result. Additionally, a stratified version of this method was selected, as it maintains the proportion of classes present in the target at the whole population level in all the individual folds created (Moreno-Torres, Sáez and Herrera, 2012). Figure 3.4 presents schematic representation of 10-fold cross validation.
Figure 3.4 Schematic representation of 10-fold cross validation
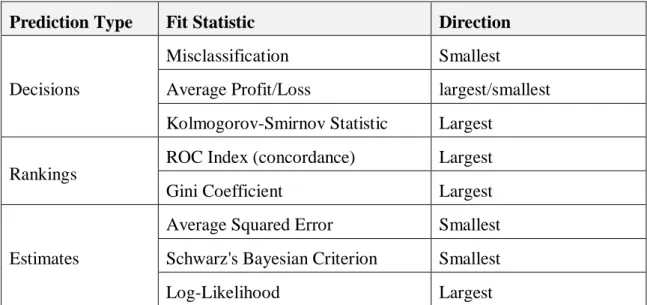
The fit statistics outputs produced in the cross-validation process include numerous metrics. The choice of the fit statistic to be used depends from the prediction of interest. In overall all the metrics can be grouped as follows: