Effect of OATP-binding on the prediction of biliary excretion
Article (Accepted Version)
http://sro.sussex.ac.uk
Sharifi, Mohsen and Ghafourian, Taravat (2017) Effect of OATP-binding on the prediction ofbiliary excretion. Xenobiotica, 47 (7). pp. 614-631. ISSN 0049-8254
This version is available from Sussex Research Online: http://sro.sussex.ac.uk/64120/
This document is made available in accordance with publisher policies and may differ from the published version or from the version of record. If you wish to cite this item you are advised to consult the publisher’s version. Please see the URL above for details on accessing the published version.
Copyright and reuse:
Sussex Research Online is a digital repository of the research output of the University.
Copyright and all moral rights to the version of the paper presented here belong to the individual author(s) and/or other copyright owners. To the extent reasonable and practicable, the material made available in SRO has been checked for eligibility before being made available.
Copies of full text items generally can be reproduced, displayed or performed and given to third parties in any format or medium for personal research or study, educational, or not-for-profit purposes without prior permission or charge, provided that the authors, title and full bibliographic details are credited, a hyperlink and/or URL is given for the original metadata page and the content is not changed in any way.
Effect of OATP-binding on the prediction of biliary excretion
Mohsen Sharifi1, 2, *,Taravat Ghafourian3
1
Medway School of Pharmacy, Universities of Kent and Greenwich, Chatham, Kent ME4 4TB, UK
2
Division of Systems Biology, National Center for Toxicological Research, US Food and Drug Administration, Jefferson, AR
3
School of Life Sciences, JMS 4B15, University of Sussex, Falmer, Brighton BN1 9QG
* Corresponding author: Mohsen Sharifi, Ph.D.
US-FDA National Center for Toxicological Research Division of Systems Biology, HFT-233, 3900 NCTR Rd Jefferson, AR 72079, USA
Phone: +1 (870)543-7304, Fax: +1 (870)543-7686
Emails: [email protected], [email protected]
The authors have declared that no conflict of interest exists.
2
Abstract
Biliary excretion of compounds is dependant on several transporter proteins for the active uptake of compounds from the blood into the hepatocytes. OATPs are some of most abundant transporter proteins in the sinusoidal membrane and have been shown to have substrate specificity similar to the structural characteristics of the cholephilic compounds. Therefore, in this study, we sought to use measures of OATP binding as predictors of biliary excretion in conjunction with molecular descriptors in a quantitative structure-activity relationship (QSAR) study. Percentage inhibitions of three subtypes of OATP were used as surrogate indicators of OATP substrates.
Several statistical modelling techniques were incorporated including classification and regression trees, boosted trees, random forest and multivariate adaptive regression splines (MARS) in order to first develop QSARs for the prediction of OATP inhibition of compounds. The predicted OATP percentage inhibition using selected models were then used as features of the QSAR models for the prediction of biliary excretion of compounds in rat. The results indicated that incorporation of predicted OATP inhibition improves accuracy of biliary excretion models. The best result was obtained from a simple regression tree that used predicted OATP1B1 percentage inhibition at the root node of the tree.
3
1. Introduction
Liver is an important detoxifier organ that has a key role in the elimination of compounds both through metabolism and also excretion of bile. The most important components of the bile are conjugated bilirubin, phospholipids and lecithin, IgA antibodies, cholesterol and bile salts such as cholic acid and chenodeoxycholic acid. Bile acids are some of the most important substances in bile that are vital for efficient digestion and emulsification of lipids. Production of bile depends on the absorption of specific compounds from the blood through the sinusoidal membrane of the hepatocytes and secretion of these through the canalicular (apical) membrane of hepatocytes into the biliary canaliculus. Biliary excretion is an important route for the elimination of many drugs and/or their metabolites (Rollins and Klaassen, 1979). Since a big part of intact drug molecules and their metabolites are excreted through bile (Niemi et al., 2011), during pharmacokinetic studies, evaluation of biliary excretion of drugs is essential as it can impact on the drug half-life and drug-drug interactions, and may complicate the pharmacokinetics due to the possibility of enterohepatic circulation.
Excretion of bile, is dependent on various influx and efflux transporter proteins to uptake the compounds from the blood and to excrete them into the bile canaliculus. In the past ten years, there has been an enormous increase in the literature regarding the role of membrane transporters governing drug pharmacokinetics and response (Shugarts and Benet, 2009; Kalliokoski and Niemi, 2009). Transporters are known to be partially responsible for drug concentration ratios in plasma and tissues, thus efficacy and toxicity of drugs (Giacomini et al., 2010). In terms of biliary excretion, several uptake and efflux membrane transporters are involved (Giacomini et al., 2010).
4
Due to the mechanism of biliary excretion that involves several different types of transport proteins for active uptake and efflux of compounds, the structural requirements for significant elimination of compounds through bile is complicated. In general, large molecular weight requirement is the most well-known molecular attribute associated with biliary excretion, although the actual molecular weight threshold for effective biliary excretion has been debated (Sharifi and Ghafourian, 2014; Yang et al., 2009; Varma et al., 2012; Luo et al., 2010). In a related context, several structural fragments have been implicated in high biliary excretion. Examples of such fragments include glucuronide and sulphate groups that may be added during phase II metabolism and then the large conjugated metabolites that are mainly hydrophilic may be readily excreted through bile (Kullak-Ublick et al., 2000; Sharifi and Ghafourian, 2014). Carboxylic acid groups (COOH) have also been linked with high biliary excretion in a recent quantitative structure activity relationship study (QSAR) (Luo et al., 2010).
Quantitative prediction of biliary excretion of compounds has been investigated in several recent publications employing various QSAR techniques (Chen et al 2010, Luo et al., 2010; Yang et al., 2009, Sharifi and Ghafourian, 2014; Hosey et al., 2014). It is believed that the development of a reliable structure-activity model for the prediction of cholephilic compounds is not an easy task (Gandhi and Morris, 2012; Hosey et al., 2014). One explanation for the complexity of structure-activity rationalisation and quantitative prediction of biliary excretion may be the different structural requirements for different transport proteins that are involved in the biliary excretion. For example, the uptake transporters, organic anion-transporting polypeptides (OATPs) as well as members of organic anion and cation transporters (OATs and OCTs) and organic cation/carnitine transporter (OCTN) superfamily are all major contributors to the uptake of compounds into the hepatocytes (Giacomini et al., 2010). These uptake proteins have specific and sometimes overlapping
5
substrate structures, allowing the uptake of many different compound structures. Once the compound is in the hepatocyte, there are different metabolising enzymes present in the hepatocytes and several different efflux proteins operating in the apical membrane which also contribute to the level of biliary excretion of specific compounds. While products of the multidrug resistance gene family (MDR), namely bile salt export pumps, Bsep (rat) and BSEP (human), transport monovalent bile salts (Rollins and Klaassen, 1979), excretion of non-bile salt organic anions and divalent sulphate or glucuronide bile salts is carried mainly by the multidrug resistance protein 2 (MRP2) and P-glycoprotein (Muller and Jansen, 1997).
A recent investigation by Varma et al (2012) showed that the physicochemical space of compounds with rat biliary excretion significantly overlaps with the compounds that are OATP substrates. This is despite the involvement of several other influx and efflux proteins in rat biliary excretion. OATP is a family of membrane transporters that mediate the cellular uptake of several endogenous substrates and drugs. The importance of OATPs in hepatic excretion of several drugs has been shown by different studies (Cvetkovic et al., 1999; Kim, 2003; Mikkaichi et al., 2004; Smith et al., 2005). Out of 11 different members of OATP family, the uptake transporters, OATP1B1, OATP1B3, and OATP2B1 are highly expressed in hepatocytes and are known to have significant roles in biliary excretion of compounds (Kalliokoski and Niemi, 2009). In particular, OATP1B1 is a liver specific transporter that has a higher expression level than the other two proteins in the sinusoidal membrane of hepatocytes (Tu et al., 2013).
Despite the title, OATP substrates are not limited to organic anions, but also include cations as well as neutral and zwitterionic compounds (Niemi et al., 2011). The three hepatic OATPs have substantial overlapping substrate specificities and mediate the sodium ion co-transport of various organic agents including organic dyes, bile salts, steroid conjugates and thyroid
6
hormones. However, OATP1B3 is also able to transport oligopeptide hormones such as cholecystokinin 8 (Ismair et al., 2001) and digoxin (Kullak-Ublick et al., 2001). Moreover, OATP2B1 can also transport estrone-3-sulfate, but not bile salts (Kullak-Ublick et al., 2001). The importance of OATP1B1 and OATP1B3 in hepatic transport has been explained by recent studies by Fenner and co-workers indicating that OATP1B-mediated transport can be the rate-determining step of hepatobiliary drug clearance (Fenner et al., 2012).
The aim of this investigation was to incorporate information from OATP binding in order to improve accuracy of the predicted biliary excretion using a data-driven approach. This work was carried in two stages: 1) development of predictive models for OATP inhibition; and 2) Using predicted OATP effects from the models obtained in phase 1 (along with molecular descriptors) for the development of models for the prediction of biliary excretion. This workflow has been summarised in Figure 1. OATP models consisted of both regression type (continuous) models and classification type models. Unfortunately, despite the wide distribution and important implications of OATP transporter family, there is a shortage of sufficient high quality quantitative data on OATP substrates and non substrates for QSAR studies. For example, in the study by Varma et al (2012), the chemical space of OATP substrates was compared with that of cholephilic compounds and no negative data (non-substrate compounds) were used in the investigation. The lack of negative data, such as a list of known non-substrate compounds, limits the possibility of quantitative (classification or regression type) investigations. We employed a relatively large dataset of OATP inhibition data recently published by Karlgren and co-workers (2012a) measured using high-throughput methods. The measured values are percentage inhibition of a probe substrate’s uptake by 225 compounds using HEK293 cells transfected with OATP1B1, OATP1B3 or OATP2B1. It is noted that a single-point inhibition measure (percentage inhibition) that uses only one inhibitor concentration is not as reliable as IC50 for measuring the inhibition activity.
7
Moreover, direct kinetic measures for the substrates (Michaelis constant, Km) would have been the ideal parameter for this investigation. Despite this, considering that most enzyme inhibitors are usually also the substrates of the same enzyme (competitive inhibition), this percentage inhibition dataset was used in this investigation. The single point inhibition assays have proven useful in the past for fast screening of compound activity and selectivity. An example is comparable accuracy of models based on single point CYP inhibition measures, with those built from IC50 data (Carlson and Fisher, 2008). The resulting models, based on
QSAR methodology, can help evaluate the roles of an important liver transporter, Organic Anion-Transporting Polypeptides (OATP), in the biliary excretion of drugs.
2. Methods
This work consists of QSAR development in two steps: 1) QSAR for the ligands of OATP transporter subtypes, OATP1B1, OATP1B3 and OATP2B1; 2) QSAR for the prediction of percentage excretion of intact compounds through bile. The latter QSAR models incorporate, as model features, the predicted OATP effects using QSARs generated in step 1 in addition to the molecular descriptors.
2.1. Datasets
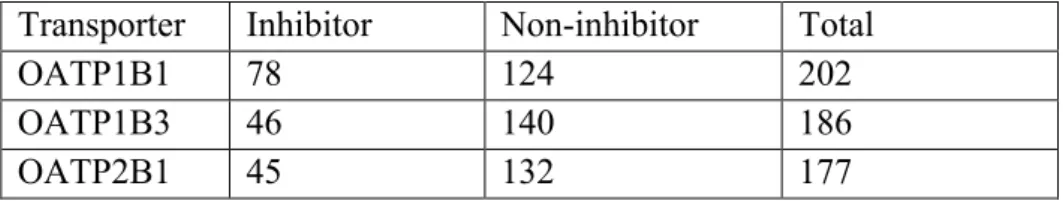
The study used two datasets: 1) percentage of dose excreted intact into bile in rat (BE%) for 217 compounds (Yang el al., 2009, Sharifi and Ghafourian, 2014); 2) percentage inhibition of OATP transporters, OATP1B1, OATP1B3 and OATP2B1 (Karlgren et al., 2012a). Table 1 gives a summary of the datasets.
8 Biliary excretion
The recently published biliary excretion dataset (Sharifi and Ghafourian, 2014) was used in this investigation. The dataset is mainly composed of the data originally collated by Yang et al (Yang el al., 2009,) and consists of in vivo biliary excretion of 217 compounds in rat expressed as the percentage of dose excreted as the intact parent compound after iv or intraperitoneal administration of the compound (BE%). The compounds are from different chemical classes such as bile acids, statins, dyes and cephalosporins, macrolide antibiotics, quinolone antibiotics, NSAIDs, thrombin inhibitors, analgesics, anti-cancer drugs such as doxorubicin, folates, peptides, anti-HIV agents, quaternary ammoniums, sulphanilamide and arylaminosulphonic acids. Molecular weights of the biliary excretion compounds were between 94 and 1,255 Da.
OATP inhibitors
The OATP dataset consisted of 225 compounds collated, or experimentally determined, by Karlgren and co-workers (2012a). The OATP subfamilies, OATP1B1, OATP1B3 and OATP2B1 were included in the dataset. A total of 142 compounds in this dataset was from an earlier investigation (Karlgren et al 2012b), which was then expanded to include compounds known to interact with OATPs or CYP enzymes (Karlgren et al., 2012a). The compounds were from the chemical space of oral drugs (Karlgren et al., 2012a). The experimental measurements were performed using the human embryotic kidney 293 (HEK293) cells stably transfected with OATP1B1, OATP1B3 or OATP2B1. In the screening experiments to measure interaction of the 225 compounds with each individual OATP, a concentration of 20 µM of the compounds was used. The substrates used in the inhibition studies were estradiol-17β-glucuronide for OATP1B1 and OATP1B3, and estrone-3-sulfate for OATP2B1. The
9
substrate concentration was 0.52 µM in the inhibition of OATP1B1 mediated estradiol-17β
-glucuronide uptake. In the inhibition of OATP1B3 mediated estradiol-17β-glucuronide
uptake, the substrate concentration was 1.04 µM and in the inhibition of OATP2B1 mediated estrone-3-sulfate uptake, the substrate concentration was 1.02 µM. The dataset included 43% neutral compounds, 29% negatively charged, 22% positively charged and 6% zwitterionic compounds at pH 7.4 (Karlgren et al., 2012a).
For development of QSAR models for OATP interaction, both classification and prediction (regression based) methods were used. The continuous (numerical) percentage inhibition data were used for regression based analyses. For classification methods, compounds were considered as inhibitors if they significantly decreased the uptake of the substrate by at least 50%. In this case, 78 compounds (out of 225 compounds) were OATP1B1 inhibitors, while 46 and 45 compounds (out of 225) were OATP1B3 and OATP2B1 inhibitors, respectively (see Table 2). In the dataset, a few compounds stimulated OATP mediated transporter (instead of inhibition). Clotrimazole, fendiline, progesterone and testosterone are the example of stimulators (Karlgren et al., 2012a). In this investigation all such compounds were excluded from the analysis in classification studies.
2.2. Calculation of Molecular Descriptors
Molecular descriptors are used as the model features in QSAR studies. In this investigation, molecular descriptors were calculated for the compounds in both biliary excretion and OATP inhibitor datasets using ACD Labs/LogD Suite version 12 (Advanced Chemistry Development, Inc.), MOE version 2012.10 (Chemical Computing Group Inc. Montreal, Canada) and Symyx QSAR software (Accelryl Inc.). The fractions of compounds that is ionised at pH 7.4 as acid (FiA), as base (FiB), or (for zwitterionic compounds) as acid and
10
base (FiAB), and the fraction unionised (Fu) were calculated from the lowest acidic and the highest basic pKa values as described previously (Ghafourian et al., 2006).
2.3. Chemical space of biliary excretion and OATP inhibitor datasets
Principle component analysis was carried using all molecular descriptors for compounds in biliary excretion dataset and OATP inhibitors. The plot of the first and the second principle components (scores plot) was used to visualise the chemical spaces of the datasets in relation to each other.
2.4. Development and Validation of QSAR Models
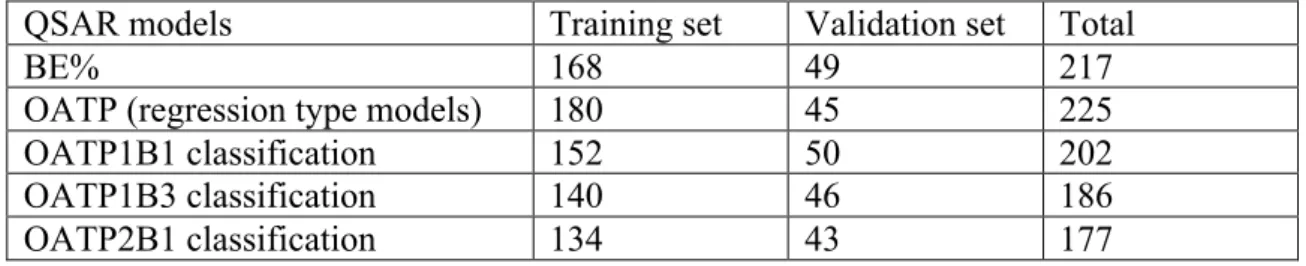
In this work, various data analytical techniques were used for the development of QSAR models. Datasets of compounds were first divided into training and external validation sets for the validation of the models. In order for the training and test sets to have a similar range of biological activities, compounds in each dataset were ordered according to the relevant response variable and from each group of four compounds one was allocated into the external validation set. The number of compounds in the training and validation sets for the biliary excretion and OATP datasets is presented in Table 3. Note that in the classification models for OATP binding, compounds with negative percentage inhibition values were omitted from the analyses which resulted in less than 225 compounds in total for training and validation of the models (see Table 3). In addition to the external validation of the models, for the analytical methods that required parameter optimization, a fraction of compounds in the training set was randomly assigned into internal validation set, or alternatively, 10-fold cross validation was used.
11
STATISTICA Data Miner version 11 was used for the statistical analysis. Statistical methods consisted of decision tree methods and ensemble methods including Classification and Regression Tree (CART), Chi-square Automatic Interaction Detector (CHAID), Boosted Trees (BT) and Random Forest (RF). The predictors were selected by the embedded feature selection methods in CART, CHAID, BT and RF from all the molecular descriptors and other features available.
For OATP dataset, in the regression type analyses, percentage OATP inhibitions were the dependent variables and molecular descriptors were the independent variables (model features). In the classification tasks, OATP class (inhibitor or non-inhibitor) was the dependent variable and molecular descriptors were the model features.
For biliary excretion models, logarithm of percentage of dose excreted as the parent compound intact through the bile (Log BE%) was the dependent variable. In addition to molecular descriptors, the predicted OATP percentage inhibition or OATP (inhibitor/non-inhibitor) class by the selected QSAR models were used as the model features and were subjected to feature selection.
To assess the accuracy of predictions by QSAR models in prediction (regression based) models, the mean absolute error (MAE) was calculated according to equation 1 below.
MAE = Eq. 1.
In equation 1 ‘observed’ and ‘predicted’ refer to the observed or predicted percentage inhibition values of OATPs in OATP models and the log percentage of intact dose excreted into the bile from in vivo studies (Log BE%) in biliary excretion models. N is the number of compounds. In the internal validation (cross validation) of the models, the risk estimate is calculated as the proportion of residual variance incorrectly estimated by the model and
12
standard error measures the error of the prediction in the model. Moreover, the performance of each classification model was measured using the performance measures, sensitivity (SE), specificity (SP) and overall accuracy (equations 2-4). Sensitivity is proportion of compounds correctly predicted to be positive relative to all the compounds experimentally determined to be positive. Specificity is proportion of compounds correctly predicted to be negative relative to all the compounds experimentally determined to be negative. Overall accuracy here was defined as the product of specificity and sensitivity.
Sensitivity = TP/ (TP + FN) Eq. 2
Specificity = TN/ (TN + FP) Eq. 3
Overall Accuracy = SP × SE Eq. 4
In equations 2-4, TP is number of true positives, TN is number of true negatives, FP is number of false positives, and FN is number of false negatives. Recall that SE, SP and SP ×
SE should be maximized.
2.4.1. Classification and Regression Trees (C&RT)
Introduced by Breiman in 1984, C&RT are decision tree algorithms that produce classification or regression trees depending on whether the dependent variable is categorical or numerical. The analysis has an embedded feature selection method, which picks the most significant molecular descriptors for splitting the data into the two most homogeneous groups (called branches or nodes). The final results of using tree methods for classification or regression can be summarized in a series of logical if-then conditions (tree nodes). Therefore, there is no implicit assumption that the underlying relationships between the predictor
13
variables and the dependent variable are linear. The advantage of C&RTs is their simplicity at interpretation of results summarized in a tree.
STATISTICA software has Classification and Regression Trees (C&RT) routine, which can develop classification (CT) or regression trees (RT) by selecting the most significant feature out of all the available features at every step of partitioning. The risk-estimate was used to check the reliability of the resulting RTs. The default stopping criteria were minimum number of cases of 21 and the maximum number of nodes set to 100 and the default V value in the V-fold cross-validation was 10.
In addition to the C&RT explained above with embedded feature selection, we used ‘Interactive tree’ option, a C&RT-style tree, which allows for the molecular descriptors to be selected manually by the operator. This tool is useful when investigating the effect of certain variables/ molecular descriptors on the property under investigation. In this investigation, interactive tree (I-tree) was used when evaluating the effect of predicted OATP inhibition/class on the prediction of biliary excretion. In this case predicted OATP inhibition or OATP class was used manually as the first variable for splitting the log BE% data. In I-tree, apart from the usual V-fold cross-validation procedure, another cross-validation option, “Cross-validate tree sequence” was also applied. This validation method is applied to the entire tree sequence, instead of just the final tree in V-fold cross-validation (Hill and Lewicki, 2006).
2.4.2. Boosted Trees (BT)
Boosted trees analysis generates a series of very simple boosting regression trees (BT) where each successive tree is built for the prediction of residuals of the preceding tree. Each of these
14
trees has a weak predictive accuracy, but using the weak predictors together can create a strong predictor (Hill and Lewicki, 2006). The default values for learning rate, the number of additive terms (number of trees), random test data proportion (fraction of data points in testing pool) and subsample proportion were 0.1, 200, 0.2 and 0.5, respectively. In addition to the default values, in this investigation, various subsample proportions of 0.4, 0.45, 0.50, 0.55 and 0.60 were examined in combination with the learning rates of 0.1 and 0.05. The seed for random number generation that controls which cases are selected in sampling was set to one. The maximum number of nodes was set to three, which means that each tree will have just one binary split.
2.4.3. Random Forest Trees Model (RF)
A random forest (RF) model is an ensemble of tree predictors such that each tree depends on the values of a random vector (a random selection of molecular descriptors and training set compounds) sampled independently. The method builds a series of simple trees where the predictions are taken to be the average of the predictions of all the trees (Breiman, 2001). The analysis removes a user defined portion of the data and keeps it as the internal test data. The remaining training set data is sampled consecutively and models are developed for each subsample. Various subsample proportions of 0.40, 0.45, 0.50, 0.55 and 0.60 were examined, while the number of predictors (to be randomly considered at each node) was set to the default value of nine. Different numbers of trees were tested at 20, 50, 80, 100 and 200. The random test data proportion was 0.2 for the internal validation. The best model was selected based on the estimation error for the internal test data.
15
2.4.4. Multivariate Adaptive Regression Splines (MARS) model
MARS is a non-parametric regression procedure that constructs a relation between the dependent and independent variables from a set of coefficients and basic functions that are entirely driven from the regression data (Friedman, 1991). It is a very flexible technique that automatically models non-linearities and interactions between variables. The non-linearities (knots) are represented by the so-called “hinge functions”; these are expressions of the type “max (a, b)” where the value of this expression will be ‘a’ if ‘a>b’, or else ‘b’. Interactions between each variable pairs can also be expressed in the formula. MARS model is developed by stepwise addition of basis functions in pairs (forward pass) to reduce the sum-of-squared residual error, and then step-by-step removal of the least significant terms to achieve better generalisation (backward pass). Model subsets are compared using the GCV criterion (Generalized Cross-Validation). GCV is the adjusted form of residual sum-of-squares that penalises the addition of knots in order to limit the model flexibility and overfitting.
In this investigation, in addition to using all the molecular descriptors in MARS analysis and allowing MARS to select the significant descriptors, we performed a pre-processing feature selection to select a limited number of molecular descriptors for use in MARS analysis. Feature selection methods were the Chi-square method as implemented in STATISTICA (Hill and Lewicki, 2006), stepwise regression analysis, and variable importance rank from random forest and boosted trees analyses. The Chi-square-based feature selection in STATISTICA picks a subset of descriptors from the descriptor pool without assuming that the relationships between the predictors and the dependent variables are linear or even monotone. In this feature selection, the range of continuous variable values was divided into 10 intervals. The six best descriptors picked by STATISTICA feature selection, the six best descriptors selected by stepwise regression analysis, as well as the top 5, 10, 15, 20 and 25
16
descriptors picked by RF, and the top 5, 10 and 15 descriptors picked by BT were examined in separate MARS analyses and the resulting models were compared in terms of the prediction error. In MARS analysis, the default model specifications for maximum number of basis functions, degree of interactions, penalty and threshold were 21, 1, 2 and 0.0005 respectively.
3. Results
It has been cited in the literature that presence of OATPs in the hepatocytes may indicate their significance in biliary excretion process (Shitara et al., 2013; Fenner et al., 2012). There has been some evidence from structure-activity studies that indicate similar structural features for OATP substrates and those with high biliary excretion (Varma et al., 2012). OATP data from high throughput assays has recently become available for 225 compounds (Karlgren et al., 2012a). In phase 1 of this investigation, this data was used to develop QSAR models for the prediction of OATP inhibition for three OATP subfamilies, OATP1B1, OATP1B3 and OATP2B1. In phase 2, QSAR models were developed for biliary excretion where the model features (predictors) included, in addition to molecular descriptors, the predicted OATP inhibition using selected OATP models from phase 1.
3.1. QSAR Models for OATP inhibition
Percentage inhibition of OATP transport of a probe substrate by compounds were analysed in this study to develop QSAR models for each OATP subfamily. The percentage inhibition data showed normal distribution with ‘skewness’ values of 0.163, 0.328 and -3.03 for OATP1B1, OATP1B3 and OATP2B1 respectively. Logarithmic transformations of these
17
datasets led to more skewed data distributions. As a result, QSAR models were developed with percentage inhibition as the dependent variable (non-logarithmic scale). Several decision tree-based regression models were developed for each subfamily of OATP. Two of the best regression models for each OATP subfamily were selected based on the prediction accuracy for the validation set. Table 4 shows the best two regression models for prediction of OATP inhibition. It must be noted in Table 4 that the mean absolute errors (MAEs) correspond to the percentage inhibition values in non-logarithmic scale which explains the high order of the observed error. The accuracy of the regression based models for the external validation set is similar to the training set (similar MAE values). This percentage error must be viewed considering the innate error levels associated with the single point measurements of OATP inhibition.
For the models presented in Table 4, graphs of average squared error of prediction against number of trees for the random forest and boosted trees models are available in Supplementary Information (Figures S1-S6).
Due to lower accuracy of percentage inhibition data in comparison with more ideal Ki or IC50
data, in addition to prediction (regression) type QSAR models, classification models were also investigated. Classification using C&RT analysis was carried for the dataset of OATP subfamily members. All 387 molecular descriptors were set as independent variables and inhibitor/non-inhibitor class, based on a 50% inhibition threshold, was set as the dependent categorical variable. In this way, the classification tree selects the most significant descriptors from the 387 descriptor pool for each split. Tree graphs for these classification models are available in Supplementary Information (Figures S7-S9). Table 5 shows the predictive performance measures of the classification trees. In this table sensitivity and specificity values are generally good especially for the classification model for OATP1B1 inhibition (CT
18
(1)). Karlgren et al. (2012) have developed classification, rather than regression based, QSAR models using this dataset. Their classification accuracy for the training and validation sets was 73% and 79% respectively, which is similar to CT (1) model (accuracy of 81% for inhibitors and 74% for non-inhibitors in the external validation set).
All models in Table 5 show better statistics for the training set than for the validation set. It is noted however that the specificity of CT (2) is very low for the external validation set. This means that CT (2) performs poorly in classification of the non-inhibitors of OATP1B3, whereas it can predict the inhibitors reasonably well.
3.2. Chemical space of OATP inhibitors and Biliary Excretion datasets
In terms of the chemical space, there seems to be a good overlap between the molecular properties of the two training sets, as indicated by a visual inspection of the scores plot from principle component analysis using all the molecular descriptors (Figure 2a) and the molecular descriptors selected by RT for the prediction of biliary excretion (Figure 2b).
3.3. QSAR Models for Biliary Excretion
The selected regression based models listed in Table 4 were used for the prediction of percentage OATP inhibition by compounds in the biliary excretion dataset. The predicted OATP binding parameters included percentage OATP1B1 inhibition by RF and RT methods (OATP1B1-RF and OATP1B1-BT), percentage OATP1B3 inhibition by RF and BT methods (OATP1B3-RF and OATP1B3-BT) and percentage OATP2B1 inhibition by RF and BT methods (OATP2B1-RF and OATP2B1-BT). These parameters were used as numerical predictor variables in the QSAR models for the prediction of biliary excretion. Moreover, the
19
classification trees (CT (1) – CT (3)), were used for the prediction of OATP inhibitor/non-inhibitor classes of the compounds in biliary excretion dataset. The predicted classes were used as categorical variables in the QSAR models for the prediction of biliary excretion.
3.3.1. Regression Tree Models for biliary excretion
In C&RT analysis for the development of regression trees, log BE% was the dependent continuous variable and the predicted OATP effects (six continuous and three categorical variables calculated using models from Table 4 and Table 5) along with the 387 molecular descriptors were the independent variables (predictors of the model). The resulting tree model did not incorporate any of the percentage inhibition of OATP or OATP class variables in the root or close to the root nodes of the tree. Note that C&RT has an embedded feature selection method for selecting the most significant descriptor at each node of the tree. The preference of C&RT analysis for the selection of molecular descriptors as opposed to OATP parameters cannot indicate per se that OATP parameters are not significant for the prediction of biliary excretion; only that the current feature selection algorithm has given preference to some of the molecular descriptors. In fact, from statistical point of view the selection of OATP parameters is substantially disadvantaged due to much higher number of molecular descriptors (>300) than OATP parameters (9 in total). In addition, feature selection in high dimensional data such as the dataset used in the present study is notoriously variable, and the selected features will more often than not vary depending on the algorithm used (Ghafourian and Cronin, 2005). Moreover, many feature selection methods are prone to be trapped in local minima or being non-reproducible. As a result, in order to inspect the effect of OATPs in biliary excretion, interactive C&RT analysis was used here where one of the most accurately predicted OATP parameters (predicted percentage inhibition or predicted OATP
20
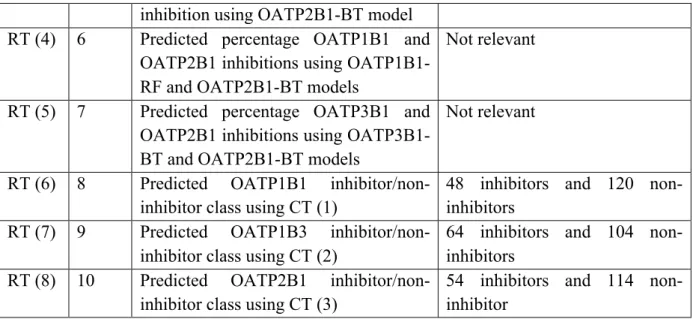
class) were manually used as the first variable for splitting the biliary excretion data (root node in the regression trees). After this root node, the tree was allowed to grow automatically using the features selected by the analysis. It must be noted that the resulting interactive tree and each step of branching in the tree is subjected to cross-validation as described in section 2.4.1. Hence, we examine the significance of OATPs, namely OATP1B1, OATP1B3 and OATP2B1 in biliary excretion using interactive regression tree analysis. To show the effect of each OATP subfamily on the prediction of biliary excretion, only the best regression tree was selected using continuous OATP inhibition and one tree using categorical OATP class. The results of interactive tree analyses indicated that all three OATP binding effects were statistically significant hence trees were successfully generated with cross-validation. Table 6 summarises these selected regression tree (RT) models in terms of the type of the predicted OATP effect used in the model, and a brief description of this descriptor.
Regression trees using predicted OATP percentage inhibition
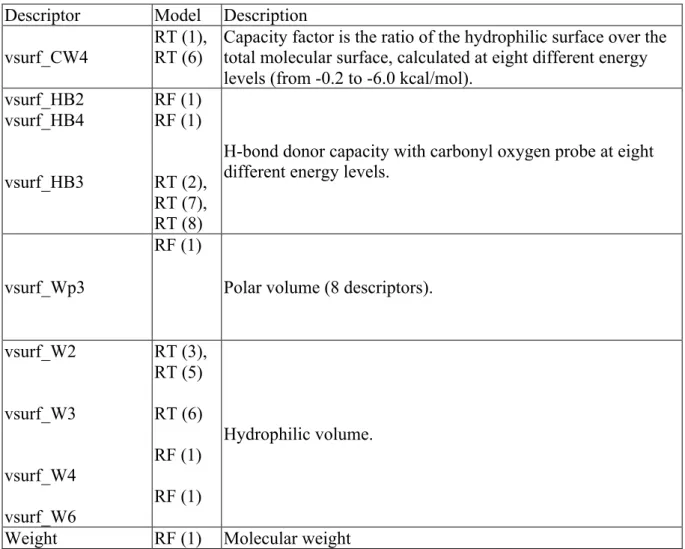
Figures 3-7 show the RTs where the root node is always a predicted OATP effect as described in Table 6. In these figures, ID indicates the ID number of the specific node in the tree, N is the number of training set compounds, Mu is the mean log BE%, and Var is the variance of the log BE% values for compounds in each node. Table 7 provides a brief description of the molecular descriptors used in the models. Figure 3 shows that compounds with OATP1B1 percentage inhibition higher than 35.53, as predicted by OATP1B1-RF, have higher biliary excretion. This literally means that compounds in biliary excretion dataset that are inhibitors of OATP1B1 by > 35.5% (representing stronger binding to the transporter), are predicted by this model to have higher biliary excretion. For OATP1B1 inhibitors, the compounds can be heavily excreted into the bile if compounds are hydrophilic
21
(vsurf_CW4>0.54) and particularly if they are highly ionised at physiologic pH as acid or base (fU ≤ 0.001 at node 12, with BE% of ~ 49%). For non-hydrophilic inhibitors biliary
excretion can be high only if they have GCUT_PEOE_0 (distance adjacency descriptor using PEOE atomic charge) value below -0.85 (node 15). According to this tree, log BE% is low for the non-inhibitors of OATP1B1 (node 4) especially if they have a low total positive partial charge (total positive partial charge calculated by PEOE method, PEOE_PC+). The terminal node ID 7 represents a group of 48 compounds that have a moderate biliary excretion (~7%) despite being weak substrates of OATP1B1 (i.e. <36% predicted inhibition). These may be substrates of other uptake transporters that operate in hepatocytes such as OCT or OAT. Table 8 provides the statistical parameters of the interactive regression trees.
Figure 4 shows the RT (2) when predicted OATP1B3 inhibition (OATP1B3-BT) was used in the analysis. According to this tree, 143 OATP1B3 inhibitors (> 22.93% inhibition) have a much higher biliary excretion. Within this group, those inhibitors with high H-bond donor capacity (vsurf_HB3 > 291.18) have a much higher biliary excretion especially if they are highly ionised at physiologic pH as acid or base (fU ≤ 0.001 at node 8). On the other hand, OATP1B3 inhibitors with small H-bond donor capacity can be heavily excreted in bile only if they have a large negatively charged surface area (Q_VSA_NEG > 188.77). For OATP1B3 non-inhibitor compounds, the log BE% is low (biliary excretion of 3.7%), further investigation of node 4 shows that these non-inhibitors are mainly charged quaternary ammonium compounds such as dibenzyldimethylammonium iodide, N-methylpyridinium iodide, paraquat di-iodide, tetraethylammonium bromide, emepronium bromide, triethylmethylammonium and vecuronium bromide.
Figure 5 presents the regression tree using predicted OATP2B1 effect (OATP2B1-BT) as the first split variable (RT (3)). The predicted percentage of OATP2B1 inhibition by BT method
22
for compounds in biliary excretion dataset ranged from -36 to 27% in the training set. According to this decision tree, compounds with percentage inhibition above 17.21 have high biliary excretion. Within this group of inhibitors, those with large hydrophilic volume (vsurf_W2>866) have a higher biliary excretion especially if these compounds have high acid/base dissociation (fU≤0.001) as seen with previous models such as RT (1) and RT (2)
(Figures 3 and 4). For those inhibitors with small hydrophilic volume (node 6) biliary excretion can be low or moderate depending on the value of distance matrix index (VDistEq); small branched molecules (with low VDistEq) will have close to zero biliary excretion (node 8). Non-inhibitors of OATP2B1 (node 2) are generally poorly excreted through bile, unless they are highly dipolar as indicated by their dipole moment (node 5). Anticancer agents such as irinotecan and dasatinib are examples of compounds in this node. The positive effect of high dipole moment (AM1_dipole) in biliary excretion was also seen in our previous study (Sharifi and Ghafourian, 2014). Statistical parameters of the model can be seen in Table 8.
To examine the impact of different OATP subtypes at one single model, predicted OATP1B1, OATP1B3 and OATP2B1 effects were imposed two at a time at the first and the second levels of a regression tree using interactive tree analysis module in STATISTICA. The best two models (most accurate in the prediction of external validation set) from these exercises have been presented in Figure 6 (RT (4)) and Figure 7 (RT (5)). According to RT (4) model, compounds with inhibitory effects on both OATP1B1 and OATP2B1 (82 compounds in node 7) have very high biliary excretion. Among these compounds, biliary excretion can be even higher if these compounds have high acid/base dissociation, fU≤0.001
(node 8). Within the OATP1B1 inhibitors, those that are not OATP2B1 inhibitors (node 6) have a moderate biliary excretion at 4%. Compounds with no binding to either one of the OATPs (compounds in node 4), mostly have low biliary excretion (average BE of ~1%). On
23
the other hand, non-inhibitors of OATP1B1 that are only OATP2B1 inhibitors (node 5) have average BE of 6.19%.
According to RT (5) model (Figure 7), compounds with inhibitory effects on both OATP1B3 and OATP2B1 (120 compounds in node 5) have high biliary excretion. Among these compounds, biliary excretion is higher for those with the value of hydrophilic volume (vsurf_W2) higher than 866 and in particular if these inhibitors have high acid/base dissociation, fU≤0.003 (node 8).
Regression Trees Using Predicted OATP Inhibitor Class
Here we employed various OATP “predicted class” in the interactive tree as an alternative approach to “predicted percentage OATP inhibition” for the prediction of biliary excretion. Prediction of OATP inhibitor/non-inhibitor class for compounds in biliary excretion dataset was obtained from CT (1) - CT (3) (Supplementary Information, Figures S7-S9 and Tables S1-S3 for description of the molecular descriptors of these models). In this way, both training and validation set compounds were predicted as inhibitors (≥50% OATP inhibition), or
non-inhibitors (<50% inhibition). As it can be seen from Table 8, the interactive trees using predicted OATP class as the first partitioning variable (RT (6) – RT (8)) had lower accuracy than RT (1) – RT (5) using predicted OATP inhibition percentage. RT (6) – RT (8) have been presented in Supplementary Information, Figures S10 – S12.
24 3.3.2. Boosted Trees Model for biliary excretion
After optimisation of BT parameters, the selected model based on the internal validation error (BT (1)) was obtained with the optimal number of trees of 64, learning rate of 0.10, minimum n in node 10, number of tree 200 and subsample proportion of 0.60 (see Supplementary Information Figure S13 for a graph of average squared error against the number of trees).
Variable importance was calculated for the BT model using STATISTICA software. Included in Table 7 are the top 10 most important molecular descriptors of BT (1) model. Lipophilicity descriptors (LogD(5.5), LogD(6.5), LogD(7.4) and LogD(10)), Fractional negative and positive van der Waals surface area (PEOE_VSA_FNEG and PEOE_VSA_FPOS), fractions of compounds that is ionised at pH 7.4 as acid (FiA) and fraction unionised fU, topological/size descriptors (KierA3) and electrotopological state index (Gmin) are the top 10 most important BT (1) descriptors. Although the predicted OATP binding parameters are not amongst the top 10 descriptors of the model, they are used in the model with lower importance according to the variable importance measure of the software, and they appear to be important in this model in terms of improving the prediction accuracy for the external validation set (See Table 8 for the comparison of error between BT models with or without using predicted OATP inhibition (BT (1) vs BT (2)).
3.3.3. Random Forest Model for biliary excretion
The method for the development of a random forest (RF) model has been explained earlier. Based on the accuracy for the internal test set, the selected RF model (RF (1)) was obtained using a subsample proportion of 0.60, numbers of trees of 100, random test data proportion of 0.3 and the software’s default settings for stopping conditions including minimum number of
25
cases, maximum number of levels, minimum number in child node and the maximum number of nodes of 10, 10, 5 and 100, respectively (Figure S14 in the Supplementary Information shows the plot of prediction error against the number of trees). The top 10 most important variables of this model are volsurf descriptors (vsurf_W4, vsurf_W6, vsurf_HB2, vsurf_HB4 and vsurf_Wp3), the total VDW area (VSA) and negative charge weighted surface area (CASA-), molecular weight (weight), atomic valence connectivity index (chi1v) and total negative van der Waals surface area (PEOE_VSA_NEG). Despite not being listed as the top 10 most important parameters, it can be seen in Table 8 that the use of predicted OATP inhibition parameters in the model development improved error significantly in the external validation set in comparison with RF (2) using only the molecular descriptors.
3.3.4. MARS model for biliary excretion
Many combinations of molecular descriptors picked by several pre-processing feature selection methods were used in MARS analysis to obtain the best possible model as explained in the methods section. The feature selection methods included Chi-square method, stepwise regression analysis, and variable importance rank from random forest and boosted trees analyses. Previous investigations have shown that predictor importance using random forest is a very successful feature selection method that can be applied for reducing the data dimensionality prior to CART analysis (Newby et al., 2013a). Here, the best MARS model was obtained when the top 30 molecular descriptors from RF model, together with the 9 predicted OATP inhibition parameters were used as the independent variables. Subsequently, the pruning function in MARS analysis picked 7 out of these 39 features in the selected model (presented in equation below). The scatter plot of observed vs predicted values by this model for training and test set is presented in Supplementary Figure S15. MARS equation
26
below consists of 10 basis functions, and it does not contain any interaction term. In this model, molecular descriptors have been presented according to the rank order of their importance, with the most important descriptor being the first one in the equation. According to this equation, hydrogen bonding donor capacity (vsurf_HB4) is the most important descriptor with a positive effect on biliary excretion (all compounds in the dataset have vsurf_HB4>235.6). The second most important descriptor of the equation, the unionised fraction of compounds at pH 7.4 (fU) with a negative effect on biliary excretion, indicates that compounds with higher unionised fraction at pH 7.4 have lower biliary excretion. In other words, according to fU, acidity and basicity (dissociation in general) increase the biliary excretion of compounds. Further, the van der Waals volume (vdw_vol) has a positive effect toward biliary excretion at volumes >317.29. An interesting finding from the MARS equation is a knot at -6.592 for the lowest hydrophilic energy at molecular surface (vsurf_EWmin2). Accordingly, for compounds with vsurf_EWmin2 values <-6.592 (102 compound in the training set), increasing vsurf_EWmin2 leads to a decrease in log BE%, while for compounds with vsurf_EWmin2 >-6.592 (66 compounds in the training set) biliary excretion will increase by increasing vsurf_EWmin2. OATP1B1 and OATP2B1 inhibition predicted by QSAR models (OATP1B1-RF and OATP2B1-BT) both have positive effects on log BE%. In addition, increasing molecular density up to 0.8692 has a positive effect on biliary excretion.
The selected MARS model and the main statistical parameters of this model are presented below:
Log BE% = 0.378 - 0.004*max(0, 235.625-vsurf_HB4) + 0.640*max(0, 0.999-fU) + 0.001*max(0, vdw_vol-317.298) – 0.007*max(0, 317.298-vdw_vol) + 0.374*max(0, vsurf_EWmin2+6.592) + 0.163*max(0, -6.592-vsurf_EWmin2) + 0.005*max(0, OATP2B1-BT-13.101) – 0.135*max(0, OATP1B1-RF-64.262) - 2.628*max(0, 0.886-density) – 0.002*max(0, vsurf_HB4-185.500)
27
N = 168 GCV error = 0.333 Mean residual = 0.000 SD (residual) = 0.503
4. Discussion
Biliary excretion is one of the major elimination routes for drugs and as a result, it has a major impact on pharmacokinetics including drug half-life and dosing regimen. Moreover, biliary excretion has implications in drug-drug and food-drug interactions through the possible involvement of same transporter proteins. As a result, early estimation of biliary excretion may be useful for modification of drug structure in drug design to have an ideal drug. Among transporter proteins, OATPs have been suggested as some of the major contributors to the uptake of compounds by hepatocytes and biliary excretion of compounds (Fenner et al., 2012). Recently, OATP1B1 inhibition measures have been suggested as a suitable surrogate for the more complicated human hepatic uptake assays (Soars et al., 2012). This was based on a comparison between uptake measures in human hepatocytes (in vitro intrinsic clearance) and IC50 values for the inhibition of OATP1B1-mediated uptake of a
model substrate for 42 compounds from several chemically distinct series. In this present investigation our aim was to use the OATP inhibition predicted by QSAR models for a more accurate prediction of biliary excretion using QSAR. Therefore, first a dataset of OATP inhibitors with in vitro measures of activity (percentage inhibition) was used to develop QSAR models for the prediction of OATP inhibition. In the second phase, the selected models were used for the prediction of OATP inhibition by the compounds in the biliary excretion dataset. These predicted OATP inhibition values were then used for the development of models for the prediction of biliary excretion. Here we first discuss QSARs for OATP inhibition and then the models for biliary excretion.
28
4.1. QSAR Models for the Prediction of OATP Inhibition
Despite the wide distribution and important implications of OATP transporter family in drug fate, unfortunately, there are limited amount of study of OATP transporter ligands (Karlgren et al., 2012a). This has resulted in a limitation in the availability of high quality data for QSAR studies. To study the significance of OATP binding in biliary excretion, we used a recently published dataset of percentage inhibition of three OATP subtypes, OATP1B1, OATP1B3 and OATP2B1 by 225 compounds was employed. Despite the single concentration measure of binding not being ideal in comparison with IC50 or Ki, QSARs of
reasonable accuracy were established for the three OATP subtypes. In addition, a classification model, i.e. classification tree, was also established for each OATP subtype with good overall prediction accuracy, specificity and sensitivity. Both regression type and classification methods were most successful for the prediction of OATP1B1 binding when compared to OATP1B3 and OATP2B1 binding. This may be attributed to a more balanced inhibitor/non-inhibitor ratio in the dataset for this OATP subtype. The results showed large hydrophilic compounds with hydrogen bonding donor ability (such as carboxylic acid groups) are better inhibitors of OATP1B1 and OATP2B1, while flexibility was an additional factor for OATP1B3 as discussed in detail below.
OATP1B1 Inhibitors
For OATP1B1, RF and BT resulted in the best prediction models (OATP1B1-RF and OATP1B1-BT in Table 4). The molecular descriptors of importance in the RF model were size parameters (such as b_heavy and vdw_area), charge characteristics of the molecular
29
surface (such as PEOE_VSA_POS) and volsurf parameters such as hydrophilic volumes (vsurf_W1 and vsurf_W2) (See Table S1). Similarly, BT (1) features included size, e.g. chi1_C, hydrophilicity parameters, e.g. vsuf_CW2 as well as acidity descriptor, fiA. The drawback of ensemble methods, BT and RF, is that they are difficult to be interpreted in terms of the nature of the effect of each molecular descriptor on the OATP1B1 inhibition. Previous investigations suggest that ligands of OATP1B1 are mainly acidic (Hsiang et al., 1999). The importance of acidic nature of OATP1B1 ligands has also been indicated in CT (1). In CT (1), in order to be classed as inhibitors, compounds of smaller size (defined by Chi1_C ≤ 9.68) need to have acidic group shown by partially positively charged hydrogen, as
in –COOH group (Hmin), or have high apparent partition coefficient in acidic pH (logD(2)). However, according to CT (1), majority of inhibitors are larger molecules containing many carbon atoms with very few exceptions of large molecules that are non-inhibitors. The crucial impact of large molecular size for OATP ligands is very well established from previous studies. Whereas OATs transport low MW compounds, OATPs mediate the uptake of larger substrates such as digoxin (Shitara et al., 2002; Hagenbuch and Meier, 2003), erythromycin (Sun et al., 2004) and atorvastatin (Lau et al., 2006). This is also in line with a study by Hagenbuch and Meier which reports that compounds with molecular weight higher than 350 can be OATP1B1 substrates (Hagenbuch and Meier, 2004).
A recent QSAR model by Soars and colleagues using IC50 values for 262 proprietary
compounds found that maximal hydrogen bonding strength and lipophilicity (cLogP) were the most important molecular descriptors of their random forest model for predicting OATP1B1 inhibitors (Soars et al., 2014), although this does not indicate the exact nature of the relationship in terms of lipophilicity increasing or decreasing the OATP1B1 inhibition. Our random forest model consists mainly of size parameters (5 of the top 10 most influential descriptors) and Hydrogen bonding or hydrophilic size (4 out of the top 10 molecular
30
descriptors (Table S1). De Bruyn and co-workers in a recent study, noted the polar surface area is the key molecular feature for an increase in OATP1B1 inhibition (De Bruyn et al., 2013), which is in agreement with CT (1) indicating the positive impact of a high hydrophilic/lipophilic balance of the molecular surface (vsurf_HL1) and a large negative polar surface area (PEOE_VSA_NEG) for the compounds to be classed as inhibitors of OATP1B1. Table S1 shows the list of top 10 most important molecular descriptors in RF and BT models as well as those selected by the classification tree CT (1).
OATP1B3 Inhibitors
The selected regression based models for OATP1B3 inhibition were obtained from RF and BT analyses. 5 out of 10 of the most important molecular descriptors of OATP1B3-BT are BCUT and GCUT descriptors derived from adjacency and distance matrixes with diagonals set to atomic charge, or log P or molar refractivity contributions. The remaining most important features are various lipophilic surface area or polar volume parameters. The top 10 most important parameters of OATP1B3 include hydrogen bonding and hydrophilicity descriptors such as volsurf descriptors indicating hydrogen bonding donor capacity and polar volume (vsurf_HB4 and vsurf_Wp4), fractional hydrophobic surface area and positive surface area, as well as size parameters (molar volume) (See Table S2). This is in agreement with the findings of De Bruyn and co-workers indicating the positive effect of high lipophilicity (De Bruyn et al., 2013). In addition, they found that a high number of aromatic bonds (>7) is required for OATP1B3 activity as opposed to OATP1B1 inhibition which requires the number of these bonds to be lower than 7. This is also similar to CT (2) model that has used the ratio of rotatable to total number of bonds as the most important parameter
31
defining an inhibitor/ non-inhibitor (Figure S8 and the explanation of this model in the Supplementary Information).
The prediction accuracy of the regression based OATP1B3 models is similar to the models for OATP1B1 at ~20% for the external validation set. However, the classification model, CT (2), has very low classification accuracy for the non-inhibitors in the external validation set (36%), despite performing well for the classification of inhibitors in the same set (83%).
OATP2B1 Inhibitors
In comparison with OATP1B subfamily (Chang et al., 2005; De Bruyn et al., 2013; Soars et al., 2012), very little is known about OATP2B1 ligands with only few literature data available and no in silico results (Karlgren et al., 2012a). The structure of OATP2B1 has been shown to be very similar to OATP1B3 using in silico homology modeling studies (Meier-abt et al., 2005). Based on the similarities with other OATP transporters, it may be speculated that OATP2B1 pharmacophores may share similar molecular features for the consideration of the substrate binding at the positively-charged region (El-Kattan and Varma, 2012). It has been suggested that the substrates of OATP2B1 may have features such as a hydrophobic core to form the π-stacking interaction with the imidazole ring of amino acid
H579, or a hydrogen bond donor group to directly interact with the nitrogen atom of the imidazole ring (El-Kattan and Varma, 2012).
The selected regression based models for OATP2B1 ligands are based on RF and BT analyses (OATP2B1-RF and OATP2B1-BT), and CT (3) is the classification model (Tables 4 and 5). CT (3) model has correctly classified 77% and 58% of the inhibitors and non-inhibitors in the external validation set, respectively. The accuracy of the PLS-based
32
classification model suggested by Karlgren et al. (2012a) for this transporter was 75%, but they had used a different classification cut-off point of 32%. CT (3) model indicates that inhibitors of OATP2B1 are generally large hydrophilic molecules with constituent atoms that are not highly positively charged (See Supplementary Information Figure S9 and Table S3).
RF and BT models for OATP2B1 show importance of polarity indicated by various measures of polar surface area, acid/base dissociation (fU), as well as molecular flexibility (see Table S3). These regression based methods had a prediction error of ~25% (MAE = 25 for percentage inhibition data) for the external validation set (see Table 5).
4.2. Effect of OATP Binding on Biliary Excretion Models
For hepatobiliary elimination of compounds, it has now become progressively clear that the movement of solutes and compounds into and out of cells is often dependent on transporter proteins. After compounds enter the hepatocytes, they either undergo the metabolism process, or, the intact compounds or their metabolite molecules are excreted into the bile canaliculus. The uptake transporters enhance biliary excretion by importing more compounds into hepatocytes. Among the various uptake transporters, OATP family members appear to have remarkably broad substrate specifications (Kim, 2003). In human and rat hepatocytes, the hepatic uptake of many compounds is mediated by OATP family. Varma et al (2012) in their research paper comparing biliary excretion of compounds and the chemical space of substrates of human OATPs and rat oatp1b2 observed that there is a significant overlap between these substrates and compounds with a rat biliary excretion higher than 10%. Fenner et al (2012) have also shown the importance of OATPs in biliary excretion through the study of several case examples from Pfizer portfolio and from the literature.
33
In this investigation, the predicted OATP inhibition values using the six models in Table 4 or the predicted OATP inhibitor/non-inhibitor class by the three models in Table 5 were used as features (predictors) for the development of QSAR models for the biliary excretion of compounds. The biliary excretion dataset used in this project consisted of a diverse dataset of 217 compounds with percentage of dose excreted intact into bile measured in vivo in rat. The main aim of the investigation was to develop a predictive QSAR model for this dataset and investigate the value of OATP inhibition measures as features in the accurate prediction of biliary excretion. Using embedded feature selection in C&RT analysis, none of the predicted OATP effects were selected at root or close to the root of the regression trees (although some of those were selected very deep in the tree structure. It must be noted here that the number of OATP binding parameters (nine parameters in total) is much lower than the number of molecular descriptors used (more than 300 in total). This gives a higher statistical probability to the molecular descriptors to be selected by any statistical feature selection. Moreover, it is well known that feature selection algorithms can often end up in local minima solutions when dealing with high dimensional data. Therefore, preferential selection of molecular descriptors over OATP parameters cannot indicate that these parameters are not significant predictors of biliary excretion. Nor can it indicate that the selected set of molecular descriptors by C&RT is the optimum set of features for the most accurate prediction of biliary excretion. Therefore, in order to investigate the influence of OATP binding on the biliary excretion of compounds, the OATP descriptors were incorporated in the tree structure manually using Interactive Tree analysis in STATISTICA. The models obtained in this way by cross-validation indicate that predicted OATP inhibition is a significant parameter for the prediction of biliary excretion of compounds (models RT (1) – (8) in Table 8). Overall, the regression trees RT (1) – (8) indicate higher biliary excretion for inhibitors (or compounds with higher percentage inhibition) in comparison with non-inhibitors of various OATP sub-families. It can be seen
34
in Table 8 that a regression tree without the use of predicted OATP effect (RT (9)) has a slightly higher MAE than RT (1) that incorporates predicted OATP1B1 inhibition. This is a reasonable expectation considering first the error associated with the high throughput measurement of percentage OATP inhibition (Karlgren et al., 2012a), and second, the error associated with the prediction of OATP1B1 effect using QSAR.
Overall, although these predicted OATP binding parameters were not picked by C&RT algorithm, and they were not ranked within the top ten most important features of BT or RF models, they were important in improving the prediction accuracy of BT and RF models, and when they were incorporated manually in the regression trees they resulted in improved accuracy (RT (1) vs RT (9)). The selected RT model constitutes the best model over all for the prediction of biliary excretion with an absolute error of 0.345 (RT (1), Table 8). This is followed by the MARS, the second most accurate model with MAE of 0.363 for the external validation set. MARS incorporates two OATP inhibition effect out of a total of eight model features. The OATP inhibition parameters used in MARS model are the BT predicted OATP2B1 inhibition and the RF predicted OATP1B1 inhibition.
In assessing the effect of predicted OATP binding on the QSAR models for biliary excretion, it must be noted that the OATP effect used for the prediction of biliary excretion is not measured experimentally, but only predicted for these compounds in silico using QSAR models that are based on percentage inhibition data. Percentage inhibition is a high throughput single concentration measure of inhibition activity and in comparison with measures such as IC50 and Ki is a lower accuracy measure of inhibition. Moreover, the
inhibition of OATPs may not be a good indicator of substrates. An additional factor that needs to be considered here is that the in vitro OATP inhibition data is based on the human transporter protein overexpressed in the cell culture, while the biliary excretion data relates to
35
rat in vivo experiments where the hepatic oatp transporters may have a altered substrate specificity. To sum up, in the absence of a more representative oatp substrate data such as Km or Vmax, we have used a surrogate parameter, i.e. (in silico predicted) OATP percentage inhibition, for the prediction of biliary excretion in rats. This exercise has proved successful as the results show that these OATP features are statistically significant in the prediction of biliary excresion. The resulting models have better or similar accuracy to the models that use only the molecular descriptors as their features.
Amongst various predicted OATP effects, the numerical predicted percentage OATP inhibition (RT (1) - (5)) are more accurate than the categorical predicted class variables (RT models (6) – (8)) for the prediction of biliary excretion (see MAE values for the validation set in Table 8). This may be due to better prediction accuracy for the regression based models for the prediction of OATP effect of compounds in the biliary excretion dataset in comparison with classification models, although the accuracy of regression and classification analyses cannot be compared directly.
Comparing the accuracy of RT (1) – (5), it is clear that, out of different OATP subfamilies, incorporation of OATP1B1 inhibition results in the most successful model for the prediction of log BE% (RT (1)). The second best model is obtained by incorporation of predicted OATP1B3 inhibition, with predicted OATP2B1 inhibition resulting in the least accurate model (RT (3)). This may indicate a more significant role for OATP1B1 in biliary excretion of compounds than OATP1B3 or OATP2B1, which is in agreement with the literature that highlight mainly the role of OATP1B1 subfamily in the elimination of compounds (Soars et al., 2012). Moreover, OATP1B1 is known to have a higher expression level than the other two proteins in the sinusoidal membrane of hepatocytes (Tu et al., 2013). It must also be