J o u r n a l o f A d v a n c e s i n c h e m i s t r y
MapReduce based Classification for Microarray data using Parallel
Genetic Algorithm
E.Gothai, Associate Professor, Department of CSE, Kongu Engineering College, Perundurai, Tamilnadu, India. [email protected]
P.Aarthi, Research Scholar, Kongu Engineering College, Perundurai, Tamilnadu, India.
Abstract:
Inorder to uncover thousands of genes Microarray produces high throughput is used. Only few gene expression data out of thousands of data is used for disease predication and also for disease classification in medical environment. To find such initial coexpressed gene groups of clusters whose joint expression is strongly related with the class label A Supervised attribute clustering is used. By sharing the information between each attributes the Mutual Information uses the information of sample varieties to measure the similarity among the attributes. From this the redundant and irrelevant attributes are removed. After forming the clusters the PGA is used to find the optimal feature and is given as mapper function so as to improve the class separability. Using this method the diagnosis can be made easier and effective since its done parallelly. The predictive accuracy is estimated using all the three classifiers such as K-nearest neighbours including naive bayes and Support Vector machine. Thus the overall approach used reducer function which provides excellent predictive capability for accurate medical diagnosis.
Keywords
–MapReduce, Hadoop, Microarray, genes, mutual information, parallel attribute clustering, classificationI. INTRODUCTION
In human body every organ is made of cells and each cells will contains a nucleus. The nucleus is framed of double stranded Deoxy-ribo Nucleic Acid as DNA molecule called Chromosomes. Gene is a DNA sequence present in a certain chromosome which embeds the information for the purpose synthesis of proteins. Gene expression is the process through which the gene information is converted to mRNA and which will convert into proteins. The gene expression a level consists of thousands of genes are watched and recorded using the microarray technology. Thus the microarray data is represented in the form of matrix in which the row represents genes and the columns represent the samples where each value in the matrix shows the expression levels of genes.
By experiment we have obtained the data and using that data we found only few genes are useful and most of the genes are irrelevant to what we classify. The unrelated genes causes many issues including noises to other gene expression data analysis and not only that they also increase the dimensionality of the matrix which will result in more computational complexity while we do clustering an classification. So it is very important to remove the irrelevant genes and to find only the most important genes which are useful in performing the test.
Various clustering methods are used in gene expression data analysis. Few of them are k-means, PCA and SOM algorithms which are interdependent and correlated with one another. The attribute clustering helps in achieving the search dimension and it could be used to construct the model with a correlated collection of genes rather than all the genes.
The main functionality in using the gene expression data is to identify cluster of genes whose combined expression altogether is strongly related with the few categories. The unsupervised and few supervised clustering algorithms have not incorporate the information of sample categories. Thus the supervised Attribute Clustering algorithm is helped to identify such groups of genes by using the information of sample categories. A quantitative measure based on Mutual Information is used to calculate the similarity among the attributes. After the cluster is formed for each relevant attribute that increments the attribute one after the other attribute. The growth of the formed clusters is repeated till we find the new cluster gets stabilized. The Genetic Algorithm is applied as a mapper function to get the optimal feature to increase the class separability index. Thus when class separability gets increased when we use parallel execution to the new sample that we give into its respective class definely by getting a prediction of diagnosing diseases.
1.1 BIG DATA
Big data is a large data that it becomes difficult to process the conventional database systems. If the data is very large, moves very fast, or doesn‟t fit the structures of the database architectures. To gain value from this data, choose another way to process the data. Big Data in general is defined as high volume, velocity and variety information innovative forms of information processing for enhanced insight and decision making. Big Data is the frontier of the firms ability storing, processing and accessing large volume of data it needs to operate effectively, to make better decisions, helps to reduce high risks, and to provide solutions to the customers.
However, the amount of data generated can often be very large for a single computer to process in a reasonable amount of time. Furthermore, the data itself may be too big to store on a single machine. Therefore, in order to reduce the time taken to process the data, and to allocate the storage space for large files, it is very much wanted to write programs that can execute on multiple nodes and distribute the workload among the nodes.
J o u r n a l o f A d v a n c e s i n c h e m i s t r y
1.2 CHARACTERISTICS OF BIGDATA
Big data is the data characterized by four key attributes volume, variety, velocity and veracity:
Big data contains very large volumes of data. Data is produced by various machines, networks and human interaction on systems like social media that produces petabytes of information.
Big data can contain both structured and unstructured data. Unstructured data that includes all varieties of data like audio data, video data, image data, text data, log files and even more.
Velocity refers to speed in which the data is produced and how it moves around. It contains the real time working systems.
Veracity is the huge amount of data together for big data purposes can lead to numerical errors and misunderstanding of the collected information. Purity of the information is critical for worth.
1.3 HADOOP
Hadoop is the basic for most big data architecture. Apache hadoop is an open source java programming framework for fast storing and fast processing large data sets with cluster of product hardware. Cluster is a set of machine in single LAN (Local Area Network). The Hadoop is mainly constituted by the underlying distributed file system HDFS (Hadoop Distributed File System) and MapReduce layer of parallel programming model engine. Hadoop is used by various universities and companies like Google, eBay, Facebook, IBM, LinkedIn and Twitter.
1.3.1 HDFS and MapReduce
HDFS is a reliable distributed file system that provides high-throughput and scalable access to data. MapReduce is a distributed framework for executing the work in parallel. Hadoop has the master/slave architecture for both processing and storage. Figure 1.1 shows the HDFS and MapReduce.
Figure 1.1 HDFS and MapReduce
HDFS is a specially designed file system for storing massive amount of data sets with cluster of commodity hardware with steaming access pattern. Steaming access pattern means write once and read any number of times but don‟t change content of files in file system. HDFS differ from other file system by its significant. HDFS is a very large distributed file system which is highly fault-tolerant, provides high throughput access to the large data and deployed on low-cost hardware.
HDFS is mainly used for storing data, and simply adding the number of servers can achieve growth in storage capacity and computing power. MapReduce can make full use of the computing resources of each server's CPU, which efficiently handles with the stored data and calculations. To address the above issues, Google developed the Google File System (GFS), which is a distributed file system architecture model for processing large amount of data and created the MapReduce programming model. The MapReduce programming model is for processing the massive amount of data in parallel. Hadoop is an open source software which mange MapReduce framework, written in Java, originally developed by Yahoo.
Figure 1.2 MapReduce Architecture
Input split Map per Map per Map per Reduc er Output
HADOOP
HDFS(Redundant, reliable storage)
MAPREDUCE
(Cluster resource management
J o u r n a l o f A d v a n c e s i n c h e m i s t r y A MapReduce consists of two tasks namely the Map and Reduce task. Each Map task takes key-value pair as input and produce key-value pair as an output. The input data are split into various input splits. Based on the number of input splits Mapper will be assign. Record Reader is an interface between input split and Mapper which is used to convert record into key value pair. Mapper will read key value pair as an input and produce key value pair as an output. Now the Reducer will combine all the intermediate values associated with a particular key. Both input pairs of Mapper and Reducer are managed by the HDFS. The advantage of MapReduce is highly scalable, transparent fault-tolerant processing and automatic parallelization. Figure 1.2 shows the MapReduce architecture. MapReduce has been adopted by Google, Microsoft and Facebook.
II. LITERATURE REVIEW
Golub et al (1999) proposed the Classification of cancer for class discovery and class prediction by gene expression monitoring. Although cancer classification has enhanced over the past 30 years, there has been no general method for identifying new cancer module (class discovery) or for assigning tumors to known classes (class prediction). Here, a generic method used to cancer classification based on gene expression monitoring by DNA microarrays is identified and given to human acute leukemias as a sample test case. A class discovery procedure mechanically discovered the distinction between acute myeloid leukemia (AML) and acute lymphoblastic leukemia (ALL) without earlier information of these classes. An repeatedly derived class predictor was able to establish the class of new leukemia cases. The results display the possibility of cancer classification based exclusively on gene expression monitoring and advise a general strategy for discovering and predicting cancer classes for other types of cancer, free of previous biological data.
Au et al (2005) presents an attribute clustering method which groups genes based on their interdependence to mine the significant pattern from the gene expression data. This method is used for gene alliance, choice and arrangement. A new method ACA is introduced so as to gather the mutually dependent relative attributes into clusters by optimizing a measure function derived from an informative measure that reflects the interdependence between the attributes. The important clusters of genes are discovered on applying the Attribute Clustering Algorithm (ACA) to gene expression data. The clustering of genes based on the attribute interdependence within group helps to confine unlike aspects of gene association patterns in each set. Significant genes certain from each collection then contain helpful information for gene expression classification and identification.
Dettling et al (2002) fixed on Supervised Clustering, important as grouping of genes controlled by information about the tumour types of tissues. This clustering can be happening with or without initial groups of genes, and then the genes are clustered in a stagewise forward and on the way to the back search, as long as their discrepancy expression can be improved. This yield clusters naturally made up of three to nine genes, whose rational average expression levels allow a perfect unfairness of tissue types. Although it is sensitive to noise or outlier of the dataset, the output of this algorithm is helpful for cancer type of diagnosis.
Pradipta Maji (2011) anticipated a new Supervised gene clustering algorithm, named as Fuzzy-Rough Supervised Attribute Clustering (FRSAC) based on fuzzy-rough sets. To deal with the uncertainty in gene expression, the FRSAC algorithm is used. It identifies the coregualted clusters of genes. To calculate the similarity among genes Fuzzy Rough sets are used. This measure incorporates the used information of sample categories while measuring the common similarity between genes. The FRSAC algorithm uses this value to reduce the common or simarliar among genes. It uses the portioning of original gene set into some different subsets or clusters so that genes inside the clusters are highly related, while those in different are dissimilar as likely.
Li et al (2007) projected the best search based gene-selection methods because they calculate the performance of genes and to find out the optimal set of indicator genes. The Tabu Search and Genetic Algorithm are the significant optimal search methods. In Genetic the chromosomes form the initial population. Each gene in the population is calculated using the fitness function. The genes with higher fitness value are selected based on the Survival of the Fittest principle and copied into the matting pool. The next step is crossovers arbitrarily choose a pair of strings from the pool and two off springs are produced by exchanging the genetic information among the parent strings. Mutations are performed by changing the elements on each string. By repeating this procedure for number of generations, the strings with the best function of all generation is regarded as the optimum.
III. PROPOSED WORK
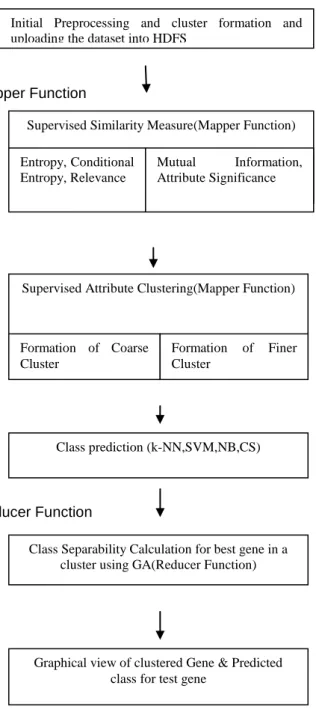
The proposed method works with the similarity between the attributes and clustering of similar attributes and classification prediction using various other classifiers and class separability with Genetic Algorithm is shown in figure 2. It removes the dimensionality and avoids the noise sensitivity issues and increases the accuracy of classification of microarray data.
A. Preprocessingdata
The Preprocessing data is important to overcome noisy data‟s with errors and outliers and missing values and inconsistent data. The preprocessing data procedure of genes tells us how to filter the data by removing genes that are not expressed and having only minimum variability among the samples or do not change. The data sets of genes are very large. To identify the important genes, the size of the dataset is reduced by removing genes with expression profiles that do not show any interest. There are huge number of methods to reduce the number of gene expression profiles to some subset that contains the most relevant genes. The different approaches are, the gene expression data with empty gene symbols are removed, the gene with missing data are recognized using the function in matlab and the genes are removed using the indexing comments and the genes with very low absolute expression values are filtered out using the gene low val
J o u r n a l o f A d v a n c e s i n c h e m i s t r y filter function and the genes with a small variance diagonally samples are filtered using the genevar filter function and the genes whose profile having low entropy values is filtered using the gene entropy filter function.
Thus the preprocessing data module filters out the missing genes, genes with very low absolute value and small variances. The dimensionality reduction is achieved by removing the unnecessary genes.
Mapper Function
Reducer Function
Fig. 2 System Model
Cluster Formation and Uploading the Dataset into HDFS
This module describes about Hadoop Installation. In this work, Hadoop is installed in Pseudo Distributed Mode and in Fully Distributed Mode. HDFS is the primary storage system of Hadoop and is composed of NameNode and DataNodes as architectural components. In this module, Dataset present in the local file system needs to be uploaded into the HDFS to calculate the memory consumption of NameNode. Based on this, the storage and access efficiency of the small files are calculated.
B. Supervised Similarity Measure
In actual data analysis the most important problem is to compute both significance and redundancy of attributes by discovering dependency among them. Thus the similarity between attributes needs to be computed after the data is pre-processed. In order to obtain the similarity measure the relevance of the attributes is to be calculated. The relevance of the
Initial Preprocessing and cluster formation and uploading the dataset into HDFS
Supervised Similarity Measure(Mapper Function)
Entropy, Conditional Entropy, Relevance
Mutual Information, Attribute Significance
Supervised Attribute Clustering(Mapper Function)
Formation of Coarse Cluster
Formation of Finer Cluster
Class prediction (k-NN,SVM,NB,CS)
Class Separability Calculation for best gene in a cluster using GA(Reducer Function)
Graphical view of clustered Gene & Predicted class for test gene
J o u r n a l o f A d v a n c e s i n c h e m i s t r y attribute with respect to class label is defined using Mutual Information, which is used to quantify the information shared by two objects. If not similar information is exchanged between the independent objects, the value of mutual is small. Two highly correlated objects will display a elevated mutual information value. The objects can be the class label and the genes. If a gene has expression values randomly or uniformly distributed in unlike classes, its mutual information with these classes is zero. If a gene is strongly differentially expressed for different classes, it should have large mutual information. Thus the mutual information is measured based on the probability distribution of random variables using entropy and conditional entropy. The mutual information may be used to measure the level of similarity or redundancy between two genes. The mutual information can be used as a measure of relevance of genes.
The next step is to find the significance of one attribute with respect to another attribute in the dataset. The significance of one attribute is the change in dependency when that attribute is removed from the set of attributes. The higher the change in dependency, the more significant that attribute is. If the significance is 0, then that attribute is dispensable. Based on the significance of an attribute, the supervised similarity measure between two attributes is calculated. Hence the supervised similarity measure directly takes into account the information of sample categories or class labels while computing the similarity between two attributes. If the two attributes are completely correlated with respect to the class labels then the supervised similarity between them will be 1. If the two attributes are uncorrelated, then their value is 0. Thus the output of the supervised similarity measure lies between 0 and 1. Using this similarity measure the clusters can be formed.
C. Parallel Supervised Attribute Clustering
The Parallel Supervised Attribute clustering method uses this parallel supervised similarity measure to reduce the redundancy among genes. It involves the separation of the original gene set into some diverse subsets or clusters so that the genes within the clusters are highly coexpressed with the strong relation to sample categories, while those in different clusters are as dissimilar as possible. From each coarse cluster a gene having highest gene-class relevance value is first selected as the initial representative of that cluster. The representative of each cluster is then changed by averaging the initial representative with other genes of that cluster. Finally the modified representative of each cluster is selected to constitute the resulting gene set in the finer cluster. This algorithm yields biologically significant gene clusters, where Gene Ontology Term finder is used and avoids the noise sensitivity problems. Thus the output of this parallel supervised attribute clustering is shown using the clustergram where red shades represents higher expression level, green shades represents lower expression level and the black shades represents the absence of differential expression values.
In microarray gene expression data sets, the class labels of samples are represented by discrete symbols, while the expression values of genes are continuous. Hence, to measure both gene-class relevance of a gene with respect to class labels and gene-gene redundancy between two genes using mutual information, the continuous expression values of a gene are usually divided into several discrete partitions. Thus a prior or marginal probabilities and their joint probabilities are then calculated to compute both gene-class relevance and gene-gene redundancy. In this paper, the discretization method is working to discretize continuous expression values in a parallel method.
D. Class Separability with Parallel GA
After the formation of finer cluster, three classifiers such as K-NN, NB and SVM are used to measure the accuracy of the generated clusters. The classification of different types of cancer is obtained based on their sample categories. The class separation between different classes is measured using the Class Separability Index. The Class Separability filter calculates the class separability of each feature using the Kullback-Leibler (KL) distance between histograms of feature values. For each feature there is one histogram for each class. The histograms are normalized dividing each bin count by the total number of elements to estimate the probability that the j-th feature takes a value in the i-th bin of the histogram given a class n,
p d
j(
i c
|
n
)
. For each feature j, we calculate the class separability as,j 1 1
( , )
c c j m nm n
where c is the number of classes and δj(m,n) is the KL distance between histograms corresponding to classes m and n:
1
(
|
)
( , )
(
|
) log
(
|
)
b i j j j ip d
i c
m
m n
p d
i c
m
p d
i c
n
where b is the number of bins in the histograms. The features are then sorted in descending order of the distances ∆j.
Inorder to achieve class separation at higher rate, the class separability index should attain lower optimum value. Thus to get the optimum value, PGA is used. As much good the optimal solution obtained, that much higher the class separation will improve. Hence the test dataset is given and the entire step is proceeded to get the optimal gene.
J o u r n a l o f A d v a n c e s i n c h e m i s t r y
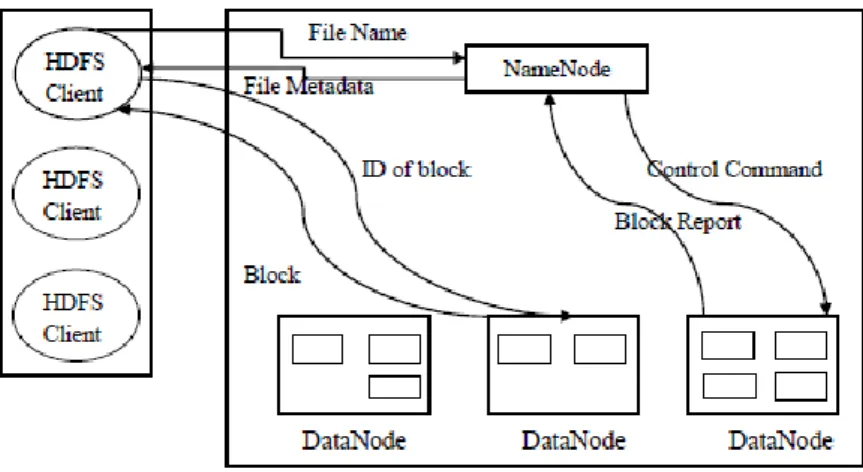
E. Access Mechanism of HDFS
Figure 3 Access mechanisms of HDFS
Figure 3 shows the access mechanism of HDFS. A HDFS is file system component of Hadoop. HDFS has master/slave architecture. An HDFS cluster consists of single namenode, a master server and many datanodes, called slaves in the architecture. The HDFS stores file system metadata and application data separately. In HDFS, files are broken into fixed-sized blocks (64 MB by default), which are stored as independent units. Each block is replicated to a small number of separate machines for fault tolerance. HDFS adopts direct client access mechanism to achieve high bandwidth. When HDFS clients read data from HDFS, they firstly query NameNode for file metadata, and then perform actual I/O operations with relevant DataNodes to retrieve data.
IV. RESULTS & ANALYSIS
The datasets are obtained from the Kent-Ridge Bio-medical data center. This provides three cancer datasets such as Breast Cancer, Leukemia and Colon Cancer, and two arthritis datasets such as Rheumatoid Arthritis versus Osteoarthritis (RAOA) and Rheumatoid Arthritis versus Healthy Controls.
1) Breast Cancer: The breast cancer training data contains 98 patient samples, 44 of which are from patients who had developed distance metastases within 7 years, the rest 54 samples are from patients who are healthy from the disease after their initial treatment for interval of at least 7 years. Correspondingly, there are 14 relapse and 8 non-relapse samples in the testing data set.
The number of genes is 34481. We replaced NaN type symbol in original ratio data with 100.0.
2) Leukemia: Training dataset consists of 48 bone marrow samples (37 ALL and 11 AML), over 8129 probes from 7817 human genes. Also 34 samples testing data is provided, with 30 ALL and 14 AML.
3) Colon Tumor: The colon cancer contains 72 samples collected from colon-cancer patients. Among them, 50 tumor biopsies are from tumors are labelled as negative and 22 normal are labelled as positive biopsies are from good and healthy parts of the colons of the same patients. Two thousand out of around 7500 genes were selected based on the confidence in the measured expression levels.
Fig 2. Clustergram
Using MATLAB, from the results in figure 2 it is analysed that the proposed algorithm finds the genes affected by cancer efficiently.
J o u r n a l o f A d v a n c e s i n c h e m i s t r y
V. CONCLUSION
This paper presents a parallel supervised attribute clustering algorithm for cancer classification using microarray experiments. The PGA selects the optimal feature from the clusters and increases the class separability which improves the classification and predictive accuracy of each and every cell. The proposed algorithm is potentially helful in the context of medical findings as it identify groups of interact genes that have high expressive power for given tissue types, and which in turn can accurately predict the class labels of new samples. Thus the performance is calculated using three classifiers such as KNN, NB and SVM to predict the accuracy.
REFERENCES
[1] W. H. Au, K. C. C. Chan, A. K. C. Wong and Y. Wang , “Attribute Clustering for Grouping , Selection, and Classification of Gene Expression Data”, IEEE/ACM Trans. Computational Biology and Bioinformatics, Vol. 2, No. 2, pp. 83-101, Apr-Jun 2005.
[2] M. Dettling and P. Buhlmann, “Supervised Clustering of Genes”, Genome Biology, Vol.3, No. 12, pp.0069.1-0069.15,2002.
[3] P. A. Devijver and J. Kittler, “Pattern Recognition: A Statistical Approach”, Prentice Hall,1982.
[4] E. Domany, “Cluster Analysis of Gene Expression Data”, J.Statistical Physics, Vol.110, Nos. 3-6, pp. 1117-1139, 2011.
[5] T. R. Golub, D. K. Slonim, P. Tamayo and C. Huard, “Molecular Classification of Cancer: Class Discovery and Class Prediction by Gene Expression Monitoring”, Science, Vol. 286, No. 5439, pp. 531-537, 1999.
[6] D. Huang and T. W. S. Chow, “Effective Feature Selection Scheme Using Mutual Information”,
Neurocomputing, Vol.63, pp.325-343, 2004.
[7] Lei Wang, “Feature Selection with Kernel Class Separability”, IEEE Trans.Pattern Analysis and Machine Intelligence, Vol. 30, No., 9, 2008.
[8] J. Li, H. Su, H. Chen and B. W. Futscher, “Optimal Search-based Gene Subset Selection for Gene Array Cancer Classification”, IEEE Trans. Biomedical Eng., Vol. 56, No .4, pp. 1063-1069, 2009. [9] Pradipta Maji, “Fuzzy-Rough Supervised Attribute Clustering Algorithm and Classification of Microarray
Data”, IEEE Trans. Cybernetics., Vol. 41, No.1, 2011.
[10] Sheng-Bo Guu., Michael Lyu R. and Tat-Ming Lok, „Gene Selection Based on Mutual Information for the Classification of Multi-class Cancer‟, Science, Vol 134, 2004.
[11] Pradipta Maji., Mutual information based supervised Attribute clustering for microarray sample classification., IEEE transaction on Knowledge and data Engineering., Vol 24,No.1, Jan2012.
[12] P.Aarthi, E.Gothai “Enhancing Sample Classification for Microarray datasets using Genetic Algorithm”, International Conference on Information Communication & Embedded Systems (ICICES 2014)
[13] Apache. Org. Hadoop distributed file system. http://hadoop.apache.org. [14] Apache Hadoop, http://www.cloudera.com/hadoop/
[15] Borthakur D. (2007), „The hadoop distributed file system: architecture and design‟, Hadoop Project Website
[16] P.Aarthi, E.Gothai, “Improving Class Separability for Microarray datasets using Genetic Algorithm with KLD Measure”, International Journal of Engineering Science and Innovative Technology (IJESIT) Volume 3, Issue 2, March 2014.