16
Approach of Capacity Planning Through Linear Programming Technique:
A Practice in Textile Enterprise
Ayhan YALÇINSOY
1Mustafa ZİNCİRKIRAN
2Hidayet TİFTİK
31 Dicle University, Diyarbakır, Türkiye
PhD Student in Dicle University
2 Dicle University, Diyarbakır, Türkiye
Assistant Professor in Dicle University
3 Turgut Ozal University, Ankara, Türkiye,
PhD Lecturer in Turgut Ozal University
ABSTRACTThis study aims to put forth the benefits of linear programming technique, which is one of the quantitative decision-making techniques, for the most efficient use of established business capacities. In order to achieve this aim, capacity planning is carried out in a textile enterprise in Istanbul.
A market limitation model is developed for optimum use of capacity on the basis of the enterprise’s data of the last three years. According to the model, it is determined that the cutting, ironing and packaging units of the enterprise operate with idle capacity and provide a profit of 29,618,370 Euros. However, a new model has been developed and analyzed in order to ensure that the enterprise manufactures its own products, which are mainly sewed by contract manufacturing. According to the proposed model, it is seen that the enterprise has doubled its profit by increasing it to 57,905,430 Euros.
Keywords: Linear Programming, Capacity Planning
Corresponding Author: Ayhan YALÇINSOY
INTRODUCTION
Today’s rapidly developing technology and global competition atmosphere has turned to a threat on the assets of enterprises. In order to survive in this atmosphere, enterprises are obliged to use their capacities at the optimum level. In this regard, enterprises should use scientific methods both in the stage of foundation and in their new capacity plans and select the best capacity level. Capacity, which have an influence on the structure of costs, efficiency of resources, level of technology used, stocks and requirements of labor force should be capable of meeting the current and future needs.
In capacity planning, managers should discuss the factors that have an impact on the internal and external capacity. Particularly the successive systems should be operated in compliance with their capacities. In this extent, it is important to eliminate the straits among systems and make idle capacities usable. Linear programming method, which is one of the digital decision-making techniques, is also used in the determination of such straits and idle capacities.
17 Enterprises carry out their productions in frame of a certain plan and schedule in order to
efficiently use their resources and increase their profits. Linear programming technique is one of the methods used in the solution of the problems of production planning or capacity planning. Effective use of time and achievement of optimum capacity level are important in terms of business administration today.
In this research, it is attempted to make a capacity planning through linear programming technique by using a textile enterprise’s data of the last four years. According to the model, it is determined that the cutting, ironing and packaging units of the enterprise operate with idle capacity and provide a low profitability. In this regard, a new model has been developed and analyzed in order to ensure that the enterprise manufactures its own products, which are mainly sewed by contract manufacturing. According to the proposed model, it is seen that the enterprise has doubled its profitability. Moreover, the local and foreign researches about linear programming are reviewed and evaluated in this research.
1. CAPACITY PLANNING
Capacity is a concept corresponding to the quantity of goods that an enterprise is capable of producing, number of passengers that a ferry is capable of transporting, working hours of a worker, number of units produced by a machine etc. (Tekin, 2012:223). Production capacity of an enterprise is the production quantity that the enterprise is capable of realizing by using the available production factors in a rational manner within a certain period of time (Güneçıkan, 2008:2). Capacity planning begins in the foundation stage of an enterprise and requires persistence. Decisions of capacity planning consist of the following activities (Bulut, 2004);
a. Determination of the current capacity level b. Estimation of the future capacity level
c. Determination of the factors that may influence capacity
d. Financial, economic and technological evaluation of capacity alternatives e. Selection of the capacity that fits the purposes of the enterprise
The concept of capacity is evaluated in two stages in the short and long term. In the short term, enterprise managers make a prediction about the capacity level to be achieved by carrying out production with all available production factors (Tekin, 1997:9). Amounts of production factors required for current and future capacity level may be calculated. In the long term, it is considerably difficult to determine the amount of production factors required for the target capacity level due to the uncertainties in technology and market (Tekin, 2012:226).
1.1. Types of Capacity
Oluç defines capacity as the power of an enterprise to produce goods and services (Ekodialog.com, 2009). Theoretic Capacity, Practical Capacity, Actual Capacity and Optimum Capacity are the most commonly used types of capacity.
Theoretic capacity is the maximum output that the machines and equipment used for production in an enterprise is capable of producing by means of qualified labor force (Tekin, 1997:13). On the other hand, Yıldıztekin defines theoretic capacity as the maximum product amount that an enterprise is capable of producing in the short term (Yıldıztekin, 2010:198). Various production losses may occur during production for a number of reasons such as
18 expected and named as functioning interruption (Şimşek and Çelik, 2011:97). Practical capacity is found by excluding functioning interruptions from the theoretical capacity.
Actual capacity is the part of the production amount obtain in a certain time, which is sold in case of adequate demand (Tekin, 2012:233).
The ratio of practical capacity to the actual capacity is called as operation degree (capacity use ratio). Decreases in the capacity use ratio address to a stagnation in the economy and increases address to an expansion in the economy (Arabacı and Arabacı, 2008:94). Operation degree may be calculated with the following formula;
Operation Degree acity acticalCap city ActualCapa = Pr
If the operation degree is equal to 1, it means that the enterprise produces with full capacity. If the operation degree is higher than 1, it means that actual capacity is higher than the practical capacity and close to maximum capacity level. If the operation degree is lower than 1, it means that there is a deficiency in the capacity use.
It is impossible for enterprises to work in full capacity due to reasons like power cuts, strikes and lockouts, lack of demand (Kaya et al., 2009:314). The time in which no operation is carried out or which is wasted due to the mentioned reasons is called idle capacity.
Optimum capacity is defined as the annual production volume which provides the enterprise with the facility to work with minimum average unit cost. The enterprise's production capacity away from the optimum capacity production unit per variable and fixed costs have been increasing (Tekin, 2012: 233-234).
1.2. Capacity Selection
Capacity should be selected in a way to respond to the changes in the current and future capacity in consideration of the factors like demand, financial resources, factory location, technical facilities, working hours, enterprise management, costs and technology. Decisions regarding the capacity selection may be realized through the following processes (Tekin, 2012:250);
a. Determination of the increase in economic capacity b. Determination of the number of economic shifts
c. Determination of the production capacity fitting to the seasonal demand
d. Determination of the amounts of inputs like semi-finished products, operating supplies etc. to be purchased from other enterprises
e. Preparation of a capacity plan in compliance with the technological developments and unexpected situations
2. LINEAR PROGRAMMING
W.W. Leontief developed the input-output analysis in line with the current Linear Programming model in 1930 and Hitchcock and T.C. Koopmans developed the Linear Programming model in order to provide a solution for transportation problems in the years between 1930 and 1940 (Tekin, 2010: 52). Today’s linear programming model was developed by G. B. Dantzig (Alptekin, quoted by Bircan and Kartal, 2003:132). Purpose of Linear Programming is to select the best option among lots of options (Esin, 1998:24-298).
19 When the international literature is reviewed, it is seen that Linear Programming model has
been used for long years in the fields of math, medicine, statistics and business administration. Besides basic mathematical approaches, calculation of the optimum output, capacity planning and use in administrative and industrial practices are included in the researches. (Markowitz, 1957; Hanssmann and Hess, 1960; Charness and Cooper, 1961; Hadley; 1962; Dantzig, 1965; Simmonard and Jewel, 1966; Khachiyan, 1980; Saul, 1982; Ferrier and Lovell, 1990; Ghodsypour and O'brien, Richard, 1996; 1998; Candes and Tao, 2005).
In consideration of researches in our country, linear programming model is used in different disciplines and industries. Agricultural enterprises, dairy and livestock breeding enterprises, forestry product management, construction sector, textile sector, furniture sector, transportation sector and energy sector may be given as examples. These researches mostly focus on issues like optimum production or production planning for the enterprise or the sector Karagöz, 1988; İnan, 1992; Yavuz, 1992; Paksoy, 2001; Keleş 2003; Karahalil, 2003; Bircan and Kartal, 2004; Kayalıdere and Kargın, 2004; Güneş, 2004; Büyükkeklik, 2007; Patır, 2009; Yılmaz, 2010; Ergülen and Kazan, 2012).
There are two solution methods in Linear Programming, which are graphical solution method and simplex solution method (Halaç, 1995:363-410). Graphical solution method is used in the solution of Linear Programming problems with three variables (Tekin, 2010:58) and simplex solution method is used in the solution of Linear Programming problems with more than three variables (Tekin, 2010, 62).
According to simplex method, firstly the mathematical model is established and then the variables are added to the inequalities in the model and an equality is obtained and formulated. After that, objective function and constraints are placed in the simplex table (Özkan, 2012:7-83. Constraints show that the labor force, machines and other resources held by the decision makers are limited (Esin, 1998:24-298).
Linear programming technique is based on the following assumptions (Tekin 2010: 57): a) Objective function and constraints should be properly defined. It should be clearly
specified whether the purpose is profit maximization or cost minimization. b) Variables must be expressible in figures.
c) Variables must be associated with each other. d) Resources to be used must be limited.
e) Relations between variables must be linear.
f) The opportunity of alternative selection among variables must be available. g) The problem to which linear programming is to be applied must be short-term. h) Dependent variables must be zero or positive.
There are three factors to be taken into consideration in the theoretical structure of linear programming: objective function, constraints and positivity condition (Paul, 2008:9-115). These are;
xj: Decision variables (like production or cost amounts), cj: Unit profit or cost coefficient,
bi: Resource capacity, aij: Technical coefficient
Generally, theoretical structure of a linear programming problem may be as follows:
n = j CjXj = Z 120 i n = j ijxj b a
1(I = 1,2, ..., m) Constraints (≥, may also be =) x j ≥ 0
( j = 1, 2, ... ,n ) Positivity Condition.
Theoretical model of Linear Programming is shown as follows by means of matrix notation: C1n: Matrix of the coefficient line of target equation
Xn1: Matrix of the decision variables column Amn: Matrix of the constraint coefficients Bm1: Matrix of the capacity column Z = CX AX ≤ B model, X ≥ 0 X1 X2 Z = CX = [ c1 c2 . . . cn] . . Objective Function . . Xn
a11 a12. . . a1n X1 ≥ b1 a21 a22 . . . a2n X2 b2
. . . . . . . = . Constraints . . . . . . . . .
. . . . . . . ≤ . am1 am2 . . . amn Xn bm x1 , x2 , ... xn ≥ 0 Positivity Condition.
3. CAPACITY PLANNING THROUGH LINEAR PROGRAMMING
Programming problems are related to the effective distribution or use of poor resources in order to meet the needs (Gass, 2003:3). Stunning developments in technology provides modern enterprises with facilities of information gathering and problem solving.
Considering two enterprises, which have same amount of capacity or machines, process same amount and quality of raw materials, have employees with same level of experience and knowledge, it is seen that one of them has a more productive and profitable production activity (Bircan and Kartal, 2003:132). In other words, the reason behind this difference in results, despite the fact that there is no difference in production factors, is the difference in the achievement of optimum results among enterprises.
Linear Programming is generally used as a mathematical model by many managers and mathematicians in the solution of enterprise problems (Özkan, 2012). Mixture problems,
21 task distribution problems, capacity loading problems, production programming problems, purchase problems, investment problems and transportation problems are some of the problems solved by means of Linear Programming models (Teknik 2010).
4. THE PRACTICE OF DETERMINING THE UNITS CAUSING STRAITS AND IDLE CAPACITIES IN A TEXTILE ENTERPRISE
This study focuses on the solution of capacity planning problem by means of quantitative decision-making method, determination and elimination of straits in main production units in established industrial enterprises. A textile company engaged in women outerwear in Istanbul is selected as the place of practice. Data obtained from this factory are analyzed with WinQSB program.
4.1. Textile Production Process
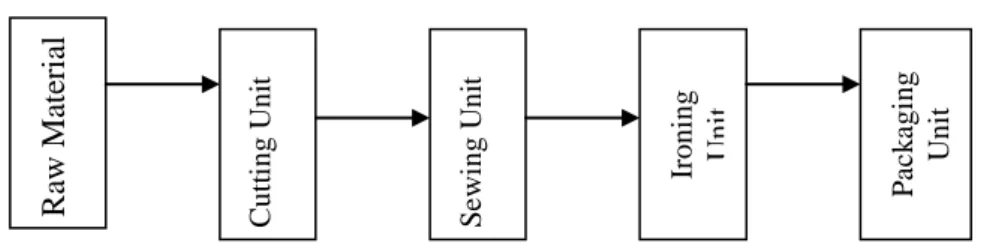
In the textile factory, fabrics procured from domestic and foreign suppliers are stocked in warehouses and meters and fabric errors are measured by means of fabric control machines. Data obtained are conveyed to the Model unit. In the light of this information, the model unit makes the necessary calculations according to the clothes in the model and notifies the cutting unit and planning departments of the obtained information. The planning department calculates cutting-production losses and informs cutting, sewing, ironing and packaging units about the output. Bar codes in the number of pieces calculated is distributed to the departments. Each department swipes the bar code of the produced product by means of a bar code device and thus product tracking is performed. In line with the instructions, the warehouse delivers fabrics and consumables (interlining, lining, pocketing, felt, fiber, thread) to the cutting unit by writing batch numbers and by means of transpalets. Model unit informs the cutting unit about the mold to be used and the cutting unit cuts fabrics with such mold. After the cutting process, fabric pieces are conveyed to the sewing unit to be sewed and then sent to the ironing unit through a rail system. After ironing is completed, products are delivered to the packaging unit. Following the completion of packaging process, products are sorted according to their destination and shipped.
Work flow chart of the textile enterprise, production process of which is summarized, is given in the Figure 1.
Figure 1. Work Flow Chart of the Enterprise
R aw Ma te ri al S e w ing U ni t Cut ti ng U ni t P a c k a gi ng U ni t Ironi ng U ni t
22
4.2. Main Production Units 4.2.1. Raw Material Unit
The fabrics and consumables required for textile production are procured from Istanbul, Bursa, Gaziantep and Adana in the country and imported from Germany, China, France and Holland out of the country. Therefore, there is no limitation in terms of raw material for the production. Fabrics stored in the storage unit are put through shrinkage, rubbing, wing and barré (fabric dye quality) tests. Furthermore, storage is not considered as a constraint as the warehouses are large enough (15000m2).
4.2.2. Cutting Unit
Molds prepared in the model unit where the product design is made, which do not have a direct influence on production, and mold information are given to the cutting unit that has an area of 7500m2. The cutting unit places the molds and lays on the fabrics delivered by the warehouse in line with work orders and customs. Plaid fabrics are cut with a hand motor by virtue of their properties. Flat fabrics are cut by means of a computed-aided cutting system. The cut fabrics are marked with a marking method, indicating the pieces to be sewed to each other. After this process, pieces to be interlined are processed in 2 interlining machines and other pieces are directly conveyed to the sewing unit by means of transpalets. Due to capacity deficiency in the sewing unit, a part of the fabrics is sent to the respective workshops for contract sewing.
4.2.3. Sewing Unit
Fabrics, which are put through the required processes in the cutting unit, are sewed on 8 bands consisting of 140 sewing machines. Button-buttonhole works are also performed by this unit. After going through all the processes, products are taken to the ironing unit in 20-piece cases by means of transpalets. The sewing unit has an area of 150000m2, but the area used is only 500m2.
4.2.4. Ironing Unit
The sewed products are sorted according to the ironing degree as those to be ironed with hand iron and those to be ironed with press iron. There are 30 hand irons and 30 press irons in this unit. Ironing unit has an area of 7500 m2. Last checks are performed after the ironing process and the faulty products are either sent to sewing unit or ironing unit according to the source of defect. Faultless products are sent to the packaging unit by means of a rail system with a suspender.
4.2.5. Packaging Unit
Sewed and ironed products, which are ready to be used, are conveyed to the packaging unit that is located on the same floor and has an area of 7500 m2. Packaging is performed in two ways: the first one is suspended packaging process by means of automatic machine and the other is hand packaging. Bard codes are affixed to the products and they are sorted according to their sizes in this unit. As the enterprises is engaged in export, packages are sorted according to the countries and shipped.
23
4.3. Products Manufactured in the Enterprise
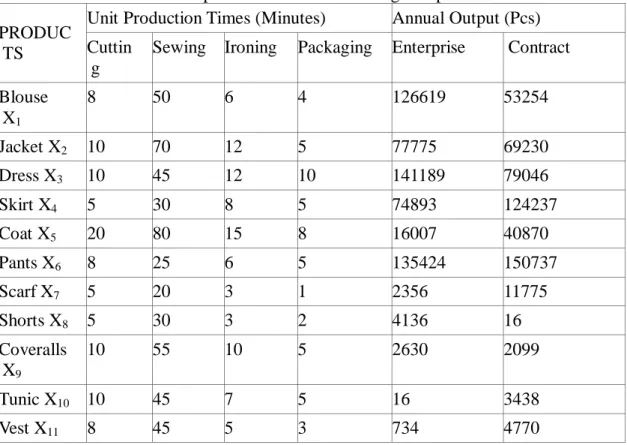
The enterprise manufactures the products in the Table 1 upon order. The cutting, sewing, ironing and packaging times specified in the table are based on the experience from previous years.
Table 1: Production times of products and annual average output PRODUC
TS
Unit Production Times (Minutes) Annual Output (Pcs) Cuttin
g
Sewing Ironing Packaging Enterprise Contract Blouse X1 8 50 6 4 126619 53254 Jacket X2 10 70 12 5 77775 69230 Dress X3 10 45 12 10 141189 79046 Skirt X4 5 30 8 5 74893 124237 Coat X5 20 80 15 8 16007 40870 Pants X6 8 25 6 5 135424 150737 Scarf X7 5 20 3 1 2356 11775 Shorts X8 5 30 3 2 4136 16 Coveralls X9 10 55 10 5 2630 2099 Tunic X10 10 45 7 5 16 3438 Vest X11 8 45 5 3 734 4770 4.4. Determination of Constraints
Right-side constants: They are found by utilizing the annual average working hours of main production units. One-year average virtual working hours, which are calculated on the basis of the enterprise data, are shown below in minutes.
Cutting Sewing Ironing Packaging
10,108,800 23,587,200 8,424,000 6,739,200
Technical coefficients: Constraint coefficients are related to the determination of the capacities of main production units by the products manufactured. These technical coefficients are obtained from the production reports of the enterprise, covering the period as from 2010 to the end of 2013.
4.4.1. Cutting Unit Technical Coefficients: Cutting times of each product are given in the Table 1. Accordingly, cutting constraint equation is found as;
8x1+10x2+10x3+5x4+15x5+8x6+5x7+5x8+10x9+10x10+8x11 ≤ 10.108.800
4.4.2. Sewing Unit Technical Coefficients: Sewing times of each product are given in the Table 1. Accordingly, cutting constraint equation is found as;
24
4.4.3. Ironing Unit Technical Coefficients: Sewing times of each product are given in the Table 1. Accordingly, cutting constraint equation is found as;
6x1+12x2+12x3+8x4+15x5+6x6+3x7+3x8+10x9+7x10+5x11 ≤ 8.424.000
4.4.4. Packing Unit Technical Coefficients: Sewing times of each product are given in the Table 1. Accordingly, cutting constraint equation is found as;
4x1+5x2+10x3+5x4+8x5+5x6+1x7+2x8+5x9+5x10+3x11 ≤ 6.739.200 4.5. Determination of Objective Function Coefficients
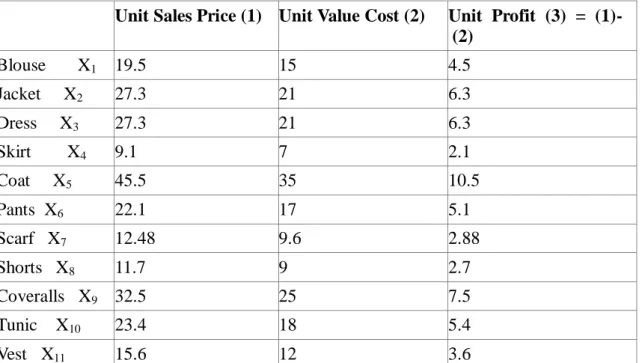
Consistency of the Linear Programming model to be established for capacity planning is proportional to the accuracy of unit profits to be used as coefficient in the objective function. Product sales prices received from the enterprise and variable cost and profit values are given in Euros in Table 2.
Table 2: Unit Profits of Products
Unit Sales Price (1) Unit Value Cost (2) Unit Profit (3) = (1)-(2) Blouse X1 19.5 15 4.5 Jacket X2 27.3 21 6.3 Dress X3 27.3 21 6.3 Skirt X4 9.1 7 2.1 Coat X5 45.5 35 10.5 Pants X6 22.1 17 5.1 Scarf X7 12.48 9.6 2.88 Shorts X8 11.7 9 2.7 Coveralls X9 32.5 25 7.5 Tunic X10 23.4 18 5.4 Vest X11 15.6 12 3.6
According to this data, the objective function that maximizes the enterprise’s profit will be as follows;
Zmax = 4,5x1 + 5,1x2 + 6,3x3 + 2,1x4 + 10,5x5 + 5,4x6
4.6. Linear Programming Model
Total product sales amounts and annual average sales amounts of the enterprises between the years 2010-2013 are given in Table 3.
Table 3: Annual Products Sales Average
PRODUCT 2010 2011 2012 2013 Total Average
Blouse X1
179,865 179,865 179,865 179,865 719,492 179,865
25 Dress X3 220,230 220,245 220,225 220,240 880,940 220,235 Skirt X4 199,136 199,132 199,120 199,132 263,508 199,130 Coat X5 65,882 65,870 65,873 65,883 263,508 65,877 Pants X6 286,151 286,170 286,158 286,165 1,144,644 286,161 Scarf X7 14,121 14,133 14,142 14,128 56,524 14,131 Shorts X8 4,159 4,157 4,142 4,150 16,608 4,152 Coveralls X9 4,730 4,729 4,721 4,736 18,916 4,729 Tunic X10 3,456 3,455 3,449 3,456 13,816 3,454 Vest X11 5,501 5,507 5,505 5,503 22,016 5,504
Linear programming model (Table 4) is developed under the light of the foregoing information.
Positivity Condition;
x1, x2, x3, x4, x5, x6, x7, x8, x9, x10, x11 ≥ 0 Table 4: Linear Programming Model
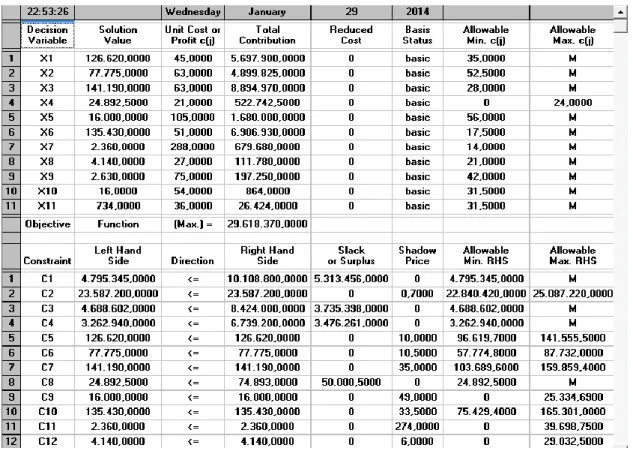
The model developed is analyzed by means of WinQSB computer software and optimum solution values given in the Table 5 are obtained. Accordingly, the enterprise makes a profit of 29,618,370 Euros. However, when the capacities of units are examined, it is seen that sewing unit works with full capacity and cutting unit works with an idle capacity of 5,313,456 hours, ironing unit works with an idle capacity of 3,737,398 hours and packaging unit works with an idle capacity of 3,476,261 hours. Moreover, a large part of the products, cutting of which is completed in the sewing unit, are put through contract sewing. Therefore, it is possible to claim that the sewing unit constitutes a strait.
26 Table 5: Solution of the Model
It is suggested that, when the strait caused by the lack of capacity in the sewing unit, the idle capacity in other units will become usable. For this purpose, 7 bands 115 machines should be added to the currently existing 8 bands 140 machines in the sewing unit. Cutting unit has enough area for this expansion. No additional cost will be needed in terms of building and facility. In this case, annual operating capacity of the sewing unit will be 42,962,400 hours. The new linear programming model is shown in the Table 6.
27 In the new model, the enterprise will become capable of meeting the whole market demand.
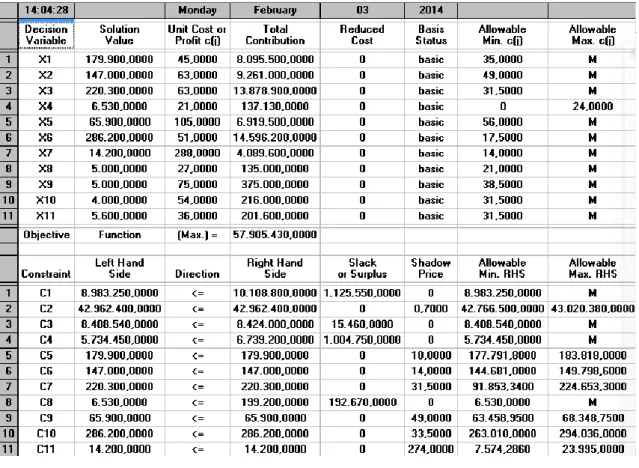
Table 7 Solution of the New Model
As seen in the Table 7, the enterprise will be capable of manufacturing the products, that are sent for contract sewing, and profit of the enterprise will increase to 57,905,430 Euros. Sewing unit works with full capacity and at a level to meet demands, while cutting unit works with an idle capacity of 1,092,900 hours, ironing unit works with an idle capacity of 15,460 hours and packaging unit works with an idle capacity of 1,004,750 hours.
DISCUSSION AND CONCLUSIONS
Textile sector is one of the most important export items of Turkey. Enterprises should work with optimum capacity to subsist in global markets. In this context, all the production processes of the enterprise should be efficiently carried out.
The enterprise produced blouses, jackets, dresses, skirts, coats, pants, scarfs, shots, coveralls, tunics and vests in the production period between 2010-2013. A large part of the products are put through contract sewing. The enterprise exports all its products.
A market limitation model is developed for optimum use of capacity on the basis of the enterprise’s data of the last three years. In this solution, it is seen that the cutting, ironing and packaging units of the enterprise works with idle capacity and the enterprise makes a profit of 29,618,370 Euros. However, a new model has been developed and analyzed in order to ensure that the enterprise manufactures its own products, which are mainly sewed by contract manufacturing. In this new solution, the enterprise has doubled its profitability by increasing its profit 57,905,430 Euros. The idle capacity in cutting, ironing and packaging units has decreased, but still exists. If the enterprise chooses to assign the workers to work for the new bands to be established from the cutting, ironing and packaging units, the idle capacity will be eliminated and the available labor force will be used more efficiently. Thus, the enterprise will expand the sewing unit by receiving less external labor force and reduce
28 costs. Alternative and different models may be developed in consideration of the results of the sensitivity analysis of this model, statuses in the main production units and new market restrictions.
REFERENCES
[1] Arabacı, Ö. ve Arabacı, R. (2008). Kapasite Kullanım Oranları ve Enflasyon İlişkisi: Türkiye Örneği. Uludağ Üniversitesi. İktisadi ve İdari Bilimler Fakültesi Dergisi. Cilt:27, Sayı:2, 93-109.
[2] Bircan, H. ve Kartal, Z. (2003). Doğrusal Programlama Tekniği ile Kapasite Planlaması Yaklaşımı ve Çimento İşletmesinde Bir Uygulaması. Cumhuriyet Üniversitesi. İktisadi ve İdari Bilimler Dergisi. Cilt:5, Sayı:1, 131-149.
[3] Bulut, Z.A. (2004). İşletmeler Açısından Kapasite Planlaması ve Kapasite Planlamasına Etki Eden Faktörler. Mevzuat Dergisi. Yıl:7, Sayı:80. Erişim Tarihi: 14 Aralık 2013, http://www.mevzuatdergisi.com/2004/08a/06.htm
[4] Büyükkeklik, M. (2007). Üretim Planlama Problemlerinde Doğrusal Programlama Modellerinin Kullanımı: Bir Üretim şletmesinde Uygulama. Yüksek Lisans Tezi, NÜ Sosyal Bilimler Enstitüsü, Niğde.
[5] Candes, E. J., & Tao, T. (2005). Decoding by linear programming. Information Theory, IEEE Transactions on, 51(12), 4203-4215.
[6] Charnes, A., & Cooper, W. W. (1961). Management models and industrial applications of linear programming [by] A. Charnes [and] WW Cooper (Vol. 1). John Wiley & Sons.
[7] Dantzig, G. B. (1965). Linear programming and extensions. Princeton university press. [8] Ekodialog.com.(2009). Erişim Tarihi: 25 Aralık 2013. http://www.ekodialog.com/
isletme_ekonomisi/isletme_kapasite_planlamasi_2.html
[9] Ergülen, A., & Kazan, H. (2012). Taşımacılık Sektörünün İşleyiş Süreci, Bulanık Dağıtım Probleminin Tamsayılı Doğrusal Programlama Model Denemesi. Uluslararası Yönetim İktisat ve İşletme Dergisi, 3(6), 109-126.
[10] Esin, A. (1998). Yöneylem Araştırmasında Yararlanılan Kantitatif Yöntemler. Ankara: Gazi Üniversitesi. Yayın Nu:128, S.24-298.
[11] Ferrier, G. D., & Lovell, C. K. (1990). Measuring cost efficiency in banking: econometric and linear programming evidence. Journal of econometrics, 46(1), 229-245. [12] Gass, S.I. (2003). Linear Programming Methods And Applications (Fifth Edition).
Erişim Tarihi: 14 Ocak 2014.
http://books.google.com.tr/books?id=dDIMnAntgUsC&printsec=
frontcover&hl=tr&source=gbs_ge_summary_r&cad=0#v=onepage&q&f=false
[13] Ghodsypour, S. H., & O'brien, C. (1998). A decision support system for supplier selection using an integrated analytic hierarchy process and linear programming. International journal of production economics, 56, 199-212.
[14] Güneçıkan, Ö. (2008) “Kapasite Planlaması ve Optimim Stok Kontrolü Yönetimi” Kahramanmaraş Üniversitesi, Sosyal Bilimler Enstitüsü, Yayımlanmamış Yüksek Lisans Tezi, 2008
[15] Güneş, E. (2004). Tarım İşletmelerinde Kredi Taleplerinin Doğrusal Programlama Yöntemiyle Belirlenmesi “Kırşehir İli Merkez İlçesi Tarım İşletmeleri Araştırması”. Tarımsal Ekonomi Araştırma Enstitüsü Yayınları, Ankara.
[16] Hadley, G. (1962). Linear Programming
[17] Halaç, O. (1995). Kantitatif Karar Verme Teknikleri (Yöneylem Araştırması). İstanbul: Melissa Matbacılık. S.363-410.
[18] Hanssmann, F., & Hess, S. W. (1960). A linear programming approach to production and employment scheduling. Management Science, (1), 46-51.
29 [19] Heady, E. O., & Candler, W. (1963). Linear programming methods. Linear
programming methods.
[20] İnan, H. (1992). Tekirdağ ili süt sığırcılığı işletmelerinin doğrusal programlama yöntemi ile planlanması ve planlı çalışmanın işletme gelirine etkisi, Trakya Bölgesi I. Hayvancılık Sempozyumu, Hasat Yayıncılık (1992): 8-9.
[21] Khachiyan, L. G. (1980). Polynomial algorithms in linear programming. USSR Computational Mathematics and Mathematical Physics, 20(1), 53-72.
[22]Karagöz, M. (1988). Tam Sayılı Doğrusal Programlama Ve Maksan Uygulaması, Basılmamış Y. Lisans Tezi, Gazi Üniversitesi Fen Bilimleri Enstitüsü, Ankara.
[23] Kaya, A., Gülhan, Ü. ve Açık, S. (2009). İşçilik Giderlerinde Atıl Kapasitenin Durumu ve Muhasebeleştirilmesi. Atatürk Üniversitesi Sosyal Bilimler Enstitüsü Dergisi. Cilt:13, Sayı:2, 209-320.
[24] Kayalıdere, K., & Kargın, S. (2004). Çimento ve Tekstil Sektörlerinde Etkinlik Çalışması ve Veri Zarflama Analizi. Dokuz Eylül Üniversitesi, Sosyal Bilimler Enstitüsü Dergisi, 6(1), 196-219.
[25] Keleş, S. (2003). Ormanların Su ve Odun Üretimi Fonksiyonlarının Doğrusal Programlama Tekniği İle Optimizasyonu (Karanlıkdere Planlama Birimi Örneği). Yüksek Lisans Tezi, KTÜ Fen Bilimleri Enstitüsü, Trabzon, 96s.
[26] Markowitz, H. M. (1957). The elimination form of the inverse and its application to linear programming. Management Science, 3(3), 255-269.
[27] Özkan, Ş. (2012). Yöneylem Araştırması, Nicel Karar Teknikleri. Ankara:Nobel Kitabevi. S.7:83.
[28] Paksoy, A. G. M. (2001). Tarım İşletmelerinin Doğrusal Programlama Yöntemiyle Planlanmasında Bilgisayar Paket Programlarının Kullanılması. Tarımda Bilişim Teknolojileri, 4.
[29] Patir, S. (2009). Tam Sayılı Programlama ve Malatya Maksan Transformatör İşletmesinde Bir Uygulama, Ataturk University Journal of Economics & Administrative Sciences, 23(1)
[31] Richard B. D., (1991) Introduction to Linear Programming, Marcel Dekkar Inc., New York.
[32] Saul I. G., (1982) Linear Programming, McGraw-Hill, New York.
[33] Simonnard, M., & Jewell, W. S. (1966). Linear programming. In Linear programming. Prentice-Hall.
[34] Şimşek, M.Ş. ve Çelik, A. (2011). İşletme Bilimlerine Giriş. Konya: Eğitim Kitabevi. [35] Tekin, M. (1997). Konya Sanayi Bölgesi Küçük ve Orta Ölçekli İşletmelerde Kapasite
Kullanımı Araştırması. Karaman: S.U. İktisadi ve İdari Bilimler Fakültesi Yayınları Nu:1 [36] Tekin, M. (2010). Sayısal Yöntemler. (7. Baskı). Konya: Günay Ofset. S.54-95 [37] Tekin, M. (2012). Üretim Yönetimi. (8. Baskı). Konya: Günay Ofset. S.223-253.
[38] Yavuz, O.(1992). "Erzurum merkez ilçede alternatif finansman kaynakları ile sığır besiciliği yapan işletmelerin doğrusal programlama yöntemiyle ekonomik analizi." Tarım Ekon. Derg 1.1 (1992): 69.
[39] Yılmaz, H. (2010). Doğrusal programlama tekniği ile üretim planlamasının mobilya sektöründe uygulanması, Süleyman Demirel Üniversitesi, Sosyal Bilimler Enstitüsü, Yayımlanmamış Yüksek Lisans Tezi
[40] Yıldıztekin, İ. (2010). Aşırı Kapasite Kontrolü ve Maliyet Analizi. Atatürk Üniversitesi İktisadi ve İdari Bilimler Dergisi. Cilt: 24, Sayı: 3.