Procedia Computer Science 95 ( 2016 ) 264 – 271
1877-0509 © 2016 The Authors. Published by Elsevier B.V. This is an open access article under the CC BY-NC-ND license (http://creativecommons.org/licenses/by-nc-nd/4.0/).
Peer-review under responsibility of scientific committee of Missouri University of Science and Technology doi: 10.1016/j.procs.2016.09.332
ScienceDirect
Complex Adaptive Systems, Publication 6
Cihan H. Dagli, Editor in Chief
Conference Organized by Missouri University of Science and Technology
2016 - Los Angeles, CA
Evaluating Forecasting Methods by
Considering Different Accuracy Measures
Nijat Mehdiyev
a,b, David Enke
c*,Peter Fettke
a,b, Peter Loos
a,baInstitute for Information Systems (IWi). German Research Center for Artificial Intelligence (DFKI), Campus D3 2, 66123 Saarbrücken, Germany bSaarland University, Campus D3 2, 66123 Saarbrücken, Germany
cDepartment of Engineering Management and System Engineering, Missouri University of Science and Technology, Rolla, MO, 65409-0370, USA
Abstract
Choosing the appropriate forecasting technique to employ is a challenging issue and requires a comprehensive analysis of empirical results. Recent research findings reveal that the performance evaluation of forecasting models depends on the accuracy measures adopted. Some methods indicate superior performance when error based metrics are used, while others perform better when precision values are adopted as accuracy measures. As scholars tend to use a smaller subset of accuracy metrics to assess the performance of forecasting models, there is a need for a concept of multiple accuracy dimensions to assure the robustness of evaluation. Therefore, the main purpose of this paper is to propose a decision making model that allows researchers to identify the superiority of a forecasting technique over another by considering several accuracy metrics concurrently. A multi-criteria decision analysis approach, namely the preference ranking organization method for enrichment evaluation (PROMETHEE), was adopted to solve this problem. Bayesian Networks, Artificial Neural Networks, SVMs, Logistic Regression, and several Rule and Tree-based forecasting approaches were included in the analysis. After introducing a detailed description of accuracy measures, the performance of the prediction models are evaluated using a chosen dataset from the UCI Machine Learning Repository. © 2016 The Authors. Published by Elsevier B.V.
Peer-review under responsibility of scientific committee of Missouri University of Science and Technology. Keywords: Classification, Accuracy Measure, Confusion Matrix, MCDA, PROMETHEE
* Corresponding author. Tel.: +1-573-341-4749
E-mail address: [email protected]
© 2016 The Authors. Published by Elsevier B.V. This is an open access article under the CC BY-NC-ND license (http://creativecommons.org/licenses/by-nc-nd/4.0/).
1. Introduction
Forecasts serve a crucial need in making rational decisions and planning activities more precisely by handling uncertainty about the future. Efficient prediction is considered as an important perquisite for effective administration and organization in various fields of social, information, human and natural sciences, and related application areas. To deal with the growing variability and complications associated with the domain specific forecasting problems, diverse forecasting methods have been proposed. Decision makers have to consider various aspects of the prediction process, such as the length of forecasting horizon, the goal of forecasting, frequency, structure and nature of the data, etc., when deciding on a forecasting algorithm.
In order to estimate the performance of forecasting methods, in the last three decades various accuracy measures have been adopted by many studies as an evaluation criterion. A number of different forecast accuracy measures for both regression and classification problems have been proposed, and the comments and recommendations on the use of the relevant measures have been intensively discussed in prior studies1-5. Such accuracy measures provide
necessary and decisive feedback to decision makers for calibrating and refining the model in an effort to improve the preciseness of outcomes6. However, research findings suggest that there is no best overall accuracy measure which
can be used as a universally accepted single metric for choosing the appropriate forecasting method2. Forecasting
approaches can realize extremely different performances depending on the chosen metric. Empirical evaluations reveal that some approaches are superior when error based measures are adopted, while others perform better for the same dataset when different metrics are utilized6.
On these grounds, we can argue that there is a need for a framework to evaluate the forecasting methods considering various accuracy metrics concurrently. In this paper we propose a framework that is assumed to cater to the need for a unique assessment measure that assures a robust comparability of classification methodologies. With this paper we extend the research in forecasting accuracy measurement domain by integrating another important Management Science discipline, namely Multi-Criteria Decision Analysis (MCDA).
The remainder of the paper is structured as follows: Section 2 provides an overview into the steps of proposed MCDA based framework, namely, the related work in the domain of classification accuracy measures and mathematical background of the selected metrics (Section 2.1), a brief description of selected classification methods (Section 2.2), and the details of the selected MCDA approaches, PROMETHEE I and II (Section 2.3). Section 3 presents the performance evaluation of selected approaches and their rankings both in terms of each individual accuracy measure and multidimensional assessment using the MCDA framework. The paper concludes with a discussion of the study implications and future research directions.
2. Proposed Framework
The primary goal of the underlying paper was defined as the evaluation and ranking of competing algorithms for multi-class classification tasks in terms of multiple accuracy criteria. Xu7 and Ouenniche8 have proposed MCDA
frameworks based on PROMETHEE, ELECTRE, and Data Envelopment Analysis (DEA) methods to assess the performance of forecasting problems for regression problems. Accuracy measures for classification problems with nominal output structure differ significantly from those for regression problems. Peng et al.9 and Khanmohammadi
and Rezaeiahari10 proposed MCDA frameworks to evaluate the classification algorithms. However, they used single
accuracy measure and computational costs as comparison criteria. To the best of our knowledge no prior studies have addressed the multidimensional performance analysis of rival classification algorithms. The next subsections will provide an overview to the selected accuracy measures, alternatives, and the details of PROMETHEE approaches.
2.1. Accuracy Measures
Comparative analysis of classification algorithms is a complicated process since various dimensions of assessment have to be considered. Prior studies suggest that the performance evaluation can be carried out by virtue of statistical tests, performing qualitative analysis by discussing drawbacks and advantages of approaches, or by conducting quantitative analysis using diverse evaluation measures which capture different aspects of classifiers
performance11. The main focus of the underlying paper is quantitative comparison of methods based on performance
measures, which are mainly expressed in terms of model accuracy. However, identification of such appropriate accuracy measures is another issue as they capture different aspects of model performance.
Substantial research has been devoted to analysis and discussion of accuracy measures for binary and multiclass classification problems. Sokolova and Lapalme4, Jurman and Furlanello11, Labatut and Charifi12 and Felkin13
provided a comprehensive overview to mathematical formulation of various classification accuracy measures, conducted a systematic analysis, and discussed their relevancy for problems with diverse perquisites. After criticizing these accuracy evaluation metrics by claiming that they propagate the marginal prevalence and biases, Powers5 proposed new probabilistic measures that are assumed to overcome their shortcomings. Moreover, a vast
amount of studies investigated the characteristics and applicability of individual accuracy measures14-20 for binary
and multiclass classification problems and analyzed the correlation and relationship among them21, 22. The metrics in
all these studies were derived from the confusion matrix and will be referred as “confusion matrix measures” in the underlying paper.
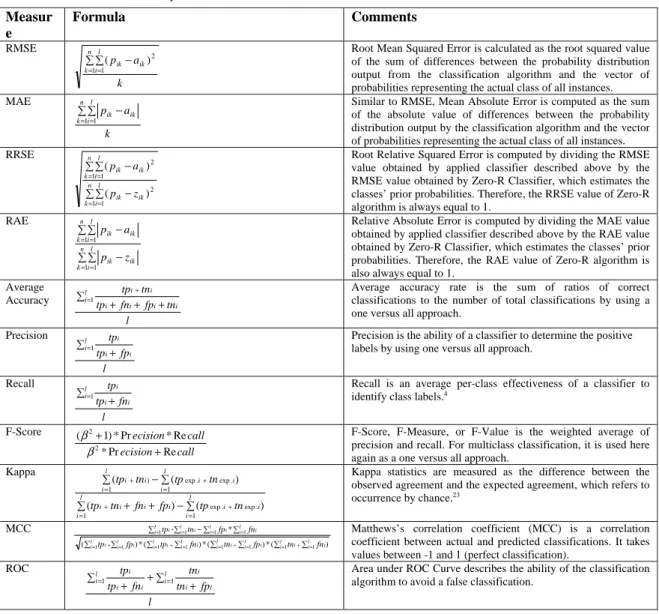
Table 1. Accuracy Measures
Measur e Formula Comments RMSE k a p n k l i ik ik ¦ ¦ − = =1 1 2 ) (
Root Mean Squared Error is calculated as the root squared value of the sum of differences between the probability distribution output from the classification algorithm and the vector of probabilities representing the actual class of all instances. MAE k a p n k l i ik ik ¦ ¦ − = =1 1
Similar to RMSE, Mean Absolute Error is computed as the sum of the absolute value of differences between the probability distribution output by the classification algorithm and the vector of probabilities representing the actual class of all instances. RRSE ¦ ¦ − ¦ ¦ − = = = = n k l i ik ik n k l i ik ik z p a p 1 1 2 1 1 2 ) ( ) (
Root Relative Squared Error is computed by dividing the RMSE value obtained by applied classifier described above by the RMSE value obtained by Zero-R Classifier, which estimates the classes’ prior probabilities. Therefore, the RRSE value of Zero-R algorithm is always equal to 1.
RAE ¦ ¦ − ¦ ¦ − = = = = n k l i ik ik n k l i ik ik z p a p 1 1 1 1
Relative Absolute Error is computed by dividing the MAE value obtained by applied classifier described above by the RAE value obtained by Zero-R Classifier, which estimates the classes’ prior probabilities. Therefore, the RAE value of Zero-R algorithm is also always equal to 1.
Average Accuracy l tn fp fn tp tn tp l i i i i i i i ¦ + + + =1 +
Average accuracy rate is the sum of ratios of correct classifications to the number of total classifications by using a one versus all approach.
Precision l fp tp tp l i i i i ¦ + =1
Precision is the ability of a classifier to determine the positive labels by using one versus all approach.
Recall l fn tp tp l i i i i ¦ + =1
Recall is an average per-class effectiveness of a classifier to
identify class labels.4
F-Score call ecision call ecision Re Pr * Re * Pr * ) 1 ( 2 2 + + β
β F-Score, F-Measure, or F-Value is the weighted average of
precision and recall. For multiclass classification, it is used here again as a one versus all approach.
Kappa ) ( ) ( ) ( ( 1 . exp . exp 1 1 . exp . exp 1 ) ¦ − + + ¦ ¦ − ¦ = + = + = + = + l i i i i i l i i i l i i i l i i i tn tp fp fn tn tp tn tp tn
tp Kappa statistics are measured as the difference between the observed agreement and the expected agreement, which refers to
occurrence by chance.23 MCC ) ( * ) ( * ) ( * ) ( * 1 1 1 1 1 1 1 1 1 1 1 1 * ¦ ¦ ¦ ¦ ¦ ¦ ¦ ¦ ¦ ¦ − ¦ ¦ = + = = + = = + = = = + = = = = l i l i i i l i l i i i l i l i i i l i i l i i l i i l i i l i i l i i fn tn fp tn fn tp fp tp fn fp tn
tp Matthews’s correlation coefficient (MCC) is a correlation
coefficient between actual and predicted classifications. It takes values between -1 and 1 (perfect classification).
ROC l fp tn tn fn tp tp l i i i i l i i i i ¦ + + ¦ + = =1 1
Area under ROC Curve describes the ability of the classification algorithm to avoid a false classification.
Witten and Elbe24 suggest that machine learning approaches can also assign the probabilities to class prediction
and this information can also to be taken into account when judging the performance of algorithms. Assume that a classification method predicts the correct class label with significantly higher probability than an alternative competing approach. Both algorithms predict the outcomes correctly; the superiority of the first method will be neglected by not considering the information on likelihood estimation. In order to prevent such situations, Witten and Elbe24 adapted the typical regression specific error based accuracy to classification performance evaluation. The
appropriateness of such “error measures” is heavily dependent on the application. The decision makers can only be interested in the correctness of the predicted label. A realistic assessment of the likelihood of predictions may not play a role. In such cases the users can fully rely on the selected “confusion matrix measures” and disrespect the “error measures”. On the other hand, the error measures can provide crucial information if the further judgmental forecasting or cost analysis are required. Existence of such a heterogeneity in classification accuracy measures and the need for preference articulation by decision makers confirm again the necessity of applying a multidimensional framework for judging the performance of competing methods.
Table 1 summarizes the most widely applied accuracy measures that are derived from the studies discussed above. Mathematical formulation and related explanatory notes are provided as well. We will use these 11 accuracy measures categorized into two groups, “error measures” and “confusion matrix measures” in our analysis, concurrently, in order to conduct the performance ranking of classification algorithms.
2.2. Classification Algorithms
Although a number of classification approaches with diverse features have been proposed for last three decades and successfully implemented in various application domains, none of them has found universal acceptance for all application scenarios. The success of algorithms depends significantly on the nature (quality) of selected features and underlying data (stationary vs. non-stationary, linearity vs. nonlinearity, noise, imbalanced classes, seasonality, errors in data collection, reciprocal dependency of features, sampling frequency, etc.)25. As an example, Support
Vector Machines (SVM) and Artificial Neural Networks (ANN) outperform other methods when dealing with multidimensional and continuous features, whereas rule-induction approaches and decision trees are superior in handling discrete features26. Some algorithms require a large sample size, while others can also perform relatively
better with smaller dataset. In their comparative analysis of classification algorithms on multiple datasets from pattern recognition domain, Amancio27 revealed that adjusting the parameter configurations within algorithms also
lead to significantly different performances. Considering all these premises, a subset of classification algorithms with proper settings have to be identified, followed by performing a set of relevant data pre-processing measures carefully and examining the relevancy of algorithms for the given conditions. Once the list of relevant classification methods is defined, the multidimensional evaluation framework proposed in the underlying paper can be applied to determine their ranking.
In order to ensure the replication ability of our empirical findings, we conducted the comparative analysis of eleven widely applied classification algorithms26, 28 from open source WEKA software29 in a user knowledge
modelling dataset30, which is publicly available in UCI Machine Learning Data Repository. Artificial Neural
Networks (ANN), multinomial Logistic Regression, Random Forest, Support Vector Machines, Repeated Incremental Pruning to Produce Error Reduction (RIPPER), Fuzzy Unordered Rule Induction Algorithm (FURIA), K-nearest Neighbor (KNN), Radial Basis Network (RBF), Bayesian Network with Genetic Search (BN), C4.5 Decision Trees, and Naïve Bayes were defined as appropriate methods for classifying the knowledge degree of users. As mentioned above, the proposed MCDA based framework for performance evaluation is applicable for assessing the suitability of any other classification algorithms for diverse application domains and scenarios. The list of accuracy measures can also be enhanced or reduced due to the preferences of decision makers.
2.3. PROMETHEE
Once the list of relevant evaluation criteria (accuracy measures) and alternatives (classification algorithms) is determined, the chosen MCDA approach, PROMETHEE in our case, can be applied to conduct the ranking of competing algorithms by performing pairwise comparisons in terms of accuracy measures. Ease of interpretation
and use, plausibility of underlying algorithm, flexibility, effectiveness in handling uncertainty, ability to provide complete and robust rankings, and availability of software with user friendly GUI are just a few of factors that favor the use of PROMETHEE in our paper. Introduced by Brans31 and extended by Brans and Vincke32, the
PROMETHEE approach is one of the most widely applied MCDA methods belonging to the outranking family. Several other versions of this approach were also proposed to handle more sophisticated decision making problems33. The main idea of PROMETHEE method is providing the partial (PROMETHEE I) and complete
ranking of alternatives (PROMETHEE II) considering several conflicting factors by measuring the deviations between the scores of alternatives in terms of each individual criterion, eliminating the scale effects and removing the factors with an inappropriate level of significance to the problem. The implementation steps of PROMETHEE method can be described as follows:
Step 1: Determine the amplitude of deviations, ,between two alternatives using pair-wise comparison in terms of each criterion ሺ•ሻ:
ሺǡሻൌሺሻǦሺሻ ሺͳሻ
Step 2: Apply the selected preference function ሺǡሻאሾͲǡͳሿ to evaluate the preference of alternative of “” to alternative “” on factor as follows:
ሺǡሻൌ ሾሺǡሻሿǡאሺʹሻ
ሺ•ሻ denotes the type of the preference function used for the criterion Ǥ Six different versions of preference
functions, namely, (i) Usual criterion, (ii) U-shape criterion, (iii) V-shape criterion, (iv) level criterion, (v) V-shape with indifference criterion and (vi) Gaussian criterion were proposed by Brans and Vincke32. Depending on the
choice of preference function, additional information such as threshold values of p (strict preference) and q (indifference) are required from decision makers.
Step 3: Compute the overall preference indices Ɏሺǡሻ which are defined as the weighted sum of preference values for each factor:
Ɏሺǡሻൌσሺǡሻǡאሺ͵ሻ
where indicates the weight of criterion ǤThis aggregated index provides information to the extent of preference
of alternatives over others.
Step 4: Define the positive Ȱሺሻ and negative outranking ȰǦሺሻ outflows using the following formulas:
ȰሺሻൌͳȀǦͳσɎሺǡሻሺͶሻ
ȰǦሺሻൌͳȀǦͳσɎሺǡሻሺͷሻ
Ȱሺሻ indicates to what degree the alternative is outranking other alternatives while ȰǦሺሻ shows the extent
alternative is outranked by alternatives. The higher positive outlier ranking flow and the lower negative outranking flow, the more preferred the alternative. PROMETHEE I partial rankings are derived using the intersections of positive and negative outranking flows.
Step 5: Determine the PROMETHEE complete ranking by calculating net outranking flow as follows:
ȰሺሻൌȰሺሻǦȰǦሺሻሺሻ
When net outranking flows are computed, all alternatives are comparable. Such information helps decision makers to conduct a complete ranking of alternatives but the resulting ranking may miss some important aspects as considering only the difference leads to loss of information. Therefore, Brans33 recommends to consider both
PROMETHEE I and II results when comparing the alternatives.
A comprehensive literature analysis conducted by Behzadian34 provides a gainful insight to more than 200
applications of PROMETHEE approach in 100 different journals and suggests that the popularity of this method has been increasing for the last few years. This trend can also be explained with its user friendly mathematical and application features, ease in conception, and provided sensitivity aspects.
3. Empirical Results
To examine the relative performance of classification methods in the context of multiple accuracy evaluation measures, we used the “User Knowledge Modelling Data Set”, which evaluates the knowledge level of users by incorporating various variables describing various aspects of users’ domain knowledge. This particular real-world data set, presented by Kahraman et al.30, was selected for illustration purposes. In this paper, a 10-fold-cross
validation approach was used to evaluate the performance of the algorithms. It is worth mentioning that the proposed multi-criteria based evaluation framework is generic in the sense that its application is independent of the selected classification problem with diverse data structure, forecasting horizon, and objectives. In this section we present the ranking of classification approaches in terms of each pre-defined individual criterion. We then report the ranking obtained from the proposed MCDA framework based on PROMETHEE I and II.
Table 2. Performance of Classification Methods
Accuracy Kappa MAE RMSE RAE RRSE Precision Recall F-Value MCC ROC
Log. Regression 91.32% 0.881 0.058 0.159 0.199 0.415 0.909 0.913 0.911 0.892 0.993 Random Forest 91.32% 0.880 0.059 0.156 0.202 0.408 0.909 0.913 0.909 0.887 0.992 ANN 92.80% 0.902 0.042 0.150 0.145 0.393 0.929 0.928 0.928 0.912 0.991 RBF 90.82% 0.874 0.044 0.164 0.150 0.429 0.907 0.908 0.907 0.887 0.983 BN 86.10% 0.811 0.084 0.203 0.288 0.531 0.870 0.861 0.864 0.830 0.963 Naïve Bayes 84.86% 0.792 0.094 0.223 0.322 0.582 0.854 0.849 0.848 0.805 0.952 SVM 85.11% 0.789 0.247 0.328 0.842 0.856 0.804 0.851 0.813 0.783 0.951 RIPPER 86.60% 0.816 0.067 0.211 0.227 0.551 0.863 0.866 0.864 0.828 0.949 FURIA 89.08% 0.849 0.049 0.197 0.167 0.514 0.883 0.891 0.884 0.860 0.946 C 4.5 87.59% 0.831 0.055 0.210 0.187 0.548 0.878 0.876 0.877 0.844 0.937 KNN 80.15% 0.728 0.082 0.279 0.281 0.730 0.798 0.801 0.799 0.739 0.873
Table 2 summarizes the values for each accuracy measure obtained from 11 classification techniques applied to the user knowledge modelling data and provides the corresponding rankings. As there is no standard or “best” accuracy measure to evaluate the performance of the model, rankings vary depending on the chosen accuracy metric. For example, the Multinomial Logistic Regression method outperforms all others approaches in terms of area under ROC Curve measure, whereas ANN and Random Forest approaches outrank this method in terms of Accuracy and RMSE measures. A comparative analysis of classification performances provided by selected algorithms easily reveals such variations across rankings as provided in Table 2. These inconsistencies complicate the decision making for choosing the right method, which is the main motivator of this paper. The proposed multidimensional framework in this paper performs pairwise comparisons of alternatives in terms of each criterion and allows the user to articulate their preferences and priorities by setting the desired weights for criteria and defining the indifference and preference thresholds. For initial experiments, we assigned an equal weight vector (1:1) for “error based measures” and “confusion matrix metrics” and adopted “usual” preference function to include our priorities.
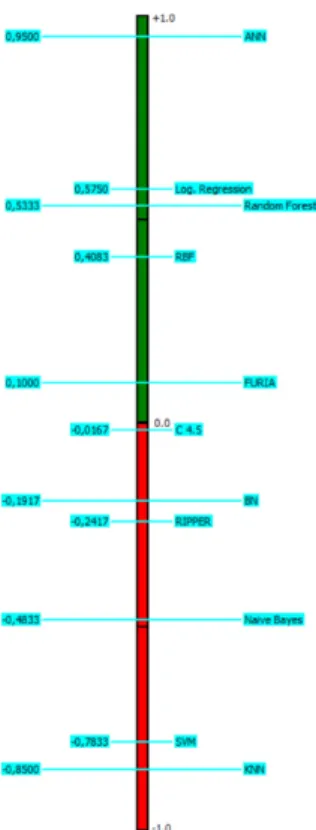
Fig. 1 presents the partial (a) and complete rankings (b) of examined classification methods, respectively. As mentioned above, PROMETHEE I introduces information both on negative and positive outflow rankings. Brans and De Smet33 imply that both flows can induce different rankings. In our case the rankings from both negative and
positive outflow rankings are identical. Therefore, the complete ranking obtained from PROMETHEE II has the same order as partial rankings and the information loss doesn’t occur when considering the difference between positive and negative outranking flows. According to empirical results in the given settings, the ANN method outperforms other approaches significantly by getting the highest net outranking flow value, 0.9500. This approach is followed by Multinomial Logistic Regression (0.5750), Random Forest (0.5339), RBF (0.4083), and FURIA (0.1000) methods, which obtain positive net outranking flows. The worst performances were shown by the KNN and SVM approaches with net outranking flow of -0.8500 and -0.7833, respectively.
a.) b.)
Fig. 1. Rankings of Classification Methods based on (a) PROMETHEE I; (b) PROMETHEE II Approaches.
In order to check the robustness of rankings, we have conducted the experiments by using diverse versions of the weight vectors ((1:2); (2:1); (2:3); (3:2)) for “error measures” and “confusion matrix measures”. The findings suggest that such variations affect the values of net outranking flows, but no significant changes in the ranking of algorithms are observed. Another possibility to conduct a sensitivity analysis is the changing the preference functions and the values of related preference and indifference thresholds. Results suggest that the differences in preference articulations lead to a different ranking of algorithms.
4. Conclusion
In this paper we proposed a multidimensional framework to evaluate the algorithms for multiclass classification problems after introducing the relevant accuracy measures, characteristics of algorithms, and steps of chosen MCDA approach. This approach provides more robust rankings than one-dimensional analysis due to its ability to consider the various types of information provided by different accuracy metrics concurrently, and includes the preferences of the decision makers. Sensitivity analysis features provided by the system also allow the users to analyze different scenarios by adjusting diverse parameters. The potential future research direction in this area is to further improve the multidimensional framework by going beyond accuracy measures. Considering the experience in predictive modelling, expectation, and motivation of decision makers and the characteristics of application domain, diverse aspects of classification algorithms such as ease of use, ease of interpretation of results, development cost, computational costs, timeliness, flexibility, handling uncertainty, and integral data pre-processing, among others, can be included to the comparative analysis. This type of analysis would provide more tailored results.
Acknowledgements
This research was funded in part by the German Federal Ministry of Education and Research under grant number 01IS12050 (project PRODIGY) and 01IS14004A (project iPRODICT).
References
1. Makridakis S. Accuracy measures: theoretical and practical concerns. International Journal of Forecasting 1993; 9(4):527-529.
2. Mahmoud E. Accuracy in forecasting: A survey. Journal of Forecasting 1984; 3(2):139-159.
3. Hyndman RJ, Koehler AB. Another look at measures of forecast accuracy. International Journal of Forecasting 2006; 22(4):679-688.
4. Sokolova M, Lapalme G. A systematic analysis of performance measures for classification tasks. Information Processing & Management
2009;45(4):427-437.
5. Powers DM. Evaluation: from precision, recall and F-measure to ROC, informedness, markedness and correlation. 2011.
6. Armstrong JS, Collopy F. Error measures for generalizing about forecasting methods: Empirical comparisons. International journal of
forecasting 1992; 8(1):69-80.
7. Xu B, Ouenniche J. Performance evaluation of competing forecasting models: A multidimensional framework based on MCDA. Expert
Systems with Applications 2012; 39(9):8312-8324.
8. Ouenniche J, Xu B, Tone K. Forecasting Models Evaluation Using A Slacks-Based Context-Dependent DEA Framework. Journal of
Applied Business Research 2014; 30(5):1477.
9. Peng Y, Kou G, Wang G, Shi Y. FAMCDM: A fusion approach of MCDM methods to rank multiclass classification algorithms. Omega
2011;39(6):677-689.
10. Khanmohammadi S, Rezaeiahari M. AHP based Classification Algorithm Selection for Clinical Decision Support System Development.
Procedia Computer Science 2014; 36: 328-334.
11. Jurman G, Furlanello C. A unifying view for performance measures in multi-class prediction. arXiv preprint arXiv:10082908 2010.
12. Labatut V, Cherifi H. Accuracy measures for the comparison of classifiers. arXiv preprint arXiv:12073790 2012.
13. Felkin M. Comparing classification results between n-ary and binary problems. Quality Measures in Data Mining. Springer, 2007, 277-301.
14. Pencina MJ, D'Agostino RB, Vasan RS. Evaluating the added predictive ability of a new marker: from area under the ROC curve to
reclassification and beyond. Statistics in medicine 2008; 27(2):157-172.
15. Mohri C. Confidence intervals for the area under the ROC curve. Advances in Neural Information Processing Systems Curran Associates
2005:305.
16. Landgrebe TC, Duin RP. Approximating the multiclass ROC by pairwise analysis. Pattern Recognition Letters 2007;28(13):1747-1758.
17. Hand DJ. Measuring classifier performance: a coherent alternative to the area under the ROC curve. Machine Learning 2009; 77(1):
103-123.
18. Cohen J. Weighted kappa: Nominal scale agreement provision for scaled disagreement or partial credit. Psychological Bulletin 1968; 70(4):
213.
19. Provost FJ, Fawcett T. Analysis and visualization of classifier performance: comparison under imprecise class and cost distributions. KDD
1997;97: 43-48.
20. van Rijsbergen C. Information Retrieval. 1979. Butterworth, 1979.
21. Davis J, Goadrich M. The relationship between Precision-Recall and ROC curves. Proceedings of the 23rd International Conference on
Machine learning 2006:233-240.
22. Cleverdon CW. On the inverse relationship of recall and precision. Journal of documentation 1972; 28(3):195-201.
23. Mehdiyev N, Krumeich J, Enke D, Werth D, Loos P. Determination of rule patterns in complex event processing using machine learning
techniques. Procedia Computer Science 2015; 61: 395-401.
24. Witten IH, Frank E. Data Mining: Practical machine learning tools and techniques. Morgan Kaufmann, 2005.
25. Enke D, Mehdiyev N. A New Hybrid Approach For Forecasting Interest Rates. Procedia Computer Science 2012; 12: 259-264.
26. Kotsiantis SB, Zaharakis I, Pintelas P. Supervised machine learning: A review of classification techniques. 2007.
27. Amancio DR, Comin CH, Casanova D, Travieso G, Bruno OM, Rodrigues FA et al. A systematic comparison of supervised classifiers.
PloS one 2014; 9(4):e94137.
28. Wu X, Kumar V, Quinlan JR, Ghosh J, Yang Q, Motoda H et al. Top 10 algorithms in data mining. Knowledge and information systems
2008;14(1):1-37.
29. Hall M, Frank E, Holmes G, Pfahringer B, Reutemann P, Witten IH. The WEKA data mining software: an update. ACM SIGKDD
explorations newsletter 2009; 11(1):10-18.
30. Kahraman HT, Sagiroglu S, Colak I. The development of intuitive knowledge classifier and the modeling of domain dependent data.
Knowledge-Based Systems 2013; 37: 283-295.
31. Brans J. L’ingenierie de la décision. Elaboration d’instruments d'aide a la décision. Méthode PROMETHEE,[in:] R. Nadeau, M. Landry.
L'aide a la decision: Nature, Instruments et perspectives d’Avenir 1982:183-213.
32. Brans J-P, Vincke P. Note—A Preference Ranking Organisation Method: (The PROMETHEE Method for Multiple Criteria
Decision-Making). Management science 1985; 31(6):647-656.
33. Brans J-P, De Smet Y. PROMETHEE Methods. Multiple Criteria Decision Analysis. Springer, 2016, 187-219.
34. Behzadian M, Kazemzadeh RB, Albadvi A, Aghdasi M. PROMETHEE: A comprehensive literature review on methodologies and