Erwin V. Zaretsky
Glenn Research Center, Cleveland, Ohio
Emanuel V. Branzai
IRB Associates, Inc., Brea, California
Rolling-Bearing Service Life Based on
Probable Cause for Removal—A Tutorial
NASA/TM—2017-219545
NASA STI Program . . . in Profi le
Since its founding, NASA has been dedicated to the advancement of aeronautics and space science. The NASA Scientifi c and Technical Information (STI) Program plays a key part in helping NASA maintain this important role.
The NASA STI Program operates under the auspices of the Agency Chief Information Offi cer. It collects, organizes, provides for archiving, and disseminates NASA’s STI. The NASA STI Program provides access to the NASA Technical Report Server—Registered (NTRS Reg) and NASA Technical Report Server— Public (NTRS) thus providing one of the largest collections of aeronautical and space science STI in the world. Results are published in both non-NASA channels and by NASA in the NASA STI Report Series, which includes the following report types: • TECHNICAL PUBLICATION. Reports of
completed research or a major signifi cant phase of research that present the results of NASA programs and include extensive data or theoretical analysis. Includes compilations of signifi cant scientifi c and technical data and information deemed to be of continuing reference value. NASA counter-part of peer-reviewed formal professional papers, but has less stringent limitations on manuscript length and extent of graphic presentations.
• TECHNICAL MEMORANDUM. Scientifi c and technical fi ndings that are preliminary or of specialized interest, e.g., “quick-release” reports, working papers, and bibliographies that contain minimal annotation. Does not contain extensive analysis.
• CONTRACTOR REPORT. Scientifi c and technical fi ndings by NASA-sponsored contractors and grantees.
• CONFERENCE PUBLICATION. Collected papers from scientifi c and technical
conferences, symposia, seminars, or other meetings sponsored or co-sponsored by NASA. • SPECIAL PUBLICATION. Scientifi c,
technical, or historical information from NASA programs, projects, and missions, often concerned with subjects having substantial public interest.
• TECHNICAL TRANSLATION. English-language translations of foreign scientifi c and technical material pertinent to NASA’s mission. For more information about the NASA STI
program, see the following:
• Access the NASA STI program home page at http://www.sti.nasa.gov
• E-mail your question to [email protected] • Fax your question to the NASA STI
Information Desk at 757-864-6500
• Telephone the NASA STI Information Desk at 757-864-9658
• Write to:
NASA STI Program Mail Stop 148
NASA Langley Research Center Hampton, VA 23681-2199
Erwin V. Zaretsky
Glenn Research Center, Cleveland, Ohio
Emanuel V. Branzai
IRB Associates, Inc., Brea, California
Rolling-Bearing Service Life Based on
Probable Cause for Removal—A Tutorial
NASA/TM—2017-219545
National Aeronautics and
Space Administration
Glenn Research Center
Cleveland, Ohio 44135
Prepared for the
69th Annual Meeting and Exhibition
sponsored by the Society of Tribologists and Lubrication Engineers (STLE)
Lake Buena Vista, Florida, May 18–22, 2014
Acknowledgments
The authors would like to acknowledge Timken Aerospace Bearing Repair, Los Alamitos California (formally Bearing Inspection, Inc.) for furnishing their rolling-element bearing repair (rework) history for the period January 2007 through December 2013.
Available from
Level of Review: This material has been technically reviewed by technical management.
NASA STI Program Mail Stop 148
NASA Langley Research Center Hampton, VA 23681-2199
National Technical Information Service 5285 Port Royal Road Springfi eld, VA 22161 703-605-6000
Rolling-Bearing Service Life Based on
Probable Cause for Removal—A Tutorial
Erwin V. Zaretsky*
National Aeronautics and Space Administration Glenn Research Center
Cleveland, Ohio 44135 Emanuel V. Branzai IRB Associates, Inc. Brea, California 92821
Summary
In 1947 and 1952, Gustaf Lundberg and Arvid Palmgren developed what is now referred to as the “Lundberg-Palmgren Model for Rolling Bearing Life Prediction” based on classical rolling-element fatigue. Today, bearing fatigue probably accounts for less than 5 percent of bearings removed from service for cause. A bearing service life prediction methodology and tutorial indexed to eight probable causes for bearing removal, including fatigue, are presented, which incorporate strict series reliability; Weibull statistical analysis; available published field data from the Naval Air Rework Facility; and ~224,000 rolling-element bearings removed for rework from commercial aircraft engines. Bearing service life, Lserv, can be benchmarked and calculated to the bearing fatigue life, L10,as follows:
L
serv=
X L
1m 10, where X is the number of bearings removed from service because of fatigue divided by the total of all bearings removed from service regardless of cause and m is the Weibull modulus of the bearings removed from service. The most conservative bearing L10 service life calculation is obtained assuming anexponential distribution where m = 1.1. Of the ~224,000 commercial engine bearings removed from service for rework, 1,977 or 0.88 percent were rejected because of fatigue. From the Naval Air Rework Facility bearing data, eliminating rolling-element fatigue as a cause for removal, the L10 service life of these bearings would increase by approximately 3 percent.
Introduction
In the first edition of his book, Ball and Roller Bearing Engineering, Palmgren (Ref. 1) defines “The Term (Bearing) LIFE” as follows:
“No bearing gives an unlimited length of service. If a ball or roller bearing is exposed to moisture or dirt, it may be rendered unserviceable due to rust (corrosion) or wear, after a period of service which obviously cannot be predicted. However, if it is effectively protected, well lubricated, and otherwise properly handled, all causes of damage are eliminated except one, the (rolling-element) fatigue of the material due to repeated stresses under rotation. The effect of this fatigue is the so-called flaking, which starts as a crack and develops into a spalled area on one or the other of the load carrying surfaces. Fatigue is, ultimately, unavoidable but the number of revolutions the bearing may make before flaking starts is a function of the bearing load.
The term ‘LIFE’ can therefore be given a more exact definition to mean that period of performance which is limited by (rolling-element) fatigue phenomena. Life is measured in number of revolutions of the bearing or the number of hours of operation at a certain speed of rotation. Individual bearings which are apparently identical and which operate under identical conditions may, however, have different lives…”
The L10 bearing fatigue life, or the time that 90 percent of a group of bearings will exceed without failing by rolling-element fatigue, is the basis for calculating bearing life and reliability today. Accepting this criterion means that the bearing user is willing in principle to accept that 10 percent of a bearing group will fail before this time and 90 percent will survive.
The rationale for using the L10 bearing service life was first laid down by Palmgren in 1924 (Ref. 2). He states as follows:
“The (material) constant C has been determined on the basis of a very great number of tests run under different types of loads. However, certain difficulties are involved in the determination of this constant as a result of service life demonstrated by the different configurations of the same bearing type under equal test conditions. Therefore, it is necessary to state whether an expression is desired for the minimum, (for the) maximum, or for an intermediate service life between these two extremes. In order to obtain a good, cost-effective result, it is necessary to accept that a certain small number of bearings will have a shorter service life than the calculated lifetime, and therefore the constants must be calculated so that 90 percent of all the bearings have a service life longer than that stated in the formula. The calculation procedure must be considered entirely satisfactory from both an engineering and a business point of view, if we are to keep in mind that the mean service life is much longer than the calculated service life and that those bearings that have a shorter life actually only require repairs by replacement of the part which is damaged first.”
Palmgren is perhaps the first person to advocate a probabilistic approach to engineering design and reliability. Certainly, at that time, engineering practice dictated a deterministic approach to component design. This approach by Palmgren was decades ahead of its time. What he advocated is designing for finite life and reliability at an acceptable risk (Ref. 3).
By the close of the 19th century, the rolling-element bearing industry began to focus on sizing of ball and roller bearings for specific applications and determining bearing life and reliability. However, before the 1924 work of Palmgren (Ref. 2), it would appear that rolling-element bearing fatigue testing was the only way to determine or predict the minimum or average life of ball and roller bearings. In 1896,
Stribeck (Ref. 4) in Germany began fatigue testing full-scale rolling-element bearings. In 1912, Goodman (Ref. 5) in Great Britain published formulas based on fatigue experiments that he began in 1896 to compute safe loads on ball and cylindrical roller bearings (Ref. 6).
To the best of the authors’ knowledge, a database that defines and/or determines the life and reliability of rolling-element bearings at the beginning of the 20th century, is not readily available. In 1914, the American Machinists’ Handbook and Dictionary of Shop Terms (Ref. 7), devoted six pages to rolling-element bearings that discussed bearing sizes and dimensions, recommended (maximum) loading, and specified speeds. The publication did not address the issue of bearing life. However, the qualitative lives of these bearings can be inferred from Reference 4 wherein Hess translated Stribeck’s work from German to English which was published in the 1907 Transactions of the American Society of Mechanical Engineers. Fay (Ref. 4) wrote a discussion to Hess’ presentation wherein he states as follows:
“The life of a ball bearing is dependent upon numerous considerations of design and upon the sizes used and the mode of application; but tests now under way in the establishment represented by the writer (Mr. Fay’s affiliation is not given) indicate that trouble can be expected well within 20,000 car miles from all but the finest products, even if the load is one-half the catalogue ratings. Of course plain bearings would fail long before this under the same load conditions. But the very best of ball bearings using the most appropriate grades of steel should survive 50,000 car miles.”
In his reply to Fay’s discussion Hess (Ref. 4)states as follows:
“Changes in design and fashion of automobiles are such as to make the amortization life certainly not over five years, so that their bearings should not require renewal inside of that time. Few cars will average 50 miles per day for 250 days per year or a total of 62,500 miles. I have in my possession bearings taken from a heavy touring car that has been roughly used in racing and hard driving; these, with a known record of 65,000 miles, show no evidence of deterioration. Other records on standard passenger steam railways are over 200,000 miles with no visible effect on the bearings.”
If
we
can assume a 1907 automobile tire diameter of 30 in. (76.2 cm), we can calculate the number of bearing revolutions for 65,000 mi of operation. This would suggest a life approximately equal to43,719,745 bearing outer-ringrevolutions for an automotive wheel bearing application at that time.If we further assume that the average speed of a 1907 automobile was 25 mph, the life of the bearing would be approximately 2600 h. Based on 20,000 mi operation, the bearing life would be 800 h. Accordingly, it can be reasonably assumed that in 1907, bearing lives ranged from less than 800 h to as much or greater than 2,600 h at outer-ringspeeds of 280 rpm. In terms of current bearing lives, these times are relatively low.
In 1910, the A.-B. Svenska Kullager-Fabriken (SKF) bearing company in Sweden began rolling-element bearing endurance testing(Ref. 8). These bearing fatigue tests became the basis of Palmgren’s 1924 published bearing life analysis (Ref. 2). In 1939, Weibull (Refs. 9 and 10), also of Sweden, published his theory of failure and the Weibull distribution function. Weibull was a contemporary of Palmgren and shared the results of his work with him. In 1947, Palmgren in concert with Lundberg, also of Sweden, using strict series reliability analysis, incorporated his previous work along with that of Weibull, benchmarked to pre-1940 SKF rolling-element bearing tests, to form a probabilistic analysis to calculate rolling-element (ball and roller) bearing life (Refs. 11 and 12). The Lundberg-Palmgren bearing life model is the basis for all contemporary bearing life calculations (Ref. 6).
Primary components limiting the life of gas turbine engines for aircraft application in the early 1950s were the ball and roller bearings used to support the main rotor shaft. At that time, the lives of these bearings were limited to approximately 300 h in aircraft turbine engine application. With improved bearing manufacturing and steel processing together with advanced lubrication technology, the potential improvements in bearing life can be as much as 80 times that attainable in the late 1950s or as much as 400 times that attainable in 1940 (Ref. 6).
Averbach and Bamberger (Ref. 13) examined approximately 200 bearing incidents of bearings removed from aircraft engine service for cause. “The initial damage to these bearings was produced by abrasive particles, dents, grinding scores, skidding, large carbides and corrosion pits.” There was no classical subsurface initiated spalling of any of the bearings reported. This would suggest that “classical rolling-element fatigue” is not a primary cause for bearing removal in aircraft turbine engine main rotor bearings. The issue becomes what the service lives of these bearings at a designated reliability are or the time at which these bearings are no longer fit for their intended application?
A review of aircraft bearing rejection criteria and causes was undertaken and reported in 1979 by Cunningham and Morgan at the Naval Air Rework Facility, Cherry Point, North Carolina, USA (Ref. 14). Their work is unique and, to the best of our knowledge, the only data of this type reported and available in the open literature. Their data were derived from three 80-day engineering samples taken during 1969, 1971, and 1977. Cunningham and Morgan (Ref. 14) concluded that rolling-element bearings “tend to fail at random intervals from corrosion, contamination, wear, or handling damage long before (rolling-element) fatigue initiates a spall.” It is reasonable to conclude that the bearing service life is less than the calculated bearing life from these data. Though no operating times are associated with the respective bearings associated with these data, it is possible to qualitatively associate a time related to each failure mode relative to the bearing calculated life.
In view of the aforementioned, the objectives of the work reported herein were to determine (1) Bearing service life, Lserv, as a function of the bearing fatigue life, L10
(2) Bearing life as a function of each probable cause for removal
(3) From commercial aircraft engine bearing field data, the percentage of rolling-element bearings removed for rolling-element fatigue
Nomenclature
IR inner ring LF life factor OR outer ring RE rolling element SKF Svenska Kullager-Fabriken VAR vacuum arc remelted VIM vacuum induction meltedSymbols
F probability of failure, fractional percent or percent
Fn probability of failure of a chain consisting of n links, fractional percent or percent
L life, cycles (stress cycles); inner- or outer-ring revolutions, h Lref reference life, inner- or outer-ring revolutions, h
Lserv bearing service life, inner- or outer-ring revolutions, h
Lβ characteristic life, (time at which 63.2 percent of a population will fail, or 36.8 percent will
survive), cycles (stress cycles), inner or outer-ring revolutions, h
Lµ location parameter or time below which no fatigue failure should occur, cycles (stress cycles), inner or outer-ring revolutions, h
m slope of the Weibull plot or Weibull modulus n number of independent components
P load, N or lb
S probability of survival
Sβ probability of survival characteristic life, (time at which 63.2 percent of a population will fail, or
36.8 percent will survive)
X number of bearings removed from service because of fatigue divided by all bearings remove from service regardless of cause, fractional percent
Statistical Method
Weibull Distribution Function
In 1939, Weibull (Refs. 9 and 10) developed a method and an equation for statistically evaluating the fracture strength of materials based upon small population sizes. This method can be and has been applied to analyze, determine, and predict the cumulative statistical distribution of fatigue failure or any other phenomenon or physical characteristic that manifests a statistical distribution. The dispersion in life for a group of homogeneous test specimens can be expressed by
μ µ μ 1 ln ln mln L L where L L ;0 S 1 S Lβ L − = < < ∞ ≤ ≤ − (1)
where Sis the probability of survival as a fraction (0 ≤ S ≤ 1); m is the slope of the Weibull plot; L is the life cycle (stress cycles); Lµ is the location parameter, or the time (cycles) below which no failure occurs; and Lβ is the characteristic life (stress cycles). The characteristic life is that time at which 63.2 percent of
a population will fail, or 36.8 percent will survive (Ref. 6).
The format of Equation (1) is referred to as a “three-parameter Weibull equation.” For most, if not all failurephenomenon, there is a finite time period under operating conditions when no failure will occur. In other words, there is zero probability of failure, or a 100 percent probability of survival, for a period of time during which the probability density function is nonnegative. This value is represented by the location parameter Lµ. Without a significantly large database, this value is difficult to determine with
reasonable engineering or statistical certainty. As a result, Lµ is usually assumed to be zero and
Equation (2) can be written as 1 ln ln mln L where 0 L ; 0 S 1 S Lβ = < < ∞ ≤ ≤ (2) This format is referred to as the “two-parameter Weibull distribution function.” The estimated values of the Weibull slope m and Lβ for the two-parameter Weibull analysis will not in general be equal to those
of the three-parameter analysis. As a result, for a given survivability value S, the corresponding value of life cycle L, will be similar but not necessarily the same in each analysis (Ref. 6).
By plotting the ordinate scale as lnln (1/S) and the abscissa scale as ln L, a two-parameter Weibull cumulative distribution will plot as a straight line, which is called a Weibull plot. Usually, the ordinate is graduated in statistical percent of specimens failed F, where F = [(1 – S) × 100]. Figure 1(a) is a generic Weibull plot with some of the values of interest indicated. Figure 1(b) is a Weibull plot of actual bearing fatigue data (Ref. 6).
Johnson (Ref. 15) developed methods for statistical data analysis utilizing the Weibull distribution function to define fatigue life population distribution.
Strict Series Reliability
If there are n independent components, each with a probability of the independent event (failure) not occurring equal to (1 – F), the probability of the event not occurring in the combined total of all
components can be expressed as
(
1−F)
n =exp− nf X( )
(3)Equation (3) gives the appropriate mathematical expression for the principle of the weakest link in a chain or, more generally, for the size effect on failures in solids. The application of Equation (3) is illustrated by a chain consisting of several links. Testing finds the probability of failure F at any load X applied to a “single” link. To find the probability of failure Fn of a chain consisting of n links, one must
assume that if one link has failed, the whole chain fails. That is, if any single part of a component fails, the whole component has failed. Accordingly, the probability of nonfailure of the chain (1 – Fn), is equal
to the probability of the simultaneous nonfailure of all the links. Thus,
(
)
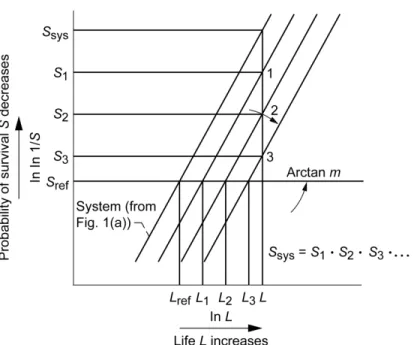
n n F F = − − 1 1 (4a) or n n S S = (4b)Referring to Figure 2, where the probabilities of failure (or survival) of each link are not necessarily equal (i.e., S1≠S2≠S3≠…), for the probability of survival of the chain as a system, Equation (4b) can be expressed as
sys 1 2 3 ...
S =S S S⋅ ⋅ ⋅ (4c)
Again referring to Figure 2, substituting appropriate values of the probability of survival S from
Equation (2) into Equation (4c), where Lserv is bearing reference life, Lref, results in the following relation
m m m m L L L L / 1 3 2 1 serv ... 1 1 1 1 + + + = (5a)
serv serv serv
1 2 3 1 ... m m m L L L L L L = + + + (5b) where serv 1 1 m L X L = serv 2 2 m L X L = serv 3 3 m L X L = (5c)
The fractional percent, X, is related to each component that has failed in the system for a specific service life and reliability, and assumes that the Weibull modulus, m, is the same for each component.
Unfortunately, Equation (5) is only an approximation since the system Weibull modulus, m, can vary with sample size, operating conditions and failure mode. In a balanced component life system, the system Weibull modulus, m, will be somewhere between the highest and the lowest of the components’ Weibull slopes. A form of this equation can be solved numerically for system reliability as a function of life and plotted on Weibull coordinates (Ref. 16). The resulting graph can be fitted with a best-fit straight line to determine the system Weibull slope and the system L10 life. In the event of an unbalanced life system, the lowest lived component will dominate the system failures and, thus, can serve as a good approximation for the system Weibull properties. However, at a given reliability, the system life will always be lower than the lowest lived component because other components can also fail.
Application of Strict Series Reliability to Bearing Fatigue
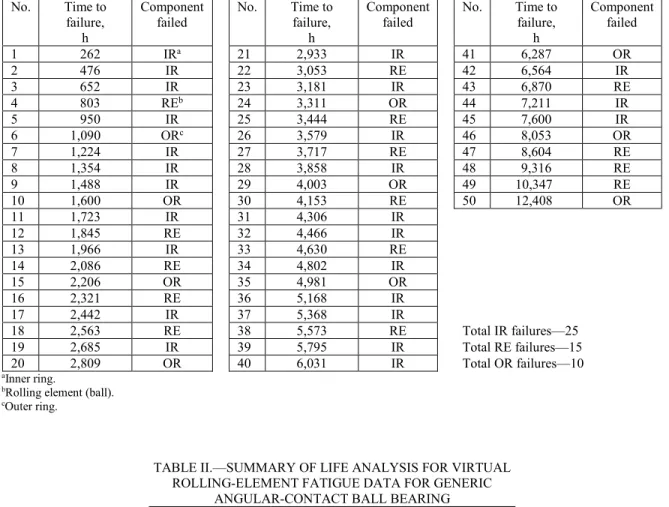
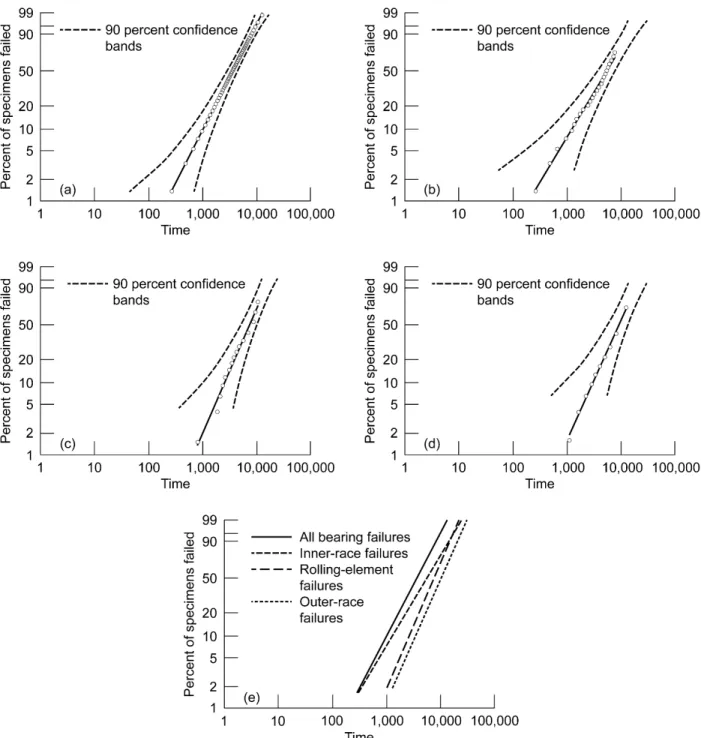
Assume, based on the work of Vlcek et al. (Ref. 17), that a population of 50 generic angular-contact ball bearings are virtually tested under pure thrust load. It is further assumed that the failure mode for these bearings is classical subsurface rolling-element fatigue. Their failure times and the respective component, inner ring (IR), ball or rolling element (RE), or outer ring (OR), that failed in each bearing are summarized in Table I. For the purpose of this example, the failure of each component in the bearing is considered the failure time of the entire bearing. These data were analyzed using the method of L.G.
Johnson (Ref. 15). The 90 percent confidence bands are shown with respect to these data. This would mean that in 90 percent of all possible cases, it can be expected, with reasonable statistical certainty, the failure data points and, thus the failure population distribution, will fall between these confidence bands. The results are shown in the Weibull plot of Figure 3(a) and are summarized in Table II.
In order to determine the lives of each of these respective components in the system, the failure times for a specific component being analyzed are considered a failure and the failure times for the other components are considered to be nonfailures or suspensions. These components are considered
suspensions because the bearings would have continued to operate for an unknown time if they had not been removed from test when they failed. Again, using the method of Johnson (Ref. 15), the Weibull plots for the IR, balls, and OR are shown in Figure 3(b) to (d), respectively. The L10 and L50 bearing fatigue lives and the Weibull modulus m are summarized in Table II under the column designated “Weibull Analysis.” The life and reliability of the system cannot exceed the life and reliability of the lowest lived component in the system whether it is the IR, balls, or OR.
For purpose of example, assume that the data of Table II was available without designating the failed component in each bearing. However, the percentage of the failures representing the IR, balls, and OR are known. Using strict series reliability from Equation (5c) and the data from Figure 3(a), the L10 lives of the IR, balls, and OR are calculated. The L50 lives are calculated using Equation (2). The L10 and L50 lives and the Weibull modulus m are summarized in Table II under the strict series reliability benchmarked to the total bearing L10 life and Weibull modulus of 1.49. These values fall within the 90 percent confidence bands of Figure 3.
As a further example, if it is assumed that the only data that are available are those shown in
Figure 3(d) for the outer race and the percentage of the failed population that it represents, it is possible to use strict series reliability to calculate the lives of the entire bearing using Equation (5c). The L50 lives are calculated using Equation (2). The L10 and L50 lives and the Weibull modulus m are summarized in Table II under the strict series reliability benchmarked to the total bearing L10 life and Weibull modulus of 1.69. These values fall within the 90 percent confidence bands of Figure 3.
The authors define “bearing failure” as the time at which the bearing is no longer fit for its intended purpose even though the bearing is still functioning. This would be considered a “cause for removal.” In the previous examples, if it is assumed that each of the components that failed represent a different failure mode instead of the specific component, it is possible to use Weibull statistical analysis and/or strict series reliability to determine the service life of the entire bearing set and/or the resulting life at a given reliability (probability of failure) for each failure mode represented with reasonable engineering and statistical certainty.
Results and Discussion
Naval Air Rework Facility Rolling-Element Bearing Data
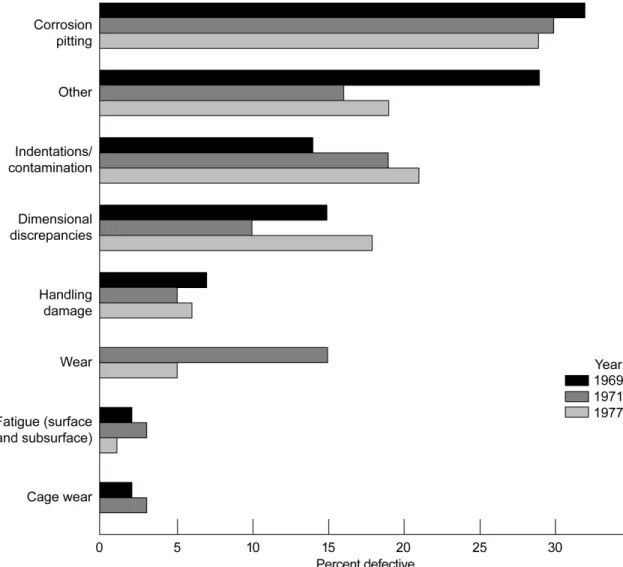
Cunningham and Morgan of the Naval Air Rework Facility, Cherry Point, North Carolina, USA (Ref. 14)published data for rolling-element bearings removed from service for cause for three 80-day periods during 1969, 1971, and 1977, respectively. These data were presented by Cunningham and Morgan at the 33rd meeting of the ASLE (now STLE) in Dearborn, Michigan, April 17 to 20, 1978, and published a year later (Ref. 14).
In the introduction to their paper, Cunningham and Morgan (Ref. 14)state:
“Extensive time and effort has been devoted to calculation of (rolling-element) bearing (L10) life, to determination of cage instability and to studies of the effects of various lubricants and protective coatings. However, the researcher is often at a loss for documented data on bearing rejections in a ‘real world’ environment. This information is essential to determine those areas of developmental work that will
produce the most significant increases in actual bearing (service) life and reliability. A bearing with a design life of 5000 hours is of little value if its operational environment contributes to excessive corrosion pitting at 500 hours.”
The data of Cunningham and Morgan (Ref. 14)are summarized in Figure 4. They categorize the probable causes of failure as
(1) Fatigue (surface and subsurface origin) (2) Cage wear
(3) Wear
(4) Handling damage
(5) Dimensional discrepancies (6) Debris denting and contamination (7) Corrosion pitting
(8) Other (common failure modes)
From STLE (Ref. 18), the “other” common failure modes comprise (1) Misalignment
(2) True and false brinelling (3) Excessive thrust
(4) Heat and thermal preload (5) Roller edge stress (6) Cage fracture
(7) Element or ring fracture (8) Skidding
(9) Electric arc discharge
In all, there are 16 probable causes for bearing failure and/or removal wherein the bearing is no longer fit for its intended purpose but still can be operational. Good engineering and maintenance practice would suggest that these bearings be removed from service when this determination is made that they are no longer fit for their intended purpose. It is probable that if these data were taken today, the categories outlined previously and/or their related percentages would be different. Unfortunately, individual rolling-element bearing types and related times to removal are not provided for these data. Other data of this type, if it exists, are not provided in the open literature.
Cunningham and Morgan (Ref. 14)observe that “Bearing failures due to spalling are rare and almost insignificant to the overall rejection rate. Furthermore, examination to the overall rejection rate under this category revealed corrosion to be a possible cause of spall origin. Classical fatigue seems to play a very minor role in bearing reliability problems. …in most cases, bearing failures are random and do not display a defined time relationship. As a result, many nonsafety components are allowed to continue in service as long as they function properly.” However, using the Cunningham and Morgan (Ref. 14)database, it is possible, using Weibull statistical analysis and strict series reliability, to determine the bearing service life as a function of the bearing L10 (fatigue) life and bearing life as a function of each probable cause for removal. It should be noted that rolling-element fatigue, whether of surface or subsurface origin, accounts for 3 percent or less of the bearings removed from service for cause. That is, they were unfit for their intended purpose at the time of removal.
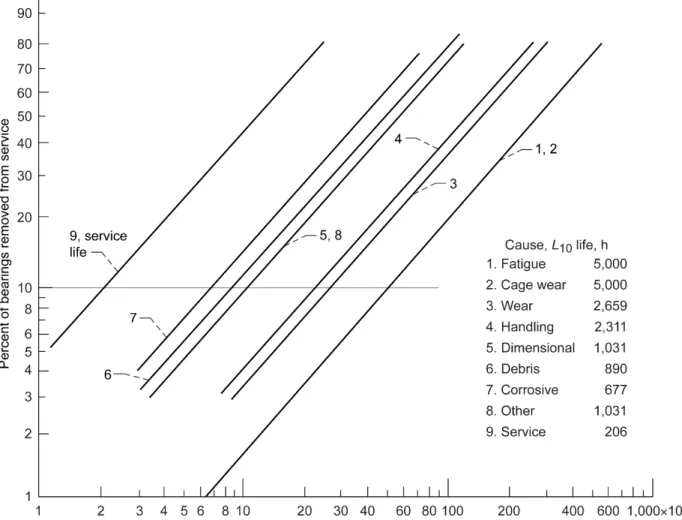
In order to determine and/or assign a qualitative life and resultant life factor from Figure 4, Table III lists probable causes for removal given to a hypothetical bearing having a design (L10) life of 5,000 h as per the previous example from Cunningham and Morgan (Ref. 14):
From Equation (5c) for fatigue as the failure origin where X = 0.03, L10 = 5,000 h, and m =1.1, 1.1 serv serv 10 5000 0.03 m L L X L = = = (6a) serv 206h L = (6b)
If Equation (5c) is applied for corrosion as a cause for removal where X = 0.27, Lserv = 206 h and m =1.1, 1.1 10 10, 206 0.27 m serv c L X L L = = = (7a) 10,c 677h L = (7b)
For purposes of discussion, if a Weibull modulus m = 1.5 in Equation (7a) had been selected, the resultant L10,c bearing life, based on corrosion, would be 493 h.
Using a bearing service life Lserv = 206 h from Equation (6b) and a Weibull modulus of m = 1.1, the L10 lives were calculated for each cause for removal. These values are given in Table III and the
respective Weibull plots are shown in Figure 5. As previously discussed, this analysis is benchmarked to the assumed bearing L10 fatigue life of 5,000 h.
Figure 6 shows the percent of bearings removed from service for cause based on the calculated service life but benchmarked to the bearing L10 fatigue life of 5,000 h. This analysis shows that the percentage of bearings in service would be removed as being unfit for their intended purpose as follows:
(1) At approximately 591 h or the bearing L1 fatigue life (12 percent of the L10 fatigue life), 29 percent of the bearings would be removed from service.
(2) At approximately 1,114 h or the bearing L2 fatigue life or (22 percent of the L10 fatigue life), 49 percent of bearings would be removed from service.
(3) At approximately 1,618 h or the bearing L3 fatigue life or (32 percent of the L10 fatigue life), 64 percent of bearings would be removed from service.
(4) At 5,000 h or the bearing L10 fatigue life, 97 percent of the bearings would be removed from service.
This analysis would suggest that the anecdotal perception that most bearings are removed from service before reaching their L10 fatigue or catalog life has merit.
An issue remains regarding this analysis. What would the service life of the bearing be if fatigue (both surface and subsurface) were to be eliminated as a failure mode? Using Equation (5a), the L10 lives for each mode of failure from Table III, and eliminating fatigue as a failure mode for this calculation, the bearing service life, Lserv, increases from 206 to 212 h. This would suggest that by eliminating rolling-element fatigue as a cause for removal, the service life of these bearings would be increased by 3 percent.
In Table III, it is assumed that the Weibull modulus m = 1.1 and is a constant for all failure modes. As previously discussed in the Strict Series Reliability section, Equation (5a) is only an approximation since the system Weibull modulus m is a variable based on failure mode and is not necessarily a constant as assumed for the previous analysis. In a balanced component life system, the service life modulus m is somewhere between the highest and the lowest of the Weibull modulus m for each of the failure modes. Hence, if the Weibull modulus m for each failure mode is known, the life analysis can be solved
resulting graph can be fitted with a best-fit straight line to determine the system Weibull slope and the service life at a 90 percent reliability or a service L10 life.
In the event of an unbalanced life system, the lowest lived failure mode will generally dominate bearing failures and, thus, can serve as a good approximation for the system Weibull properties. From Table III, “corrosion pitting” is the lowest lived failure mode. However, at a given reliability, the service life will always be lower than that caused by the lowest lived failure mode because other failure modes can also result in bearing removal.
Commercial Aircraft Turbine Engine Bearings
As previously discussed, Averbach and Bamberger (Ref. 13) examined approximately 200 bearing incidents of bearings removed from aircraft engine service for cause. “The initial damage to these bearings was produced by abrasive particles, dents, grinding scores, skidding, large carbides, and corrosion pits.” There was no classical subsurface or surface initiated spalling of any of the bearings reported. As with the work of Cunningham and Morgan (Ref. 14), this would suggest that “classical rolling-element fatigue” is not a primary cause for bearing removal in aircraft turbine engine main-rotor bearings. The issue becomes what is the service lives of these bearings at a designated reliability or the time at which these bearings are no longer fit for their intended application?
For several decades it has been the practice of most, if not all, airlines to rework their engine rolling-element bearings when their engines are sent for refurbishment or rework (overhaul) and the bearings are removed from service. In general, most first-run commercial aircraft engines are removed from service between 15,000 and 20,000 h of operation. The rolling-element bearings are removed from the engine and are subjected to Level I or Level II Rework (Ref. 19). According to Zaretsky and Branzai (Ref. 19), Level I repair is reclamation of the bearings that involve inspecting a used bearing as well as checking and comparing it with new bearing data or reverse-engineering data requirements. Other Level I processes include but are not limited to demagnetization, cleaning, nondestructive testing, visual/microscopic inspection, and minor repairs. The bearing can be rejected for cause as being no longer fit for its intended purpose during Level I inspections. For each Level I repair, the resulting bearing life is reduced from that of a new or unused bearing.
For those bearings that require repair beyond that of Level I and are discarded for cause, a Level II repair is used, which encompasses all of the operations of Level I plus one or more of the following (Ref. 19):
(1) Replacing rolling elements (with new ones) (2) Rework or replacing retainers (cages)
(3) Interchanging used components and/or substituting new components to create a different assembly identity
(4) Grinding or polishing and/or plating mounting surfaces as necessary to return them to original drawing dimensions
(5) Honing (superfinishing) raceways (to the maximum oversized rolling element allowed) Zaretsky and Branzai (Ref. 20) established a simple algebraic relationship to determine the L10 rolling-bearing fatigue life of bearings subject to rework. Depending on the extent of the repair and based on a theoretical analysis, representative life factors (LF) for bearings subject to repair ranged from 0.87 to 0.99 the lives of new bearings. According to Zaretsky and Branzai (Ref. 20), the potential cost savings from bearing rework varies from 53 to 82 percent that of new bearings depending on the cost, size, and complexity of the bearing.
Timken Aerospace Bearing Repair, Los Alamitos, California (formerly Bearing Inspection, Inc. (Bii)) furnished their rolling-element bearing repair (rework) history for a period of January 2007 through December 2013. These data comprised approximately 224,000 aircraft engine ball and roller bearings repaired that included the data for two aircraft engine types, designated as engine type Series A and
engine type Series B. In general, these bearings are manufactured from vacuum induction melted−vacuum arc remelted (VIM–VAR) AISI 52100 and AISIM-50 bearing steels. Also, these bearings operate, for the most part, under a lubricant film parameter Ʌ ≥ 1.5 with lubricant (oil) filtration of βx(c) ≤10. These data
are summarized in Table IV and Table V. Unfortunately, these data are not categorized by bearing type and size, engine main shaft position, or cause for rejection, except for fatigue. Of the 224,000 bearings reported in Table IV(c), 1,977 bearings or ~0.88 percent (<1 percent) were rejected for fatigue. The specific bearing component of these 1,977 that failed from fatigue is identified in Table V(c).
Unfortunately, the percentage or number of bearings removed from service for reasons other than fatigue were not available.
While the information and/or data that would segregate the bearings by type, application, and/or time is not available, it can be reasonably assumed that the main shafts of the two aircraft engines represented Table IV and Table V, from which the bearings were removed, had a set of seven rolling-element
bearings each—two each angular-contact ball bearings and five each cylindrical roller bearings. From the Strict Series Reliability section (Eqs. (4) and (5)), the bearing system life calculated will be less than the lowest lived bearing in the assembly. This is assumed to be the engine main-shaft angular-contact ball thrust bearing. It is further assumed that all bearings were removed from service on or before 20,000 engine operating hours.
Referring to Table IV(a), of the 224,000 bearings reported, there were a total of 24,471 bearings removed for rework and inspected from what is designated as engine type Series A. Of this number, 5,049 or 20.6 percent were rejected for cause. These data do not report the number of bearings comprising the 5,049 that had failed from fatigue. However, a subset of these data comprising 9,184 of the 224,000 bearings that have been designated as engine type Series A1 bearings are summarized in Table IV(b) and Table V(a). From this group, out of the 1,613 bearings rejected for all causes, 17 individual bearings (~0.19 percent) were removed for fatigue.
Referring to Table IV(c) and Table V(b), these tables contains bearing data for a different engine that is designated as engine type Series B. This data set comprises 1,525 bearings of which 252 (~16.5 percent) were rejected for all causes. Of the 252 bearings rejected for all causes, seven (~2.8 percent) of the bearings removed for cause were rejected for fatigue.
Based upon the discussion in this section for purposes of analysis, it was assumed that all bearings were removed from service on or before 20,000 engine operating hours. Furthermore, based on Table IV(a), it can be assumed that ~21 percent of all bearings were removed from service for cause. Based on Table V(c), 1 percent of all bearings removed for reworkfailed from fatigue. This would infer for purposes of analysis that of all the bearings that were removed for cause, approximately 5 percent
{
[0.01(224,000) ÷ 0.21(224,000)] × 100 = 4.76 percent}
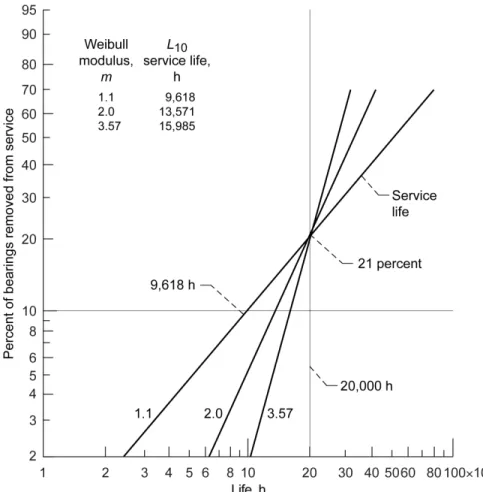
were for rolling-element fatigue.Referring to the Weibull plot of Figure 7, a 21 percent service life (L21) is shown. For fatigue failures, it can be reasonably assumed for purposes of calculation that the Weibull modulus (slope) is equal to 1.1. Using Equation (5c) and a Weibull modulus of 1.1, the L21 fatigue life is calculated to be 318,570 h (Step 1). From the Weibull distribution function, Equation (2), L10 equals 153,206 h (Step 2).
Again, referring to the Weibull plot of Figure 7, a 21 percent service life (L21) is shown together with an assumed Weibull modulus m = 1.1. We do not have data to determine the distribution (Weibull modulus m) for the population of bearings removed from service for all causes. However, we can reasonably assume, for purposes of engineering analysis, that the statistical distribution of the bearings that are removed from service for all causes can vary between the exponential distribution (Weibull modulus m = 1), the Raleigh distribution (Weibull modulus m = 2), and the normal or Gaussian
distribution (Weibull modulus m = 3.57). From the Weibull distribution function (Eq. (2)), the calculated L10 service life equals 9,618; 13,517; and 15,985 or 6.3; 8.7; and 10.4 percent of the L10 bearing fatigue life, respectively. These results are shown in Figure 8. It can reasonably be concluded that most
conservative bearing L10 service life calculation is obtained assuming an exponential distribution where we assumed m = 1.1 in Figure 7.
From Equation (6) the bearing L10 service life can benchmarked and calculated to the bearing L10 fatigue life as follows:
serv 10 m L X L = (8a) or 1 serv m 10
L
=
X L
(8b)Where in Equations (8a) and (8b), Lserv is the service life at a 90 percent reliability or a 10 percent probability for bearing removal; X is the number ofbearings that were removed from service because of fatigue divided by the total of all bearings removed from service regardless of cause; and L10 is the bearing calculated life based on fatigue at a 90 percent reliability or a 10 percent probability of fatigue failure.
An issue that is unanswered from the previous analysis is the suggested correlation between the bearing location parameter, Lµ, based on rolling-element fatigue and the L10 bearing service life using a Weibull modulus of 1.1. From Equation (1) and the work of Zaretsky (Ref 18) and Tallian (Ref. 21),it can be reasonably assumed that the location parameter Lµ, or the time below, which no bearing fatigue failure should occur, is 0.053L10 or for the commercial engine data, (0.053 × 153,206 h =) 8,120 h. From Equation (8b), let, 1 0.053 m X = (8c) and
1.1
m
=
0.04
X
≈
(8d)At a 90 percent reliability, where 10 percent of all the bearings in service are removed from service for cause, 4 percent of those bearings that were removed are because of fatigue or 0.4 percent of all the bearings in service at that point in time. This compares to the 3 percent for the Naval Air Rework Facility bearing data and the ~5 percent commercial aircraft engine bearing rework data. Such a correlation at this time is speculative and more data is required. However, if such a correlation were to exist, it would greatly simplify the rolling-element bearing service life calculation.
General Comments
In the early years of the 20th century, rolling-element fatigue was the major cause for rolling-element bearing removal and limited the life and reliability of these bearings. Sadeghi, et al. (Ref. 22)provide an excellent review of this failure mode. Beginning with Goodman (Ref. 5) and Palmgren (Ref. 2),the bearing industry has based the selection and sizing of these bearings on this failure mode. In the early gas turbine engines, engine life and reliability were linked to the fatigue life of those rolling-element bearings incorporated in the engine. Anecdotally, the life of these early engines, and thus their bearings, were limited to approximately 300 h. This can be compared to the estimated bearing fatigue life of over 100,000 h for the commercial aircraft engine bearings reported herein. Hence, the pre-1960 bearing service life was in fact the calculated L10 bearing fatigue life.
In the early years of the bearing industry, acid- and base-refractory, air-melting methods were used to process steel. Major advances in steel processing have occurred beginning in the 1950s by the
introduction of vacuum-melting procedures that significantly increased the bearing fatigue life (Refs. 18 and 23).
By the early 1960s, bearing fatigue life increased approximately five times that upon which Lundberg and Palmgren (Refs. 11 and 12) benchmarked their life model to (Ref. 18). By 1992, bearing fatigue life was approximately 200 times that benchmarked by Lundberg and Palmgren and with improved
manufacturing techniques, heat treat procedures, and lubricants, bearing fatigue life can be as much as 400 times the Lundberg-Palmgren calculation.
Though bearing fatigue life has significantly improved, the other failure modes and/or causes for removal have remained unchanged, relatively speaking, and application dependent. The bearing removal and replacement rate may not be significantly better than those in the early 1960s. It is suggested that bearing removal rate is application dependent. There is no analytical method for individually calculating the respective replacement rates and/or life except by accumulating a database from field experience. While a bearing may no longer be fit for its intended purpose for reasons other than fatigue, it may operate for extended periods of time in an application without causing secondary damage. However, once the application is shut down, reasonably prudent engineering and maintenance procedures would suggest that the bearing(s) be removed from service and replaced.
Summary of Results
In 1947 and 1952 Gustaf Lundberg and Arvid Palmgren developed what is now referred to as the “Lundberg-Palmgren Model for Rolling Bearing Life Prediction” based on classical rolling-element fatigue. Today, bearing fatigue probably accounts for less than 5 percent of bearings removed from service for cause. A bearing service life prediction methodology and tutorial indexed to eight probable causes for bearing removal, including fatigue, are presented, which incorporate strict series reliability; Weibull statistical analysis; available published field data from the Naval Air Rework Facility; and ~224,000 rolling-element bearings removed for rework from commercial aircraft engines. The following results were obtained:
(1) Bearing service life, Lserv, can be benchmarked and calculated to the bearing L10 fatigue life as follows:
1 serv m 10
L
=
X L
where Lserv is the service life at a 90 percent reliability or a 10 percent probability for bearing removal;X is a fractional percent calculated by taking the number of bearings removed from service because of fatigue divided by the number of all bearings removed from service regardless of cause; m is the Weibull modulus of all the bearings removed from service; and L10 is the bearing calculated life based on rolling-element fatigue at a 90 percent reliability or a 10 percent probability of a fatigue failure.
(2) The most conservative bearing L10 service life calculation is obtained assuming an exponential distribution where m = 1.1.
(3) Of the ~224,000 commercial engine bearings removed from service for rework, 1,977 or 0.88 percent were rejected because of fatigue.
(4) From the Naval Air Rework Facility bearing data, eliminating rolling-element fatigue as a cause for removal, the L10 service life of these bearings would increase by approximately 3 percent. At 5,000 h or the bearing L10 fatigue life, 97 percent of the bearings would be removed from service for cause.
References
1. Palmgren, Arvid (Gunnar Palmgren and Bryce Ruley, transl.): Ball and Roller Bearing Engineering. SKF Industries, Philadelphia, PA, 1945.
2. Palmgren, A.: Die Lebansdauer von Kugellagern. (The Service Life of Ball Bearings, NASA TT– F–13460, 1971). Zeitshrift des Vereines Deutscher Ingenieure, Vol. 68, No. 14, 1924, pp. 339–341. 3. Zaretsky, Erwin V.: A. Palmgren Revisited—A Basis for Bearing Life Prediction. Lubr. Eng.,
vol. 54, no. 2, 1998, pp. 18−23.
4. Stribeck, R. (H. Hess, transl.): Reports From the Central Laboratory for Scientific Investigation. ASME Trans., vol. 29, 1900, pp. 420–466.
5. Goodman, J.: Roller and Ball Bearings. Proceedings of the Institution of Civil Engineers, vol. 189, 1912, pp. 82–136.
6. Zaretsky, Erwin V.: Rolling Bearing Life Prediction, Theory and Application. Recent Developments in Wear Prevention, Friction and Lubrication, George K. Nikas, ed., Research
Signpost, Kerala, India, 2010, pp. 45−136.
7. Colvin, Fred H.; and Stanley, Fred A.: American Machinists’ Handbook and Dictionary of Shop Terms. Second ed., McGraw-Hill Book Co., New York, NY, 1914, pp. 381–386.
8. Styri, H.: Investigators of Rolling Bearings at SKF Industries, Inc. Review of Current and Anticipated Lubricant Problems in Turbojet Engines, NACA Subcommittee on Lubrication and Wear, NACA RM 51D20, appendix D, 1951, pp. 30–39.
9. Weibull, Waloddi: A Statistical Theory of the Strength of Materials. Ingeniorsvetenskapsadademiens, no. 151, 1939.
10. Weibull, Waloddi: The Phenomenon of Rupture in Solids. Ingeniorsvetenskapsadademiens, no. 153, 1939.
11. Lundberg, G.; and Palmgren, A.: Dynamic Capacity of Rolling Bearings. Acta Polytechnica Mechanical Engineering Series, Vol. 1, No. 3, Stockholm, Sweden, 1947.
12. Lundberg, G.; and Palmgren, Avrid: Dynamic Capacity of Roller Bearings. Acta Polytechnica Mechanical Engineering Series, Vol. 2, No. 4, Stockholm, Sweden, 1952.
13. Averbach, B.L.; and Bamberger, E.N.: Analysis of Bearing Incidents in Aircraft Gas Turbine
Mainshaft Bearings. Tribology Trans., vol. 34, no. 2, 1991, pp. 241−247.
14. Cunningham, Jr., J.S.; and Morgan, M.A.: Review of Aircraft Bearing Rejection Criteria and Causes. Lubr. Eng., vol. 35, no. 8, 1979, pp. 435−441.
15. Johnson, Leonard Gustave: The Statistical Treatment of Fatigue Experiments. Elsevier Publishing Co., Amsterdam, The Netherlands, 1964.
16. Savage, M., et al.: Computerized Life and Reliability Modeling for Turboprop Transmissions.
J. Propulsion, vol. 5, no. 5, 1989, pp. 610−614.
17. Vlcek, Brian L.; Hendricks, Robert C.; and Zaretsky, Erwin V.: Determination of Rolling-Element Fatigue Life From Computer Generated Bearing Tests. Tribology Trans., vol. 46, no. 4, 2003, pp. 479−493.
18. Zaretsky, Erwin V.: STLE Life Factors for Rolling Bearings. STLE SP–34, Society of Tribologists and Lubrication Engineers, Park Ridge, IL, 1992.
19. Zaretsky, Erwin V.; and Branzai, Emanuel V.: Model Specification for Rework of Aircraft Engine, Power Transmission, and Accessory/Auxiliary Ball and Roller Bearings. NASA/TP—2007-214463, 2007. http://ntrs.nasa.gov
20. Zaretsky, Erwin V.; and Branzai, Emanuel V.: Effect of Rolling Bearing Refurbishment and Restoration on Bearing Life and Reliability. Tribology Trans., vol. 48, no. 1, 2005, pp. 32–44. 21. Tallian, Tibor: Weibull Distribution of Rolling Contact Fatigue Life and Deviations Therefrom.
ASLE Trans., vol. 5, no. 1, 1962, pp. 183−196.
22. Sadeghi, Farshid, et al.: A Review of Rolling Contact Fatigue. J. Tribol., vol. 131, no, 4, article 041403, 2009.
23. Zaretsky, E.V.: Rolling Bearing Steels—A Technical and Historical Perspective. Mater. Sci.
TABLE I.—VIRTUAL ROLLING-ELEMENT BEARING FATIGUE DATABASE FOR GENERIC ANGULAR-CONTACT BALL BEARING SUBJECT TO
WEIBULL STATISTICAL ANALYSIS (REF. 17) No. Time to
failure, h
Component
failed No. Time to failure, h
Component
failed No. Time to failure, h Component failed 1 262 IRa 21 2,933 IR 41 6,287 OR 2 476 IR 22 3,053 RE 42 6,564 IR 3 652 IR 23 3,181 IR 43 6,870 RE 4 803 REb 24 3,311 OR 44 7,211 IR 5 950 IR 25 3,444 RE 45 7,600 IR 6 1,090 ORc 26 3,579 IR 46 8,053 OR 7 1,224 IR 27 3,717 RE 47 8,604 RE 8 1,354 IR 28 3,858 IR 48 9,316 RE 9 1,488 IR 29 4,003 OR 49 10,347 RE 10 1,600 OR 30 4,153 RE 50 12,408 OR 11 1,723 IR 31 4,306 IR 12 1,845 RE 32 4,466 IR 13 1,966 IR 33 4,630 RE 14 2,086 RE 34 4,802 IR 15 2,206 OR 35 4,981 OR 16 2,321 RE 36 5,168 IR 17 2,442 IR 37 5,368 IR 18 2,563 RE 38 5,573 RE Total IR failures—25 19 2,685 IR 39 5,795 IR Total RE failures—15 20 2,809 OR 40 6,031 IR Total OR failures—10 aInner ring.
bRolling element (ball). cOuter ring.
TABLE II.—SUMMARY OF LIFE ANALYSIS FOR VIRTUAL ROLLING-ELEMENT FATIGUE DATA FOR GENERIC
ANGULAR-CONTACT BALL BEARING Component Life, h Weibull
modulus, m
L10 L50
Weibull analysis (data from Figure 3)
Total bearing 999a 3,526 1.49
Inner ring 1,226 5,418 1.27 Rolling elements 2,517 7,305 1.77 Outer ring 2,981 9,077 1.69
Strict series reliability (analysis benchmarked to Figure 3(a)) Total bearing 999a 3,526 1.49
Inner ring 1,591 5,633 1.49 Rolling elements 2,241 7,935 1.49 Outer ring 2,942 10,416 1.49
Strict series reliability (analysis benchmarked to Figure 3(d)) Total bearing 1,150 3,503 1.69 Inner ring 1,733 5,279 1.69 Rolling elements 2,345 7,143 1.69 Outer ring 2,981a 9,077 1.69
aAnalysis benchmarked to component L
TABLE III.—ASSUMED PROBABLE CAUSES FOR BEARING REMOVAL, THEIR RELATED PERCENT AS A FUNCTION OF BEARINGS THAT HAVE FAILED,
AND RELATED L10 LIFE BASED ON A BEARING SERVICE LIFE AT
A 90 PERCENT RELIABILITY WHERE Lserv = 206 h.
ASSUMED BEARING L10 (FATIGUE) LIFE = 5,000 h.*
Cause for removal Percent of bearings failed Calculated L10 life, h, related
to cause for removal Fatigue (surface and subsurface origin) 3 5,000
Cage wear 3 5,000
Wear 6 2,659
Handling damage 7 2,311
Dimensional discrepancies 17 1,031
Debris denting and contamination 20 890
Corrosion pitting 27 677
Other 17 1,031
*Weibull modulusmwas assumed to be equal to 1.1 for all causes of removal.
TABLE IV.—NUMBER OF BEARINGS REMOVED FOR CAUSE FROM JANUARY 2007 THROUGH DECEMBER 2013a
Total number of bearings
received Total number of bearings rejected for all reasons Rejection ratio for all reasons, percent (a) Bearings removed from engine Series A
24,471 out of ~224,000 5,049 20.6
(b) Bearings removed from engine Series A1
9,184 out of ~224,000 1,613 17.6
(c) Bearings removed from engine Series B
1,525 out of ~224,000 252 16.5
aCourtesy of Timken Aerospace Bearing Repair,Los Alamitos, California.
TABLE V.—NUMBER OF BEARINGS REMOVED FOR FATIGUE FROM JANUARY 2007 THROUGH DECEMEBER 2013a
Bearing component Number of bearings rejected
for fatigue Total number of bearings rejected for all reasons Fatigue rejection ratio, percent (a) Bearings rejected for fatigue per bearing component from engine Series A1
Undesignated 0 --- 0 Rolling elements 0 --- 0 Inner ring 3 --- ~0.04 Outer ring 14 --- ~0.15
Total (9,184) 17 1613 ~0.19
(b) Bearings rejected for fatigue per bearing component from engine Series B Undesignated 0 --- 0 Rolling elements 0 --- 0 Inner ring 6 --- ~0.04 Outer ring 1 --- ~0.01
Total (1,525) 7 252 ~0.05
(c) Bearings rejected for fatigue per bearing component for all engine bearings Undesignated 107 --- 0.05 Rolling elements 533 --- 0.24 Inner ring 791 --- 0.35 Outer ring 546 --- 0.24
Total (224,000) 1,977 Unknown 0.88
Figure 1.—Weibull plot where (Weibull modulus) slope of tangent of line is m; probability of survival Sβ is
36.8 percent, at which L=Lβ or L/Lβ=1. (a) Schematic
where S is probability of survival. (b) Rolling-element bearing fatigue data where InIn (1/S) is presented in ordinate as statistical percent of bearings failed (Ref. 6).
Figure 2.—Multiple Weibull plots where each numbered plot represents cumulative distribution of each component in system and system Weibull plot represents combined distribution of plots 1, 2, 3, etc. (all plots are assumed to have the same Weibull (modulus) slope m) (Ref. 6).
Figure 3.—Failure distribution of generic angular-contact ball bearings virtually tested under pure thrust band. (a) All bearing component failures, failure index 50 out of 50. (b) Inner-race failures, failure index 25 out of 50. (c) Rolling-element (ball) failures, failure index 15 out of 50. (d) Outer-race failures, failure index 10 out of 50. (e) Summary.
Figure 4.—Naval Air Rework Facility rolling-element bearing data for bearings removed from service for cause for three 80-day periods during 1969, 1971, and 1977 (data from Cunningham and Morgan (Ref. 14)).
Figure 5.—Rolling-bearing service life and life distribution based upon cause for removal where the calculated L10
Figure 6.—Percent of bearings removed from service for cause as being unfit for their intended purpose based on the calculated service life, but benchmarked to the bearing L10 fatigue life of 5,000 h.
Figure 7.—Aircraft engine bearing service and fatigue life based on probably cause for removal and Weibull modulus, m, of 1.1 for 224,000 commercial aircraft engine ball and roller bearings over a period of 7 years.
Figure 8.—Effect of Weibull modulus, m, (statistical distribution) on engine bearing service life.