Procedia - Social and Behavioral Sciences 96 ( 2013 ) 1818 – 1827
1877-0428 © 2013 The Authors. Published by Elsevier Ltd. Open access under CC BY-NC-ND license. Selection and peer-review under responsibility of Chinese Overseas Transportation Association (COTA). doi: 10.1016/j.sbspro.2013.08.207
ScienceDirect
13th COTA International Conference of Transportation Professionals (CICTP 2013)
Road Network Capacity Reliability Considering Travel Time
Reliability
Aiwu Kuang
a,*, Zhiqiang Tang
a,b, Liangci Shan
aaSchool of Traffic and Transportation Engineering, Changsha University of Science and Technology, Changsha 410004, P R China bJiangxi Ganyue Expressway CO., LTD, Nanchang 330025, P R China
Abstract
In order to investigate the interaction between travel time reliability and road network capacity reliability, a bi-level programming model based on travel time reliability is set up for the evaluation of capacity reliability in this paper. In the model, the object is to maximize the basic OD traffic demand multiplier in the upper level. For this purpose stochastic user level, and a prescribed travel time threshold is set in the upper level problem as a constraint to travel time. By assuming that link capacity is continuous truncated normal random variable, using Monte Carlo simulation technique in conjunction with the sensitivity analysis method of road network equilibrium flow, a heuristic algorithm is established to estimate road network capacity reliability. Numerical study on a small road network is presented to demonstrate the validity of the proposed model and
algorithm. A s perception
error, the variance of the link capacity and the level of OD traffic demand on the road network capacity reliability are fully examined.
© 2013 The Authors. Published by Elsevier B.V.
Selection and/or peer-review under responsibility of Chinese Overseas Transportation Association (COTA).
Keywords: capacity reliability; travel time reliability; bi-level programming model; stochastic user equilibrium; truncated normal distribution; Monte Carlo simulation
1.Introduction
The development of a nation or region depends in large extent upon an efficient and reliable transportation system to provide accessibility and promote the safe and efficient movement of people and goods. However, in reality, uncertain factors, such as natural disasters, traffic incidents, daily traffic congestion, and road
* Corresponding author. Tel.: +86-731-8525-8575; fax: +86-731-8525-375.
E-mail address: [email protected].
© 2013 The Authors. Published by Elsevier Ltd. Open access under CC BY-NC-ND license.
maintenance etc., are randomly influencing the performance of a road network. Therefore, it is necessary and important to study and ensure the reliability of a road network. From the viewpoint of system engineering, road network reliability is the ability of a road network to accomplish predetermined functions under specified conditions within a time interval. Up to now, the studies on road network reliability are mainly focused on three aspects: connectivity, travel time reliability and capacity reliability (Wakabayashi and Iida, 1992; Bell and Iida, 1997; Chen et al., 1999). Connectivity reliability is concerned with the probability that network nodes remain connected (Iida, 1999). Travel time reliability represents the probability that a trip between a given origin destination (OD) pair can be made successfully within a specified interval of time (Asakura, 1996). Capacity reliability is defined as the probability that the network can accommodate a given amount of traffic demand at a required service level (Chen et al., 1999, 2002).
Although the existing studies about road network reliability have obtained a great of achievements, there still have some limitations worthy of further consideration. Firstly, the studies on the relationship between different reliability indices are still lacking, such as one usually neglects the close association among connectivity, travel time and network capacity reliability when he/she carry out the road network reliability analysis. Secondly, the formulations of the road network reliability evaluation models themselves are usually imperfect, for example, Lo et al. (2006) used uniform distribution to describe the random variation in link capacity, Shao et al. (2006) assumed that the traffic demand follows a normal distribution. In fact, the determination of the probability distribution of traffic demand and link capacity is the key problem to road network reliability evaluation. Nevertheless, whether the models mentioned above can truly and properly reflect the stochastic variation in traffic supply and demand is still short of demonstration.
Based on the above considerations, as the travel time and capacity reliability are important and effective performance measures of a road network, they should be studied in an integrated framework. Moreover, for a recurrent or a non-recurrent capacity degradation network, these two reliability indices are essentially choice behaviors, on the other hand, the OD pair travel time or service level of a road network changes as the demand level fluctuates and the maximum network flow also varies at different service levels. Therefore, it is of interest to investigate the integration of the travel time and capacity reliability. Liu et al. (2004) proposed a capacity reliability model based on the link travel time reliability, whereas the travelers focus more on the OD pair travel time reliability rather than the link travel time reliability. In this paper, we develop a bi-level programming model based on the OD pair travel time reliability to study the road network capacity reliability with the assumption that the link capacity follows a truncated normal distribution. Furthermore, a solution algorithm based on the Monte Carlo simulation technique in conjunction with the sensitivity analysis method is introduced to solve the capacity reliability model. In addition, some numerical studies are presented to demonstrate the rationality and validity of the proposed model and algorithm.
2.Formulations of travel time and road network capacity reliability
2.1. Notations
Consider a road network G = (N, A), where N is the set of nodes and A is the set of links; therefore, the cardinality of A, |A|, is the number of network links. Let W denote the set of OD pairs, Rw the set of routes and qw
the total OD traffic demand between pair w. Let xa be the flow on link a, and Ca the actual capacity of link a, it
should be noted that Ca is a random variable. Each link a has an associated flow-dependent travel time, ta(xa),
which is assumed to be monotonically increasing in its flow xa. Let fkw be the flow on route k between OD pair w,
pkw be the proportion of the OD traffic demand between pair w assigned onto route k. Let Tkw, tkw and kw be the
perceived travel time, the actual travel time and the travel time perception error of route k between OD pair w, respectively. Let tw denote the average travel time of OD pair w. In order to reflect the link-route association
relationship, variable akw is introduced, which is a 0-1 variable with one representing that link a is on route k and
zero otherwise.
2.2. Distribution of the link capacity
In general, the OD pair travel time and the maximum network flow depend on the capacity of each link. In a degradable road network, links do not always operate at their maximum capacity due to various uncertain factors ranging from natural disasters to daily recurring events. Existing studies usually assume that the link capacity follows a certain probability distribution, such as a discrete distribution (Kuang and Huang, 2007), a beta distribution (Lo and Tung, 2000), a normal distribution (Lam et al., 2008), and so forth. However, these distributions usually ignore the fact that link capacity cannot be negative or higher than its design capacity. Therefore, in this paper, we use a truncated normal distribution to describe the random variation in link capacity.
Let cad be the highest capacity of link a (a A), which represents the best working state of link a, namely, its
design capacity state. Assume that the minimum capacity of link a is zero (representing the state in which the link is completely broken off). Also assume that all links in the road network are independent of each other, and that each link has a truncated normally distributed link capacity between zero and cad. Specifically, the probability
density function of link a Ca, can be given as:
otherwise
0
0
2
)
(
exp
2
1
)
(
2 2 d a a a a a Cc
x
x
k
x
f
a ,a
A
(1)where a, a are the mean and standard deviation of link a ka is a normalizing
constant, which can be expressed as:
1
a a a a d a ac
k
,a
A
(2)where (x) is the standard normal cumulative function of random variable x.
Let vector c = (c1, c2 c|A|)T be a specific capacity state of road network G. The value of vector c reflects the current capacity state of all links.
2.3.
Usually, three criteria, namely user equilibrium (UE), system optimum (SO) and stochastic user equilibrium subject to recurrent or non-recurrent capacity disturbances, due to the complexity of the network structure and a high degree of uncertainty in the traffic conditions, travelers usually have partial information about the congestion status and the actual route travel time, thus their route choice behaviors are always stochastic. Therefore, it is necessary for a traveler to consider the perception error when choosing a route. As a result, the stochastic user equilibrium model is preferred in this paper.
According to the random utility theory, the travel time perceived by an individual traveler on route k between OD pair w is the summation of the actual route travel time and the correspondent perception error, i.e.,
w k w k w k
t
T
,k
R
w,w
W
(3)In this paper, we suppose that all travelers make their route choices in a stochastic manner. The route choice criterion is to minimize the perceived route travel time. Furthermore, it is assumed that the perception errors are independently and identically distributed Gumbel variables with a zero mean. According to the utility maximization theory, at equilibrium state, the route choice probability is governed by the following logit formula:
w R r w r w k w k
t
t
p
)
exp(
)
exp(
,f
kwp
kwq
w,k
R
w,w
W
(4)Where the dispersion parameter is a non-negative constant representing the degree of familiarity with traffic conditions by travelers on the road network.
When the link capacity vector holds on a certain state, for any given OD demand qw, the logit-based SUE
model can be formulated as an equivalent variational inequality (VI) as follows. Find a route flow vector f* , such that:
0
ln
1
W w k R w k w k w w k w k wf
f
q
f
t
,f
kw (5) Where f= fkw Tthe variational inequality problem, and represents the feasible set for the route flow vector defined by the following constraints. w R k w k
q
f
w ,w
W
(6)0
w kf
,k
R
w,w
W
(7) W w k R w ak w k a wf
x
,a
A
(8)In the constraint set, equation (6) represents a set of flow conservation constraints. Equation (7) is the non-negative constraint for route flow, and equation (8) converts the route flow into link flow through the route-link incidence indicator.
According to the weak law of large numbers, when the solution of model (5) is determined, the average travel time between OD pair w, tw, can be given by the route choice probability and the correspondent actual route
travel time of each route between the OD pair, i.e.,
w R k w k w k w
t
p
t
(f
)
,w
W
(9)2.4. OD pair travel time reliability formulation
Obviously, the average travel time between a given OD pair depends on the degradation degree of the link capacity and the congestion degree of the entire network simultaneously. Moreover, the congestion degree will also vary with different traffic demands on the network. Therefore, when carrying out the OD pair travel time reliability evaluation, one should usually define a certain basic OD traffic demand pattern in advance. Let q0=
qw0 T be a given basic OD demand pattern. In order to investigate the OD pair travel time reliability at various
c0 denote the link capacity vector of degraded and non-degraded state of the network, respectively. Let tw(c0, q0)
be the average travel time between OD pair w corresponding to the basic reference OD demand q0 and the
highest link capacity vector c0 in a non-degraded state. Let tw(c, q) be the average travel time between OD pair w
corresponding to the multiplied OD demand q= tq0 and the link capacity vector c in a degraded state. Clearly,
tw(c0, q0) and tw(c, q) can be obtained through the stochastic user equilibrium model (5) and equation (9).
Moreover, tw(c, q) is a random variable due to the random variations in the link capacity vector. Therefore, we
define the OD pair travel time reliability as the probability that the ratio of tw(c, q) to tw(c0, q0) given q= tq0 is
kept within a specified level of threshold, t, i.e.,
0 0 0
q
q
q
c
q
c
t t t t,
)
(
,
)
(
,
)
|
(
r w w wP
t
t
TR
,w
W
(10)Where TRw( t, t) is the reliability of OD pair w with demand multiplier t and travel time threshold t. t
reflects the level of service or travel time threshold that should be maintained, whose value can be estimated by statistical analysis of daily trip survey data and usually vary with different OD pairs.
2.5. Road network capacity reliability formulation
According to the concept of capacity reliability defined in Chen et al. (1999, 2002), if one wishes to calculate the road network capacity reliability, he/she should first determine the reserve capacity of the network taking the
travelers Wong and Yang (1997) extended the reserve capacity for a
signal-controlled intersection proposed by Webster and Cobbe (1966) to a general network, and defined it as the largest demand multiplier applied to a given basic reference OD that can be allocated to a road network without violating the link capacities constraints. From this definition, a prescribed level of service must be specified before calculating the reserve capacity. For consistence and comparison with the OD pair travel time reliability, here the level of service is specified as the travel time tw(c, q) in a degraded state between each OD pair not exceeding t
times the basic reference travel time tw(c0, q0). Once the reserve capacity is determined, we then define the
certain traffic demand at the prescribed level of service.
Based on the OD pair travel time reliability and taking into account th bi-level programming model for the network reserve capacity as follows,
[Upper]
max
(
c
)
(11) s.t.t
w(
c
,
q
)
tt
w(
c
0,
q
0)
,w
W
(12) [Lower]1
ln
0
W w k R w k w k w w k w k wf
f
q
f
t
(13) s.t. w0 R k w kq
f
w ,w
W
(14)0
w kf
,k
R
w,w
W
(15)Clearly, the largest OD demand multiplier depends on the link capacity vector c. According to Chen et al. (1999, 2002), the road network capacity reliability can also be defined as the probability that the network reserve capacity (c) with degraded link capacities is greater than or equal to a predetermined demand multiplier threshold t, i.e.,
w
t
t
P
CR
(
t,
t)
r(
c
)
t|
w(
c
,
q
)
t w(
c
0,
q
0),
(16)Where CR( t, t) is the road network capacity reliability with demand threshold t and travel time threshold t. t reflects the traffic demand level that the network should be maintained at a certain OD pair travel time
reliability constraint.
3.Solution algorithm
depends on how the link capacity distributed. Usually, it is difficult to obtain the analytical expression of the cumulative distribution of the largest OD demand multiplier, especially for the continuous link capacity random variables. Therefore, in this paper, we propose a Monte Carlo simulation-based solution algorithm to solve the road network capacity reliability with OD pair travel time reliability constraint. The step-by-step procedure of this method is given below.
(1): Initialization. Initialize maximum sample size to be Nmax and the sample index n to be 1.
(2): Sampling. Generate a vector of link capacities, c(n)=(c
1(n) ca(n) c|A|(n))T, based on the truncated
normal distribution.
(3): Defining the performance function of the largest OD demand multiplier. For a given link capacity vector c(n), solve the bi-level programming model (11)-(15) and obtain the largest OD demand multiplier (c(n)).
Accordingly, the performance function of the road network capacity reliability can be defined as the ratio of (c(n)) to the prescribed demand threshold
t as follows, t ) ( t ) ( t ) ( ) (
)
(
0
)
(
1
)
,
(
n n n n GZ
c
c
c
(17)According to equation (17), to determine the performance function of the road network capacity reliability with link capacity vector c(n), one needs to solve model (11)-(15). In this paper, we introduce the following sensitivity analysis based algorithm to solve the bi-level programming problem.
(3.1): Initialization. Determine an initial value of the OD demand multiplier, (c(n))(k), and set the
iteration counter k=0.
(3.2): For the given (c(n))(k), solve the stochastic user equilibrium traffic assignment in the lower
programming and obtain the equilibrium link flow vector (x(n))(k).
(3.3): Calculate the derivative of the equilibrium link flow (x(n))(k) with respect to the OD demand
multiplier (c(n))(k) using sensitivity analysis technique.
(3.4): Transform the upper programming into a linear programming problem along with the derivative information and solve the upper level problem to obtain an updated OD demand multiplier (c(n))(k+1).
(3.5): Convergence criterion. If | (c(n))(k+1)- (c(n))(k) , then stop, where is a prescribed precision. Otherwise, set k=k+1 and return to (3.2).
(4) Determine whether the sample size is reached. If sample index n is less than the required sample size Nmax,
then increment the sample index (i.e., n=n+1) and go to (2). If not, go to (5).
(5): Evaluating the road network capacity reliability. According to the statistics analysis theory, the road network capacity reliability with a sample size Nmax and a prescribed demand multiplier t can be calculated as:
max t max 1 ) ( max
1
N n n G NN
Z
CR
(18)4.Numerical examples
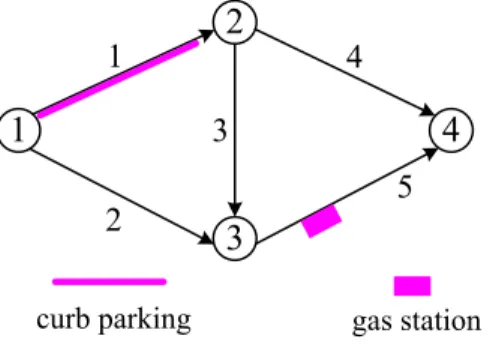
The example network shown in Figure 1 includes four nodes, five links and two OD pairs (from node 1 to node 4 and node 2 to node 4). The Bureau of Public Road (BPR) link performance function ta(xa)=ta0[1+0.15(xa/ca)4] is adopted, where ta0, xa and ca are the link free-flow travel time, link flow and link
capacity, respectively. It is assumed that link 1 and link 5 will operate at different capacity states due to the influence of curb parking and gas station, respectively. Furthermore, the capacity of link 1 and link 5 follows a truncated normal distribution. Other links, i.e., link 2, link 3 and link 4 always operate at their highest capacities. The characteristics of each link, including the free-flow travel time, the link design capacity, the mean and standard deviation of link capacity are given in Table 1. The basic reference OD demand are set to be q14= 100
and q24= 50 (pcu/h). Other input data in the example are: t=1.2, t=1.5, =0.5, Nmax=5000.
1
2
3
4
1
2
3
4
5
curb parking gas station
Fig. 1. Example network Table 1. Link free-flow travel times and statistical properties of link capacities
Link no. Free-flow travel time/(min) Design capacity/(pcu·h-1) Theoretical distribution/(pcu·h -1) Mean Standard deviation
1 4 100 90 18
2 6 80 80 0
3 2 60 60 0
4 5 120 120 0
5 3 120 100 20
Using the capacity reliability evaluation model and solution algorithm proposed in this paper, a value of 0.749 for the capacity reliability of the example network is obtained resulting from 5000 Monte Carlo simulations. In order to further study how the combinations of the OD pair travel time threshold and the traffic demand threshold affect the network capacity reliability, set the travel time threshold to be t=(1.02, 1.04, ···, 1.18, 1.20) and the
demand threshold to be t=(1.1, 1.2, 1.3, 1.4, 1.5). Figure 2 depicts the impact of the different travel time
thresholds and the demand thresholds on the road network capacity reliability. From Figure 2, we can find that, for a given OD demand threshold, the network capacity reliability increases as the OD pair travel time threshold increases. On the other hand, it is also clear from the figure that smaller OD demand threshold yields larger road network capacity reliability. This result is consistent with our intuition; that is, if travelers can undergo higher
degree of congestion, the throughput of the maximum network flow should increase. In general, with stochastic link capacity degradations, to uphold a certain travel time reliability requirement, the network can only carry flow up to a certain level. Beyond that, the requirement on travel time reliability cannot be maintained.
Fig. 2. The relationship between capacity reliability and OD pair travel time reliability
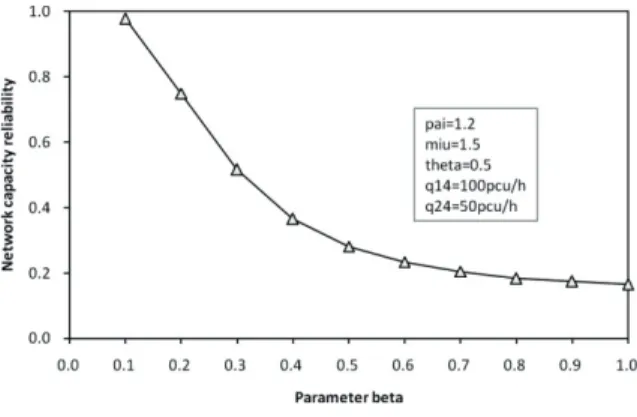
Figure 3 displays the effects of the dispersion parameter of the SUE model on the road network capacity reliability with a travel time threshold equals to 1.2 and a demand threshold equals to 1.5. In the figure, the parameter is regarded as the link capacity standard deviation coefficient, namely, the ratio of the standard deviation to the mean of the link capacity. From Figure 3, it can be found that when the parameter is relatively low, road network capacity reliability is sensitive to parameter , i.e., any enhancement on can greatly improve the capacity reliability. However, whena reaches a relatively high value, the improvement of on road network capacity reliability is reduced to almost zero, i.e., the road network capacity reliability tends to be stable. The numerical results reveal that if travelers are unfamiliar with the network conditions, effective dissemination of capacity reliability can be improved. But, in practice, how to determine a suitable information dissemination extent and how to keep a proper information quality level are worth researching and exploring in future.
Fig. 3. Capacity reliability with different dispersion parameter of the SUE model
Figure 4 shows the capacity reliability of the example road network against the link capacity standard deviation coefficient whenq14=100, q24=50 (pcu/h), t=1.2, tt=1.5, =0.5. It can be seen that as the link capacity=
standard deviation coefficient increases, the network capacity reliability decreases significantly. This implies that a larger link capacity standard deviation coefficient corresponds to a wider range of the link capacity variance. As a result, the probability that the network operating at a lower capacity state increases, accordingly, the unreliable network capacity state increases and the capacity reliability of the example road network decreases. These findings suggest that we can rationally enhance the network reliability by controlling the link capacity fluctuation degree within a proper extent during daily traffic management.
Fig. 4. Capacity reliability with different link capacity standard deviation coefficient
In the end, we examine the road network capacity reliability under different basic OD traffic demand levels at: q14=200 q24=100 , where =0.1, 0.2, 0.3, 0.35, 0.4, 0.45, 0.5, 0.55, 0.6, 0.7, 0.8, 0.9, 1.0 is the demand
multiplier representing the demand level from 1 to 13. Figure 5 depicts how the network capacity reliability varies with respect to different demand multipliers (i.e., demand levels). It can be observed that when the demand multiplier
n amount of traffic demand at a specified service level and the capacity is completely unreliable. These results show that traffic demand level has a significant impact on road network reliability. In general, the degree of traffic congestion increases with the increasing in traffic demand. Therefore, due to random variations in link capacities, a degradable road network can only accommodate a lower traffic demand level.
5.Conclusions
Travel time and capacity reliability have attracted more and more attention as two important and effective indices for measuring the performance of a stochastic road network. Therefore, in this paper, we have studied the interaction of the OD pair travel time reliability and the capacity reliability of networks subject to random capacity disturbances. We postulated that link capacity follows a truncated normal distribution and established a travel time reliability-based capacity reliability evaluation model. To solve the model, a Monte Carlo simulation-based solution algorithm is introduced. An example network is used to verify the proposed model and algorithm and the numerical results show that: (1) uncertainty in link capacity leads to random variation in link travel time and influences the network capacity with a travel time reliability constraint; (2) network capacity reliability increases with OD pair travel time threshold increasing and decreases with demand threshold increasing; (3) network capacity reliability decreases with link capacity fluctuation degree increasing; (4) effective and reliable information can improve network capacity reliability, though with decreasing marginal effects; (5) the traffic demand level is a key factor affecting road network capacity reliability and reducing traffic demand by avoiding unnecessary traffic is important to the improvement of network efficiency and reliability.
Acknowledgements
This research was supported in part by the National Natural Science Foundation of China under grant number 51208064 and 51078044, the Natural Science Foundation of Hunan Province under grant number 10JJ6074, and the Education Department of Hunan Province under research grant 11B004 and 09C069.
References
Asakura, Y. (1996). Reliability measures of an origin and destination pair in a deteriorated road network with variable flows. Proceedings of the 4th Meeting of the EURO Working Group in Transportation, Newcastle, 273-287.
Bell, M. G. H., Iida, Y. (1997). Transportation network analysis. John Wiley and Sons, New York.
Chen, A., Yang, H., Lo, H. K., Tang, W. H. (1999). A capacity related reliability for transportation networks. Journal of Advanced Transportation, 33, 183-200.
Chen, A., Yang, H., Lo, H. K., Tang, W. H. (2002). Capacity reliability of a road network: an assessment methodology and numerical results.
Transportation Research Part B, 33, 225-252.
Iida, Y. (1999). Basic concepts and future directions of road network reliability analysis. Journal of Advanced Transportation, 33, 125-134. Kuang, A. W., Huang, Z. X. (2007). Research on the service reliability in stochastic supply and demand. Systems Engineering, 25, 25-30. Lam, W. H. K., Shao, H., Sumalee, A. (2008). Modeling impacts of adverse weather conditions on a road network with uncertainties in demand and supply. Transportation Research Part B, 42, 890-910.
Liu, H. X., Pu, Y. (2004). Road network capacity reliability based on link travel time reliability. Journal of Southwest Jiaotong University, 39, 573-576.
Lo, H. K., Tung, Y. K. (2001). A chance constrained network capacity model. In: Reliability of Transport Networks, 159-172.
Lo, H. K., Luo, X. W., Siu, B. W. Y. (2006). Degradable transport network: travel time budget of travelers with heterogeneous risk aversion.
Transportation Research Part B, 40, 792-806.
Shao, H., Lam, W. H. K., Tam, M. L. (2006). A reliability-based stochastic traffic assignment model for network with multiple user classes under uncertainty in demand. Network and Spatial Economics, 6, 173-204.
Wakabayashi, H., Iida, Y. (1992). Upper and lower bounds of terminal reliability of road networks: an efficient method with Boolean algebra.
Journal of Natural Disaster Science, 14, 29-44.
Webster, F. V., Cobbe, B. M. (1996). Traffic signal. Road Research Technical Paper No. 56, HMSO, London.