Effect of Non-equilibrium Surface Thermochemistry in
Simulation of Carbon Based Ablators
Yih-Kanq Chen*,
NASA Ames Research Center, Moffett Field, CA 94035-1000 and
Tahir Gökçen†
ERC, Inc., NASA Ames Research Center, Moffett Field, CA 94035-1000
This study demonstrates that coupling of a material thermal response code and a flow solver using non-equilibrium gas/surface interaction model provides time-accurate solutions for the multidimensional ablation of carbon based charring ablators. The material thermal response code used in this study is the
Two-dimensional Implicit Thermal-response and AblatioN Program (TITAN), which predicts charring material thermal response and shape change on hypersonic space vehicles. Its governing equations include total energy balance, pyrolysis gas mass conservation, and a three-component decomposition model. The flow code solves the reacting Navier-Stokes equations using Data Parallel Line Relaxation
(DPLR) method. Loose coupling between the material response and flow codes is performed by solving the surface mass balance in DPLR and the surface energy balance in TITAN. Thus, the material surface recession is predicted by finite-rate gas/surface interaction boundary conditions implemented in DPLR, and the surface temperature and pyrolysis gas injection rate are computed in TITAN. Two sets of non-equilibrium gas/surface interaction chemistry between air and the carbon surface developed by Park and Zhluktov, respectively, are studied. Coupled fluid-material response analyses of stagnation tests conducted in NASA Ames Research Center arc-jet facilities are considered. The ablating material used in these arc-jet tests was Phenolic Impregnated Carbon Ablator (PICA). Computational predictions of in-depth material thermal response and surface recession are compared with the experimental measurements for stagnation cold wall heat flux ranging from 107 to 1100 W/cm2.
Nomenclature
C = mass fraction
D = diffusion coefficient, m2/s h = enthalpy, J/kg
kt = thermal conductivity of translational temperature, W/m-K
kv = thermal conductivity of vibrational temperature, W/m-K
m = mass flux, kg/m2-s
M = molecular weight, kg/kmole
p = pressure, N/m2
conv
q = convective heat flux at surface, W/m2
cond
q = In-depth conductive heat flux at surface, W/m2
rw
q = radiative heat flux at surface, W/m2 rc = corner radius, cm
rn = nose radius, cm max
R
= maximum allowed change on surface recession, mT = temperature, K max
T
= maximum allowed change on surface temperature, K t
T
= translational temperature, K vT
= vibrational temperature, K T
= environment temperature, Kv
= mass injection velocity, m/s *Aerospace Engineer, Thermal Protection Materials Branch, MS 234-1, Senior Member AIAA.
†
Senior Research Scientist, ERC, Inc., Associate Fellow AIAA.
wˆ = source term of gas-surface interactions, kmole/m2-s
= absorptance
= emissivity = total density, kg/m3
= Stefan-Boltzmann constant, W/m2-K4 subscriptsc
= char g = pyrolysis gas i = gas speciesw
= wallI. Introduction
Vehicles designed for Earth entry at super-orbital velocities, as well as those designed for ballistic entry at orbital velocities, typically use thermal protection system (TPS) materials that pyrolyze and ablate at high temperature for mass-efficient rejection of the aerothermal heat load. For design and sizing of ablating TPS materials, it is imperative to have reliable numerical procedures which can accurately compute both the aerothermal environment and the material surface ablation and internal thermal response. It has been demonstrated that accurate prediction of ablative heat flux also requires a fluid-solid shape change coupling simulation.1,2 In our previous fluid-solid shape change coupling computations, the ablative carbon surface was assumed to be at chemical equilibrium. Chemical equilibrium is a good assumption for many space entry applications, but may not be valid for all conditions. Additionally, the aerothermal environments computed by Data Parallel Line Relaxation method (DPLR)3 were those for a fully catalytic non-ablating surface. Thus, an engineering correlation with blowing reduction parameter had to be introduced in the Two-dimensional Implicit Thermal-response and AblatioN program (TITAN)4 simulation to take into account the effect of mass injection on reduction of convective heat flux. A mass transfer coefficient also had to be defined based on the heat transfer coefficient under the assumption of a relatively thin boundary layer for the computation of char recession rate.
The purpose of this paper is to present a new DPLR/TITAN coupling simulation system and its applications to carbon based charring ablators. The boundary condition with general non-equilibrium finite-rate chemistry for gas/surface interactions recently implemented in the DPLR code by MacLean5 is used to predict char mass injection rate. Thus, surface thermal chemistry coupling is introduced in this simulation system, in addition to surface shape change coupling. In this simulation system, the surface species mass balance is performed in DPLR, and the surface energy balance is performed in TITAN. The chemical equilibrium assumption typically used in TITAN can then be removed. The hot-wall ablating convective heat flux is directly computed in DPLR based on the surface temperature and pyrolysis gas injection rate computed in TITAN. The blowing reduction correlation is no longer needed in the material response simulation. Two sets of non-equilibrium gas/surface interaction chemistry between air and carbon surface are studied. They were developed by Park6 and Zhluktov,7 respectively. Coupled fluid-material response analyses of stagnation tests conducted in NASA Ames Research Center arc-jet facilities are performed. The ablating material used in these arc-jet tests was a Phenolic Impregnated Carbon Ablator (PICA).8 Computational predictions of in-depth material thermal response and surface recession are compared with the experimental measurements for stagnation cold wall heat fluxes from 100 to 1100 w/cm2.
II. Surface Thermal chemistry Coupling
The interface between a TPS material and its surrounding flow field can be defined by solving species mass conservation and energy balance equations. Species mass conservation at the surface of TPS material is written as:9
g i g i i i w i i C C M w m C D ˆ ,
(1)The first term on the left-hand side is mass transfer through diffusion, and the second term is mass transfer due to convection. On the right-hand side are the source terms due to gas-surface interaction and pyrolysis gas injection. Based on global mass balance at the surface, the following equation for the total mass blowing rate is expressed as:
g c wm m
The total convective heat flux to the surface for the flow field that includes a two-temperature model is given as: i i i v v t t conv k T k T h D C q
. (3)Energy conservation equation at the surface is written as
(4)
The first term in Equation (4) is the total convective heat flux, the second and third terms represent the heat of ablation, the fourth and fifth terms are radiation absorption and emission, respectively, and the final term is the rate of heat conduction into the TPS material.
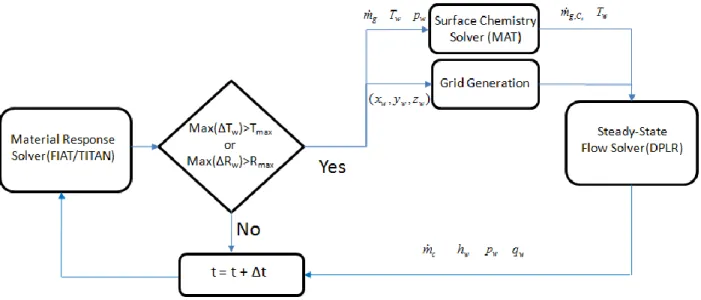
To obtain the solutions for Equations (1) to (4) requires computations of thermal and species diffusion rates in the flow field at the surface as well as thermal diffusion and pyrolysis gas injection rates of TPS material at the surface. The governing equations for both fluid and solid can be solved simultaneously along with Equations (1) through (4). This is a so called strongly coupled simulation. However, for many simulations, flow solver and material response code are two independent programs, and a loosely coupled simulation needs to be applied. In a loosely coupled simulation, the governing equations for fluid and solid are solved separately, and Equations (1) to (4) have to be solved either in the flow code or in the material response code. Thus, communication between two codes needs to be established for exchanging information on surface thermal chemistry and shape change. If the material surface is at chemical equilibrium, both the mass and energy conservation equations at the surface can be performed in the material simulation code as described in our previous work.1,2 For a chemical equilibrium surface, the chemical species at the surface are determined by using a chemical equilibrium code, such as ACE10 or MAT.11 In our chemical equilibrium analyses, the hot wall ablating heat flux was estimated from the cold wall non-ablating heat flux using an engineering correlation with a blowing reduction parameter. Also, species mass transfer rate was assumed to be proportional to heat transfer rate based on a constant Lewis number. Under these assumptions, the surface thermal chemistry coupling is not required, and only shape change information has to be exchanged between flow solver and material response code to correctly predict the aerothermal environments and material thermal response. For a general finite-rate surface boundary condition, the approach taken here is having the species mass conservation equation solved with flow-field governing equations and total energy balance equation solved with solid material governing equations. Surface thermal chemistry and shape change have to be shared between the flow solver and the material solver in a time lagged manner. The schematic diagram in Figure 1 depicts how this loosely coupled simulation is performed. This simulation must be time accurate and starts from the material response simulation code using the boundary conditions of cold wall non-ablating convective heat flux and pressure estimated based on initial free stream conditions. As the maximum surface temperature change or surface recession exceeds the pre-determined value, the material response computation is temporarily put in a waiting mode and the latest predicted surface temperature and pyrolysis gas injection rates are used as the boundary conditions in performing a flow field simulation. The pyrolysis gas is assumed to be at chemical equilibrium before being injected into the adjacent air. This assumption was proved to be reasonable for conditions studied in this paper.12 The computational grid system for the flow field is reconstructed based on the shape change predicted by the material response code, and the free stream conditions are also updated according to the flight trajectory. Each flow simulation is a steady-state computation. When the steady-steady-state flow solution is obtained, the time-dependent material response simulation is resumed using the newly predicted surface heat flux, pressure, enthalpy, and char mass injection rate as the boundary conditions. Again material response simulation continues until maximum surface temperature change or surface recession exceeds the maximum allowed value. This process repeats until the end of flight trajectory or arc-jet exposure.
Figure 1. Explicit surface thermochemistry and shape change coupling methodology.
III. Chemistry Models
Two sets of non-equilibrium gas/surface interaction models between air and carbon surface are studied in this work. The first set was developed by Park6 and the second set was developed by Zhluktov.7 In this study, the nitridation reaction in the original Park’s model is replaced by the nitrogen recombination reaction to be consistent with observations in arc-jet tests using pure nitrogen gas. Zhluktov’s model is more sophisticated as compared with Park’s. In Zhluktov’s model, the numbers of empty surface sites, E(s), and sites occupied by oxygen, O(s), or nitrogen, N(s), are considered to predict both the forward and backward reaction rates. Park’s model uses an engineering approach considering only the forward reaction. Here C(b) represents the solid carbon species. The gas/surface reactions used in this study are listed below, and their rates can be found in Refs 6, 7, and 9:
Modified Park Carbon/Air Chemistry: #1 O + C(b) CO
#2 O2 + 2C(b) 2CO #3 2N N2
#4 3C(b) C3 #5 C3 3C(b)
Zhluktov Carbon/Air Chemistry: #1 O + E(s) O(s) #2 2O(s) O2 + 2E(s) #3 O2 + E(s) O + O(s) #4 CO2 + E(s) CO + O(s) #5 O(s1) + C(b) CO + E(s1) #6 O + O(s) + C(b) CO2 + E(s) #7 2O(s) + C(b) CO2 + 2E(s) #8 C + E(s) E(s) + C(b) #9 C2 + 2E(s) 2E(s) + 2C(b) #10 C3 + 3E(s) 3E(s) + 3C(b) #11 N + E(s) N(s) #12 N2 + E(s) N + N(s)
Marschall developed a general formulation for finite-rate gas and surface interactions.13 The DPLR code was enhanced by MacLean based on Marschall’s work to solve the surface species mass balance equation for the finite-rate gas surface reactions. The detail of his implementation can be found in Ref. 5. All flow simulations presented in this work are performed using this version of DPLR code.
There are twenty two gas phase chemical species used in this study for the simulation of PICA and air-Argon interactions. None of the ion species are considered. The chemical species are CO2, CO, N2, O2, NO, C2, C3, CN, H2, HCN, C, N, O, H, CH, CH2, C2H, C2H2, C4, C3H, C4H, and Ar. These species were selected based on a chemical equilibrium computation for a PICA/air-Argon system. Their enthalpy makes up more than 95% of total gas enthalpy as compared with the baseline 119 chemical equilibrium species model developed by Orion TPS Advanced Development Project.14 The gas phase chemical reactions considered in the simulations are as follows.
#1 CO2 + M CO + O + M #2 CO + M C + O + M #3 N2 + M N + N + M #4 O2 + M O + O + M #5 NO + M N + O + M #6 C2 + M C + C + M #7 C3 + M C2 + C + M #8 CN + M C + N + M #9 H2 + M H + H + M #10 N2 + Ar N + N + Ar #11 O2 + Ar O + O + Ar #12 NO + Ar N + O + Ar #13 NO + O O2 + N #14 N2 + O NO + N #15 CO + O O2 + C #16 CO2 + O O2 + CO #17 CO + C C2 + O #18 CO + N CN + O #19 N2 + C CN + N #20 CN + O NO + C #21 CN + C C2 + N #22 HCN + H CN + H2 #23 CH + M C + H + M #24 CH2 + M C + H2 + M #25 CH2 + M CH + H + M #26 C2H + M C2 + H + M #27 C2H2 + M C2H + H + M #28 C2 + C2 C3 + C #29 C2 + H2 C2H + H #30 CH2 + C CH + CH #31 CH2 + CH2 C2H2 + H2 #32 CH2 + C C2H + H #33 CH2 + C2H CH + C2H2 #34 CH + CH C2H + H #35 CH + C2H C2H2 + C #36 CH2 + CH2 C2H2 + H + H #37 C2 + C2 + M C4 + M #38 C + CH C2 + H #39 C + C2H C3 + H #40 C2 + CH C3 + H #41 C2 + C2H C4 + H #42 CH + H C + H2 #43 CH2 + H CH + H2
#44 C2H + C2H C2H2 + C2 #45 C + C2H2 C3H + H #46 C2 + C2H2 C4H + H #47 C2 + C4H C2H + C4 #48 C2H + C2H C4H + H #49 C3H + H C3 + H2 #50 C4H + H C4 + H2 #51 H + C4 + M C4H + M #52 CH + CH C2 + H + H #53 C2H + H2 C2H2 + H
The reaction rates for reactions #1-22 are taken from the work of Olynick et al.15 for Stardust earth entry simulation. The rates for reactions #23-36 are taken from Gökçen’s16 paper for simulations of Titan atmosphere entry. The rates for reactions #37-53 are taken from the study of Kruse et al.17 for high-temperature pyrolysis of Acetylene.
IV. Results
The computations presented in this section focus on the analysis of surface recession and in-depth thermal response for the PICA heat-shield material. The loosely coupled DPLR/TITAN computations using the modified Park’s finite-rate air-carbon interaction model described in previous sections are performed for arc-jet flow over a stagnation test model. Model validation is accomplished by comparison of predictions with data from seven selected arc-jet tests conducted over a range of stagnation heat flux and pressures ranging from 107 W/cm2 at 2.3 kPa to 1100 W/cm2 at 84 kPa.14 The test conditions for these seven test cases are listed in Table 1.
Table 1: Seven arc-jet cases selected for detailed analysis. Case number Stagnation point heat flux,
W/cm2
(cold wall)
Stagnation point pressure, kPa Exposure time, s Total enthalpy MJ/kg 1 107 2.3 55 15.2 2 169 5.0 60 17.0 3 246 8.5 42 19.3 4 395 17.2 34 21.4 5 552 27.3 30 23.3 6 744* 31.0 27 29.2 7 1102 84.4 10 25.6
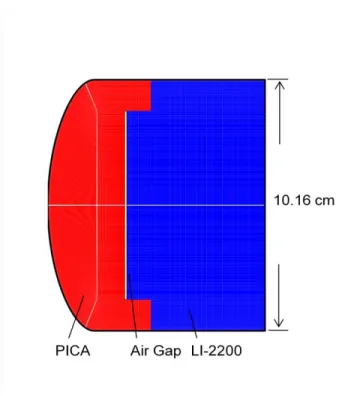
Figure 2 shows the shape of stagnation model used in these tests. The nose radius equals to the model diameter, and the sides are cylindrical. This is the so called “iso-q” geometry (rn = 5.08 cm, and rc/rn = 1/16). The detailed comparisons among two finite-rate approaches (modified Park’s and Zhulktov’s) and the chemical equilibrium approach adopted in our previous paper2 will also be discussed.
* Case 6 was recently repeated for testing of a different TPS system. The average cold wall heat flux measurement was 694 W/cm2
Figure 2. Geometry and material map of model usd in the arc-jet tests.
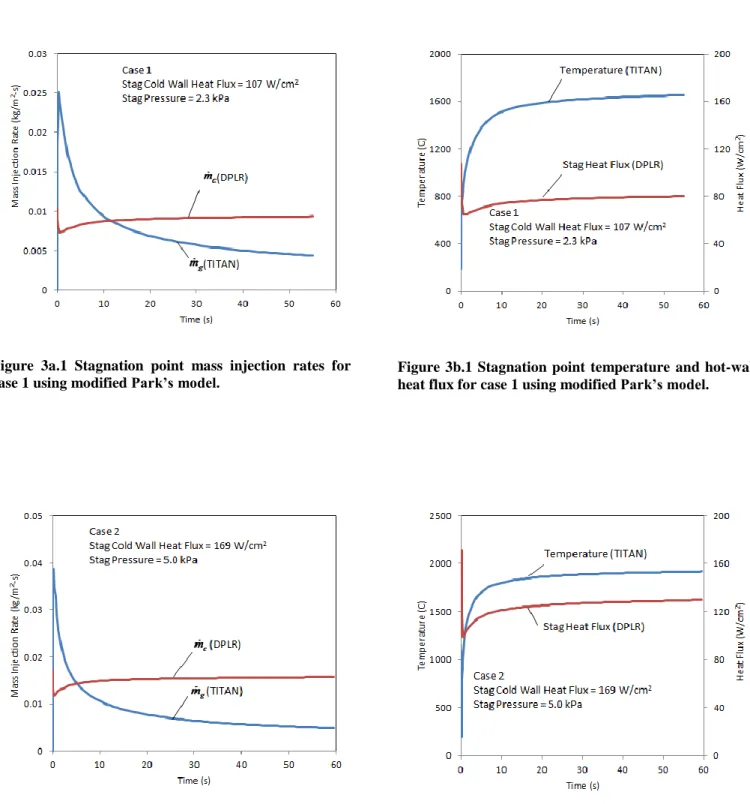
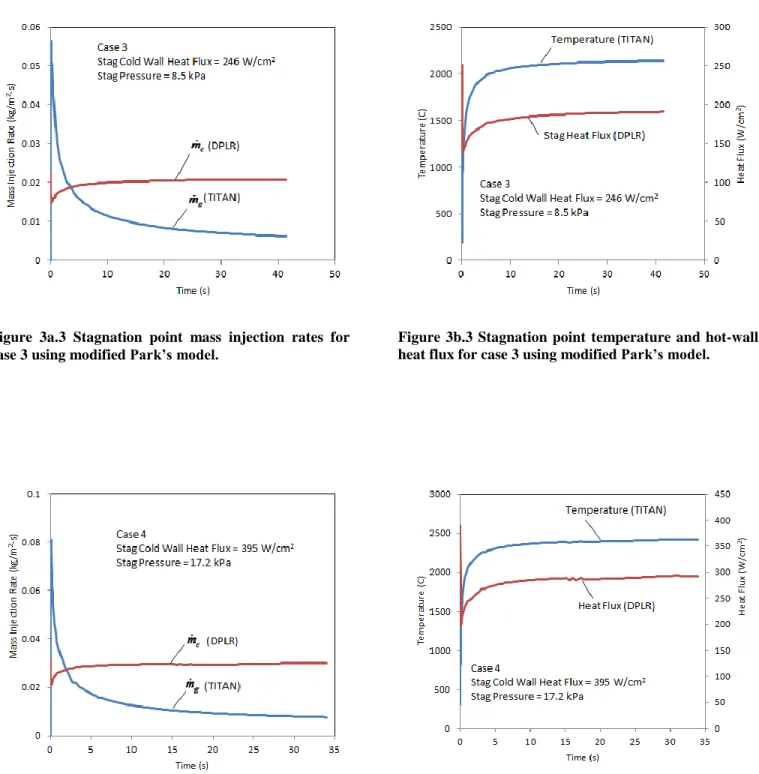
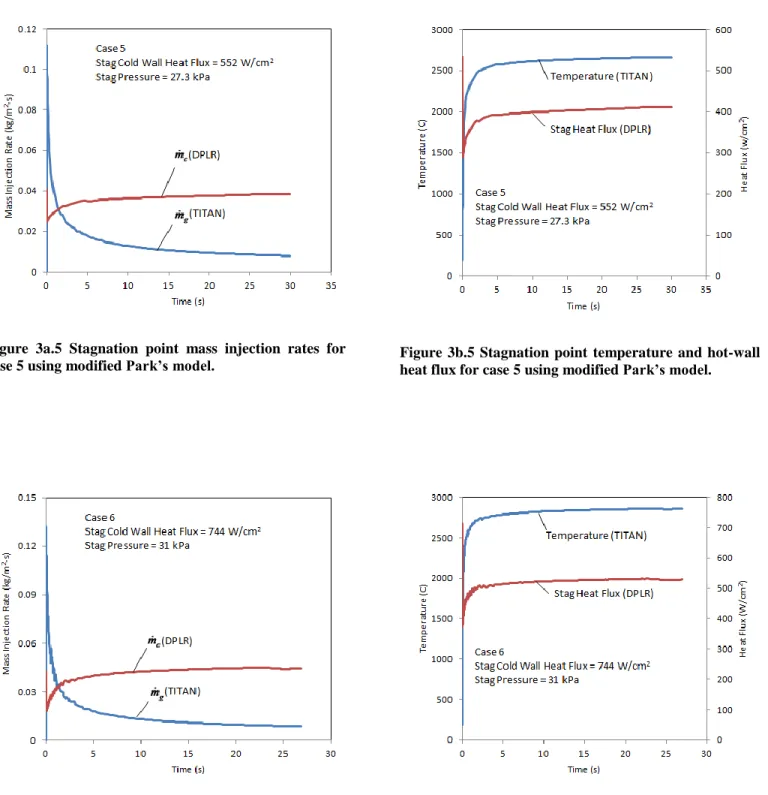
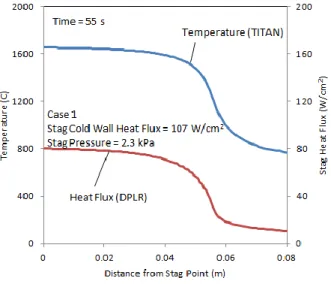
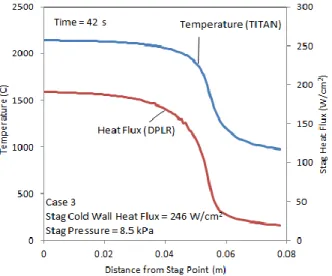
Figures 3a and 3b present the predicted histories of mass injection rates, heat flux, and temperature at the stagnation point based on modified Park’s surface chemistry for all seven test cases. The species mass conservation equation at the surface is solved in DPLR, and thus the char mass injection rate and surface heat flux are predicted by DPLR (red lines). However, the energy conservation equation at the surface is solved in TITAN. The pyrolysis gas mass injection rate and surface temperature are predicted by TITAN (blue lines). Computation starts with the initial temperature at 20 °C. The initial surface heat flux is thus a so-called cold wall heat flux. Then, it immediately drops to a minimum value. This is the result of blowing reduction effect from a very high pyrolysis gas injection rate at the beginning of the tests. The pyrolysis gas injection rate then gradually declines to a steady state value. Char mass injection rate is very sensitive to surface heat flux. Hence, the history of char mass injection rate is similar to that of surface heat flux. The char mass injection rate drops to a minimum value right after PICA is exposed to the arc stream, and then gradually increases to a steady state value. Generally speaking, the stagnation test models subject to higher heat flux have higher surface mass injection rates for both char and pyrolysis gas, as compared with those subject to lower heat flux. Pyrolysis gas mass injection rate is always higher than char mass injection rate at the beginning of each test. Then, char injection rate becomes higher than pyrolysis gas injection rate as they are approaching their steady state conditions, unless the surface temperature is not high enough to have sufficient carbon oxidation. In cases 6 and 7, the predicted mass injection rates are fluctuating in the first few seconds. This oscillating behavior of mass injection rate first comes from the oscillation of surface heat flux predicted by DPLR. The oscillation in heat flux prediction is seen only for cases with relatively high surface heat flux. The reason for oscillation at high heat fluxes is not fully understood, and this issue needs to be resolved in the future work. Nonetheless, this should not have significant impact on the accuracy of numerical simulations presented in this paper.
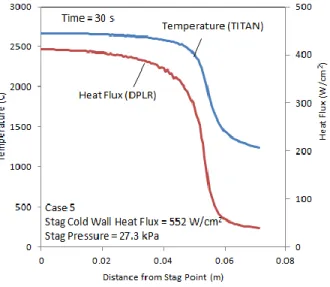
The distributions of mass injection rates, heat flux, and temperature along the test model surface at the end of exposure time for each test case are shown in Figs. 4a and 4b. As expected, the predicted mass injection rates, heat flux, and temperature appear to be fairly uniform along the front surface of an iso-q, and then drop dramatically around the corner. The heat flux at the side wall surface is about 10 to 15% of that at the front surface. The ratio between pyrolysis and char mass injection rates at the stagnation point is not a constant. It is 0.461 for case 1, and, as heat flux increases, it decreases to 0.181 for case 7. The predicted stagnation surface temperature ranges from 1650 °C for case 1 to 3050 °C for case 7. The predicted stagnation-point char mass injection rate is compared with the measured mean char mass injection rate (symbol) which is the product of measured mean surface recession rate and char density. The agreement between prediction and measurement is excellent except case 7. In case 7, the predicted char mass injection rate is about 20% below the measured mean value. The char recession for case 7 is
mainly due to the sublimation of solid carbon. However, in the first six cases, the char recession rate is limited by species mass diffusion rate.
Figures 5 show the mass fractions of major chemical species (CO, NO, C3, H2, N2, N, O, and H) along stagnation streamline for all seven cases. Species mass fractions are presented in log scale. The species mass fractions computed based on the assumption of chemical equilibrium surface (symbols in red) are also presented for comparison. The predicted species distributions do indicate that species with low molecular mass (such as H) diffuse at faster rates than species with high molecular mass (such as C3), as expected. The most abundant ablation product is CO, which is the product of surface carbon oxidation. Almost all O is consumed through oxidation reaction with carbon surface. O2 concentration is far too low, and thus its reaction with carbon surface can be ignored. For cases with lower heat flux (cases 1 to 4), H2 is the second most abundant ablation product at the surface, and for those with higher heat flux (cases 5 to 7), C3 is the second most abundant ablation product at the surface. H2 comes from pyrolysis gas and C3 is the product of the sublimation of solid carbon. Sublimation is insignificant at relatively low surface temperature, and thus the mass fraction of C3 is less than that of H2 for lower surface heat flux cases. As surface temperature increases, H concentration increases as a result of the increase of H2 decomposition rate. As compared with the predictions using a chemical equilibrium surface model, the finite-rate model predicts higher C3 but lower H and H2 concentrations at the surface for all seven test cases.
For all test cases, the comparisons of in-depth thermal response at various depths between finite-rate computation (black lines) and thermocouple data (red lines) are presented in Fig. 6. The in-depth predictions based on the assumption of chemical equilibrium surface (blue lines) are also shown in the plots. The thermocouple locations of the arc-jet models are listed in Table 2. The thermocouple locations for cases 1 to 3 follow Option A, for cases 4 and 5 follow Option B, and for cases 6 and 7 follow Option C. The agreement between thermocouple data and finite-rate computation is very good from cases 1 through 6. However, for case 7, the non-equilibrium predictions appear to be lower than the data. This is because the non-equilibrium model under-predicts surface heat flux. In this case, the chemical equilibrium model agrees better with data than the non-equilibrium model does. Case 7 is the only case in which surface temperature is high enough for carbon surface to reach the sublimation dominant region. The predictions of chemical equilibrium surface model agree reasonably well with data except case 6, in which chemical equilibrium surface model over-predicts the in-depth temperature histories. This implies the cold wall heat flux used in chemical equilibrium computation for case 6 is too high. This finding is consistent with the recent cold wall heat flux measurement of 694 W/cm2.
Table 2: In-depth thermocouple locations of the arc-jet models. Axial depth, cm
TC number Option A Option B Option C
1 0.381 0.508 0.635
2 0.762 0.889 1.016
3 1.143 1.270 1.397
4 1.524 1.651 1.778
5 3.048 3.048 3.048
All the non-equilibrium finite-rate predictions presented in Figs 3 to 6 are based on modified Park’s carbon surface chemistry model. The predictions based on Zhluktov’s carbon surface chemistry model are also obtained. The comparison of stagnation-point hot wall heat flux for seven cases computed based on these two finite-rate surface chemistry models is shown in Fig. 7. The predictions using modified Park’s model (squares) agree quite well with the chemical equilibrium surface model in which the blowing reduction parameter is equal to 0.5 (circles). Their difference slightly increases as the surface heat flux increases. The surface heat fluxes predicted using Zhluktov’s surface chemistry model (triangles) appear to be far too low as compared with the other two models at high heating conditions (cases 4-7). The comparison of computed stagnation-point char mass blowing rate for two non-equilibrium surface chemistry models with the equilibrium model is shown in Fig. 8a. Figure 8b presents the comparison of stagnation-point char mass injection rates among measurements and two surface chemistry models for seven cases. Generally speaking, char recession rates computed using the modified Park’s model are in excellent agreement with data except case 7, in which the prediction is about 20% below the measurement. As mentioned earlier, case 7 is the only sublimation dominant case studied in this work. To further advance prediction accuracy, Park’s sublimation model requires some enhancement. Zhluktov’s surface chemistry model generally significantly under-predicts char recession rates for all test cases. Zhluktov’s model is considered to be more sophisticated than Park’s model. Park’s model contains only simple engineering one-way (forward) reactions. However, as compared
with data, Zhluktov’s model is certainly not in favor. Further studied is required to understand the deficiency associated with Zhluktov’s carbon surface model and reaction rates to improve its prediction accuracy.
Figure 3a.1 Stagnation point mass injection rates for case 1 using modified Park’s model.
Figure 3b.1 Stagnation point temperature and hot-wall heat flux for case 1 using modified Park’s model.
Figure 3a.2 Stagnation point mass injection rates for
Figure 3b.3 Stagnation point temperature and hot-wall heat flux for case 3 using modified Park’s model.
Figure 3a.3 Stagnation point mass injection rates for case 3 using modified Park’s model.
Figure 3a.4 Stagnation point mass injection rates for case 4 using modified Park’s model.
Figure 3b.4 Stagnation point temperature and hot-wall heat flux for case 4 using modified Park’s model.
Figure 3a.5 Stagnation point mass injection rates for
case 5 using modified Park’s model. Figure 3b.5 Stagnation point temperature and hot-wall heat flux for case 5 using modified Park’s model.
Figure 3a.6 Stagnation point mass injection rates for case 6 using modified Park’s model.
Figure 3b.6 Stagnation point temperature and hot-wall heat flux for case 6 using modified Park’s model.
Figure 3a.7 Stagnation point mass injection rates for case 7 using modified Park’s model.
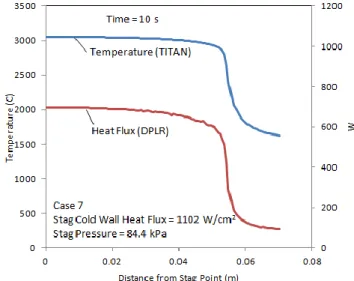
Figure 3b.7 Stagnation point temperature and hot-wall heat flux for case 7 using modified Park’s model.
Figure 4a.1 Mass injection rate distributions using modified Park’s model for case 1.
Figure 4b.1 Surface temperature and heat flux distributions using modified Park’s model for case 1.
Figure 4a.2 Mass injection rate distributions using modified Park’s model for case 2.
Figure 4b.2 Surface temperature and heat flux distributions using modified Park’s model for case 2.
Figure 4a.3 Mass injection rate distributions using modified Park’s model for case 3.
Figure 4b.3 Surface temperature and heat flux distributions using modified Park’s model for case 3.
Figure 4a.4 Mass injection rate distributions using
modified Park’s model for case 4. Figure 4b.4 Surface temperature and heat flux
Figure 4a.5 Mass injection rate distributions using modified Park’s model for case 5.
Figure 4b.5 Surface temperature and heat flux distributions using modified Park’s model for case 5.
Figure 4a.6 Mass injection rate distributions using modified Park’s model for case 6.
Figure 4b.6 Surface temperature and heat flux distributions using modified Park’s model for case 6.
Figure 4a.7 Mass injection rate distributions using modified Park’s model for case 7.
Figure 4b.7 Surface temperature and heat flux distributions using modified Park’s model for case 7.
Figure 5.1 Species mass fractions along stagnation streamline for case 1.
Figure 5.2 Species mass fractions along stagnation streamline for case 2.
Figure 5.3 Species mass fractions along stagnation
Figure 5.5 Species mass fractions along stagnation streamline for case 5.
Figure 5.6 Species mass fractions along stagnation streamline for case 6.
Figure 5.7 Species mass fractions along stagnation streamline for case 7.
Figure 6.1 Comparison of in-depth temperatures between prediction and TC data for case 1.
Figure 6.2 Comparison of in-depth temperatures between prediction and TC data for case 2.
Figure 6.3 Comparison of in-depth temperatures between prediction and TC data for case 3.
Figure 6.4 Comparison of in-depth temperatures between prediction and TC data for case 4.
Figure 6.5 Comparison of in-depth temperatures
between prediction and TC data for case 5. Figure 6.6 Comparison of in-depth temperatures between prediction and TC data for case 6.
Figure 6.7 Comparison of in-depth temperatures between prediction and TC data for case 7.
Figure 7 Comparison of computed stagnation point hot-wall heat fluxes for two non-equilibrium models with the chemical equilibrium model.
Figure 8.a Comparison of computed stagnation point char mass blowing rates for two non-equilibrium models with the chemical equilibrium model.
Figure 8.b Comparison of computed stagnation point char mass blowing rates for two non-equilibrium models with the arc-jet data.
V. Conclusions
A new DPLR/TITAN coupling simulation system has been developed. In this simulation system, the surface species mass balance is performed in DPLR, and the surface energy balance is performed in TITAN. The hot-wall ablating convective heat flux is directly computed in DPLR based on the surface temperature and pyrolysis gas injection rate computed in TITAN. The blowing reduction correlation is no longer needed in the material response simulation.Coupled fluid-material response analyses of stagnation tests conducted in NASA Ames Research Center arc-jet facilities were performed. The ablating material used in these arc-jet tests was a Phenolic Impregnated Carbon Ablator. Computational predictions of in-depth material thermal response and surface recession were compared with the experimental measurements for stagnation cold-wall heat fluxes ranging from 107 to 1100 W/cm2.
Two sets of non-equilibrium finite-rate gas/surface interaction model between air and carbon surface were examined. Computations indicate modified Park’s air-carbon chemistry model agrees better with the arc-jet data than Zhluktov’s surface chemistry model does. Zhluktov’s model significantly under-predicted the char mass injection rates for all the test cases, and also under-predicted the surface heat flux for cases with relatively high surface heat flux. The results predicted by modified Park’s model are in excellent agreement with data for the cases in which carbon recession rate is limited by species diffusion. For case 7, in which sublimation is the dominant carbon ablation mechanism, modified Park’s model under-predicted char mass injection rate by about 20%, and also under predicted the in-depth material thermal response of PICA. Additionally, using modified Park’s non-equilibrium surface chemistry model, DPLR/TITAN tends to predict more C3 and less H2 and H concentrations at the surface compared with using chemical equilibrium surface model. Improvement needs to be made in modified Park’s carbon sublimation model to further advance the accuracy of prediction. The reaction rates suggested in Zhluktov’s model need to be thoroughly reexamined before they can be used for spacecraft entry simulations.
Acknowledgements
This work is funded by the NASA Fundamental Aeronautics Program Hypersonics Project.
References
1Gökçen, T., Chen, Y.-K., Skokova, K. A., and Milos, F. S., "Computational Analysis of Arc-Jet Stagnation Tests including Ablation and Shape Change," Journal of Thermophysics and Heat Transfer, Vol. 24, No. 4, October-December 2010, pp 694-707.
2Chen, Y.-K., Milos, F. S., and
Gökçen, T., "Loosely Coupled Simulation for Two-Dimensional Ablation and Shape Change," Journal of Spacecraft and Rockets, Vol. 47, No 5, September-October 2010, pp. 775-785.
3
Wright, M. J., Candler, G. V., and Bose, D., "Data-Parallel Line Relaxation Method for the Navier-Stokes Equations," AIAA Journal, Vol. 36, No. 9, Sept. 1998, pp 1603–1609.
4Chen, Y.-K., and Milos, F.S., "Two-Dimensional Implicit Thermal Response and Ablation Program for Charring Materials," Journal of Spacecraft and Rockets, Vol. 38, No. 4, 2001, pp. 473-481.
5MacLean, M., Marschall, J., and Driver, D., "Finite-Rate Surface Chemistry Model, II: Coupling to Viscous Navier-Stokes Code," AIAA-2011-3784 , 42nd AIAA Thermophysics Conference, Honolulu, Hawaii, June 27-30, 2011.
6
Park, C., and Ahn, H. K., "Stagnation-Point Heat Transfer for Pioneer-Venus Probes, " Journal of Thermophysics and Heat Transfer, Vol. 13, No. 1, January-March 1999, pp. 33-41.
7Zhluktov, S. V. and Abe, T., "Viscous Shock-Layer Simulation of Airflow past Ablating Blunt Body with Carbon Surface, " Journal of Thermophysics and Heat Transfer, Vol. 13, No. 1, January-March 1999, pp. 50-59.
8Tran, H., Johnson, C, Rasky, D., Hui, F., Chen, Y.-K., and Hsu, M., "Phenolic Impregnated Carbon Ablators (PICA) for Discovery Class Missions," AIAA Paper 96-1911, June 1996.
9Chen, Y.-K., and Milos, F. S., " Navier-Stokes Solutions with Finite-Rate Ablation for Planetary Mission Earth Re-entries," Journal of Spacecraft and Rockets, Vol. 42, No. 6, 2005, pp. 961-970.
10
Anon., User’s Manual: Aerotherm Chemical Equilibrium Computer Program, Acurex Corporation, Aerotherm Division, Mountain View, CA, Aug. 1981.
11Milos, F.S., and Chen, Y.-K., "Comprehensive Model for Multi-Component Ablation Thermochemistry," AIAA Paper 97-0141, Jan. 1997.
12Chen, Y.-K., and Milos, F. S., "Effect of Non-equilibrium Chemistry and Darcy-Forchheimer Flow of Pyrolysis Gas for a Charring Ablator," AIAA-2011-3122 , 42nd AIAA Thermophysics Conference, Honolulu, Hawaii, June 27-30, 2011.
13Marschall, J., and MacLean, M., "Finite-Rate Surface Chemistry Model, I: Formulation and Reaction System Examples," AIAA-2011-3783, 42nd AIAA Thermophysics Conference, Honolulu, Hawaii, June 27-30, 2011.
14Milos, F. S., and Chen, Y.-K., "Ablation and Thermal Property Model for Phenolic Impregnated Ablator (PICA)," NASA TM-2009-215377, January 2009.
15Olynick, D. R., Chen, Y-K, and Tauber, M. E., "Aerothermodynamics of the Stardust Sample Return Capsule, "
Journal of Spacecraft and Rockets, Vol. 36, No. 3, May-June 1999, pp. 442-462. 16Gökçen
, T., "N2-CH4-Ar Chemical Kinetic Model for Simulations of Titan Atmosphere Entry," J. of
Thermophysics and Heat Transfer, Vol. 21, No. 1, Jan.-March 2007, pp 9-18. 17Kruse, T. and Roth, P., "Kinetics of C
2 Reactions during High-Temperature Pyrolysis of Acetylene,"