Equal Pay for Equal Work? Evidence from Sweden and a comparison with
Norway and the U.S. *
by
Eva M. Meyersson Milgrom
Trond Petersen Vemund Snartland
Stockholm University, Stockholm
University of Oslo, Oslo and University of California, Berkeley
NOVA – Norwegian Social Research, Oslo
(First version May 1997) (Second version July 1999)
(Third version April 2000) (Fourth version January 2001)
*
This article is based on individual-level wage data made available by the main employers’ association in Sweden, the Swedish Employers’ Confederation (Svenska Arbetsgivare Föreningen, SAF). We are grateful to Ari Hietasalo and Marianne Lindahl at SAF for their extensive and exceptionally expert cooperation in preparing these data for analysis. We also thank Paul Milgrom, Stanford University and Karen Modesta Olsen at the Institute for Social Research Oslo, who both helped greatly in this study. An earlier version of the paper was presented at SOFI, Stockholm University, Department of Sociology, Stockholm University, the Industrial Institute for Economic and Social Research, Stockholm, FIEF, Stockholm, Department ofEconomics, Uppsala University and the Swedish Employers’ Confederation. ETLA, Helsinki, Finland, the Business School, and Department of Economics at Monash University, Melbourne. We are grateful for financial support from the Swedish Council for Research in the Humanities and Social Sciences (HSFR). An earlier shorter version of this paper is published in Swedish as Lika lön för lika arbete. En studie av svenska förhållanden i internationell belysning, (1997).
Addresses for correspondence: Eva M. Meyersson-Milgrom, Department of Business Administration at Stockholm University, S - 106 91 Stockholm. email: [email protected], tel. + 46 8 674 7439. Trond Petersen, University of California Berkeley, Ca 94720. email: [email protected], tel. +01 510 642 6423.
JEL: J16, J71
Title
Equal Pay for Equal Work? Evidence from Sweden 1970-1990 and a Comparison with Norway and the U.S.
Abstract
Using a new data set covering most privately employed workers in Sweden, we compare gender wage differences to those previously reported for Norway and the US. The central finding is that the wage gap is small when comparing men and women working in the same type of occupation for the same employer. Segregation of men and women by occupation accounts for more of the gap in Sweden than in the other two countries. In all three countries, we find that segregation by occupation explains more than segregation by establishment and that institutional changes over the past two decades that aimed to improve the status of women had little effect on the gender wage gap.
I. Introduction
Many researchers and policy makers have conjectured that wage differences today are less a question of an employer paying men and women differently within given occupations or jobs in given establishments, and more a matter of who gets which jobs and how female-dominated occupations are evaluated in the market (SOU 1998:6, Blau 1998, Loury 1998).
In order to investigate this conjecture carefully, one needs unusual data that compares the pay of men and women working in the same occupation or type of job in the same
establishment. Only when employees are doing the same job in exactly the same circumstances is it clear whether or not they are doing work of equal value. And only when we compare people doing the same job for the same employer is it possible to determine whether the employer profits from wage discrimination, which is an important determination in devising remedies.
Although case studies of single establishments shed some light on these issues, there are few systematic studies of the extent to which an employer pays men and women differently for the same type of job. The two exceptions are one study covering the U.S. (Petersen and Morgan 1995) and another covering Norway (Petersen et al. 1997). It remains unclear to what extent the empirical results depend on the particular institutions of the two countries studied.
In this study we add a comparative and comprehensive analysis of data from the private sector in a European welfare state, Sweden.1 We look at how institutional settings influence changes in the gender wage gap. First we focus on changes over a 20-year period in Sweden. Then, we relate the results to the two earlier compatible studies covering the US and Norway to see whether and how the different institutions in these countries affect the conclusions.
The Swedish data, which is newly released for research, encompasses entire populations of establishments in several Swedish industries that together account for about 40
percent of employment in the private sector. The data cover entire subpopulations in the private sector over 20 years. We analyze data at five-year intervals from 1970-1990 plus the year 1978, which allows us to assess the impact of the Equal Pay Act enacted in 1979.
We ask five questions: (1) What is the wage gap at the occupation-establishment level in Sweden? (2) Is the overall wage gap in Sweden better explained by segregation in establishments or segregation in occupations? (3) What is the extent of segregation in establishments, occupations, and occupation-establishment pairs in Sweden? (4) What are the changes over a 20-year period in (1)-(3) above? (5) How does what is reported in (1)-(3) differ among the three countries: Sweden, the U.S. and Norway?2
The data affirm that, for Sweden, within-occupation-establishment wage differences account for very little of the wage gap between men and women. Rather, the segregation of men and women among establishments and, especially, among occupations accounts for almost the entire gap in the Swedish data. Moreover, the gap, at both the occupation and
occupation-establishment levels, has been stable for the period 1978-1990, despite substantial changes in family policies and increased wage inequality in the 1980s. The pattern of results is similar to those found in the U.S. and Norway, but occupation and establishment segregation, considered separately, explain more of the gap in Sweden than in the other countries.
II. Discrimination
Wage differences between men and women caused by discrimination can come about in three general ways 3 In allocative discrimination, an employer may allocate women and men differently to occupations and establishments that differ in the wages they pay. This may involve
discrimination in hiring, promotions, or layoffs. In as within-occupation-establishmentwage
occupation within a given establishment.4 Finally, in valuative discrimination, an employer may pay less for jobs filled primarily by women less than for jobs filled primarily by men, even though skill requirements and other wage-relevant factors are the same. Policies that equalize wages for jobs of “comparable worth” are sometimes justified as attempts to remedy valuative discrimination.
In allocative- and within-occupation-establishment wage discrimination, employers discriminate against individuals in assignments and pay. Valuative discrimination, on the other hand, entails discrimination against classes of jobs occupied primarily by women rather than against any specific individual and therefore it is primarily a structural labor-market problem.
In this paper we will primarily assess within-occupation-establishment discrimination.5 How has it developed over a 20-year period in Sweden and how does it compare with the situation in Norway and the U.S.?
III. Institutional Frameworks
The longitudinal data from Sweden present a valuable and rare opportunity to analyze the effects of institutional change within a country. Furthermore, comparing the results of the three countries (Norway, U.S. and Sweden) provides an indication of how institutional differences influence the gender wage gap.
In Sweden, an equal pay act was passed in 1979 and became effective in 1980 (e.g., SOU 1993, pp. 49. 172).6 The act outlawed within-occupation-establishment wage discrimination. A comparison of conditions in Sweden in the period 1970-1990, especially of 1978 and 1980, immediately before and after the equal pay act passed in 1979, is particularly interesting, as it gives information relevant both to theory and to social policy.
Although the sex equality laws in the three countries are rather similar, there are several differences in the legal systems and enforcement of the laws. For
within-occupation-establishment wage discrimination, perhaps most important is that the penalties imposed on employers found guilty of discrimination are larger in the U.S. than in the other two countries. Furthermore, the legal systems and legal cultures are quite similar in Sweden and Norway but very different from those in the U.S. One difference between the countries is that it is difficult or even impossible to bring class-action suits to the courts in Sweden and Norway (SOU 1993, p. 54; NOU 1997, pp. 90. 134).
Another difference of institutional settings is that Sweden and Norway have strong egalitarian traditions, allowing for much less inequality in pay than the U.S. (see Fritzell 1991). The countries are at opposite ends of the spectrum with respect to wage and income inequality. The distribution of market rewards before taxes may be more unequal in Sweden than Norway. But Sweden has a more progressive tax system, so that disposable income after taxes and transfers is more equal in Sweden than in Norway (e.g., Fritzell 1991 pp. 143-48, Table 5 p. 174).
The greater equality of wages across jobs in Sweden and Norway compared to the U.S. can have a variety of significant empirical consequences. First, the overall gender wage gap may be lower in Sweden and Norway, given that women are concentrated in the lower-paying jobs.7 Second, occupational sex segregation may explain more of the gap in the U.S. than in Sweden, because inter-occupational wage inequality is higher in the U.S. At the same time there is also more intra-occupational wage inequality in the U.S. and probably less occupational sex segregation (Blau and Kahn 1996, Table 3 p. S40). Both counteract the first effect, the increase in wage inequality, and may result in less importance of occupation for explaining the gender wage gap.8 In the U.S., the amount of wage inequality increased in the 1980s, which, ceteris paribus, would worsen the relative position of women. But instead women improved their position
compared to men precisely because sex segregation on occupations decreased in that women to a higher degree than before had access to highly paid jobs in the professions and elsewhere (see
Blau and Kahn 1997, Table 5 p. 27 column 2). So the net effect of wage inequality on the gender wage gap depends on both occupational sex segregation and on inter- and intra-occupational wage inequality.
Perhaps the clearest expression of the aversion to inequality is in the system of solidaristic wage bargaining in Sweden, which was particularly strong in the period 1950-1983. Conscious attempts were made to minimize wage differences between various groups and to institute the principle of equal pay for equal work and sometimes even equal pay for all. Edin and Richardsson 1999 report: “….based on strong ideological convictions among the union leaders and the membership at large, the aim of the policy turned to overall wage equalization.” But since 1983, when the central bargaining system started to dissolve, there has been a move toward less rigid wage policies (SOU 1993, pp. 76-78). Hence, the Swedish data make it possible for us to ask how the decline in solidaristic wage bargaining affect the wage gap at various levels: overall, within occupations, within establishments, and within-occupation-establishment units.
Finally Swedes express great concern for equality of the sexes, as is particularly apparent in the political sphere. This concern has been expressed in the area of family policies, where Sweden since the 1970s has had more extensive and progressive policies than any other country. Maternity as well as paternity leaves have been more extended than elsewhere, and childcare is provided universally with a strengthening of policies since 1979.9 Norway has less extensive family policies than Sweden, but the U.S. adopted similar policies only much later (see Kamerman 1988, 1991a,b). For example, since 1937, Sweden has had laws providing job
protection during absences in the period before and after childbirth. Norway has had similar policies since 1977, while the U.S. passed the first such legislation in 1993.10 Hence comparisons between the three countries can give an indication of the impact of extensive family policy and childcare on the gender wage gap and in particular the within-job-establishment gap.
IV. Data
The Swedish data were collected and compiled by the Swedish Employers' Confederation (SAF) from their database on wage statistics, assembled from establishment-level personnel records. Compared to the Norwegian and the U.S. studies, these data are even more extensive and detailed and contain information for all blue- and white-collar workers in every industry (except the insurance and banking industries) in the private sector within the SAF domain.11 Member firms have provided information to the database from 1970 up to 1990, once or twice a year. The data have been used for inputs in the yearly wage negotiations and are monitored not only by SAF but also by the labor unions. Hence the data are of exceptionally high quality. They should be very reliable compared to standard sample surveys with personal reports of pay rates and hours worked.
The establishment characteristics include the following: detailed industry code; size (the number of employees); region and area within region. For each employee surveyed,
information was obtained on method of wage payment (incentive- or time-rated), education, age, hours worked, part-time or full-time employed, union status and if unionized the name of the union, and a detailed description of job content, usually a four-digit code.12 We shall refer to this job content information as occupational codes, although it might also be described as job titles. The occupational codes for the blue-collar workers are industry-specific and detailed, typically corresponding to the titles used in collective agreements. The white-collar occupations are less detailed, covering altogether 276-285 positions. Ten occupation areas (for instance, construction and design), and 51 broad occupational groups (for instance. construction work), with detailed information about task content are included. Within each group a further distinction is made with respect to the level of difficulty in the job, a code that runs from 2 (high) to 8 (low), for our present purposes we have recoded it as 1 (low) to 7 (high) which we refer to as ranks. Not all occupations
span the entire 7 ranks, some start higher than rank 1 and some do not have the top ranks. 5-7. The cross-classification of 51 occupational groups and 7 ranks yields 276-285 occupation-by-rank groups, which we refer to as occupations for short.13
The titles in the present data do predominantly indicate content of work, including aspects of the amount of responsibility involved, such as whether the incumbent is in a position of leadership or supervision. Within the restaurant business, for instance, there are 14 job titles, among them cook, cold buffet manager, cutter, and cook assistant. It is naturally a question of judgment when titles are too fine or too coarse. The equal pay laws require that likes should be treated alike. As long as the titles delineate differences in content of work and responsibilities, they are treated as unlike jobs. Note, however, that we show in section 5 that the occupation titles are not so fine as to rule out all wage differences.
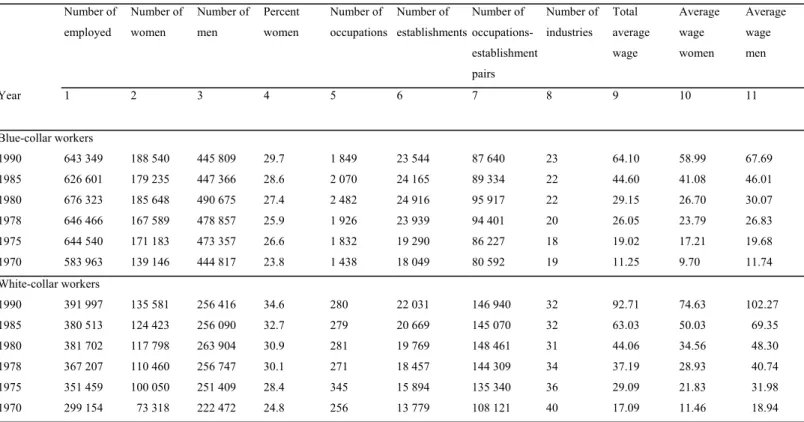
The data for blue- and white-collar workers covers practically the entire occupational spectrum, including managers and professionals. Chief executive officers and members of executive teams are excluded. The system of white-collar occupation coding is the same across industries while it differs for blue-collar workers. An overview of the data is given in Table 1.
[Table 1 about here]
Focusing on 1990, we have information on 643 349 and 391 997 blue- and white-collar employees respectively. Among the blue-collar workers there were 1 849 occupations. 23 544 establishments, and 87 640 occupation-establishment units. And among the white-collar workers there were 280 occupations, 22 031 establishments, and 146 940 occupation-establishment units.
The wage data are reported in an unusually detailed manner. For each person, the wages (as well as hours worked) are reported separately for pay earned during regular hours and pay earned during overtime hours. Furthermore, for employees who receive one part of their pay from time-rate jobs and another part from incentive-rated jobs (i.e., piece-rates. bonuses. or
commissions), the wages are specified separately by form of pay for the two components: baseline (i.e., fixed) pay and incentive pay. For blue-collar workers, the wages are given in hourly units, whereas for white-collar workers they are given as monthly pay in full-time equivalents.
The partition of the wage data into the part earned on regular hours and the part earned on overtime is very important. It makes the wage data less prone to bias than virtually every other study used for assessing wage discrimination. 14 Moreover, unlike most studies, we need not impute hourly wages from monthly earnings and hours worked. Our information on how employers pay their employees is quite precise, not meshing labor supply and other adaptations by employees with pay rates actually paid to men and women.
V. Methods
We report the relative wages of men and women at various levels, always maintaining a distinction between blue- and white-collar workers. (See Appendix for technical details.) We first compute the raw gender wage ratio as the average female wage to the average male wage, expressed in
percentage terms. For example, the number 88 percent means that on average women earn 12 percent less than men. We then recompute the ratio separately for each industry, each occupation, each establishment, and each occupation-establishment unit the average female wage as a
percentage of the average male wage. This can be done only for industries, occupations, establishments, and occupation-establishment units that are sex integrated.
Next, we compute the average of these ratios across the sex-integrated units, that is, across industries, occupations, establishments, and occupation-establishment units. For example, at the occupation-establishment level, we compute the average of the ratios of the female wage to the male wage at each sex-integrated occupation-establishment pair and express the result in percentage terms.15
These computations give the average relative wages for each of four kinds of categories: industry, occupation, establishment, and occupation-establishment. The wage gap in each case is 100 minus the corresponding wage ratio. These computations allow us to report the percentage of the raw wage gap explained separately by each of the four categories. For example, the percentage explained by occupation-establishment is computed as the raw gap minus the occupation-establishment level gap, divided by the raw gap. (See Appendix Equation 6, which expresses the same thing in terms of the wage ratios.)
The average wage gap at the occupation-establishment level gives an estimate of an upper bound on the amount of within-occupation-establishment wage discrimination, the quantity of greatest interest here. But the within-occupation and within-establishment gaps are also of interest, as they document the extent to which differential distribution of men and women on occupations and establishments can account for the overall gender wage gap.
Wages and Positions
One issue requires attention before we present our results. In Sweden, Norway, and in most European countries, firm-internal wage structures are quite rigid: Unlike the US, a fixed wage or salary is often attached to each position. Thus, one may be concerned that job categories are defined so narrowly that the job determines the wage, rendering wage discrimination impossible.
To check whether this problem was present in our data, we computed the percentage range in wages separately for each occupation and each occupation-establishment unit. First, we computed the ratio of the highest wage to the lowest wage in each occupation and each occupation-establishment unit, subtracting one and expressing the result in percentage terms. Then, we took the average of this percentage across all occupations and all occupation-establishment units. The wage range could be computed in many different ways. For our practical purposes and for the sake of
using all available information, we have chosen the computation based on maximum and minimum extreme values. We have made the same type of computations for the standard deviation and the coefficient of variation, with no differences with respect to the point to be made here. Some cells however did not contain enough individuals and hence decreased the total of information available.
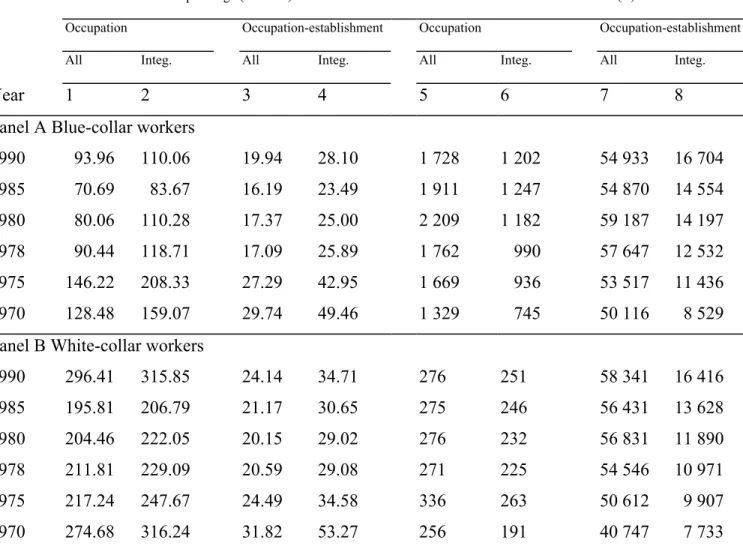
The results are reported in Table 2, for blue- and white-collar workers in panels A and B respectively, separately for each year.
[Table 2 about here]
Let us first select a row from the table and interpret the result. For blue-collar workers in the year of 1990, for instance, the variation in pay within the same occupation and establishment is 28.10 percent. Table 2 shows in a striking way that there is considerable variation in wages at the occupation and the occupation-establishment levels, in all years. The variation is always larger at the occupation level. It is also larger in units that are sex integrated, at both the occupation and the occupation-establishment levels. The range is three to twelve times larger at the occupation level than at the occupation-establishment level. At the latter level, which is the most relevant here, the average of the range among blue-collar workers in 1990 was 20 percent across all units and 28 percent among units that were integrated by sex. The corresponding numbers among white-collar employees were 24 percent and 35 percent. This means that the best paid person on average earned 20-35 percent more than the lowest paid person, in the occupation and establishment, a considerable range, especially for an egalitarian state such as Sweden.
The range in wages is somewhat higher among white- than among blue-collar workers, perhaps reflecting the coarser occupational titles among the former or perhaps greater flexibility in setting pay among such employees. At the occupation level, the range among blue-collar workers declined from 1975 to 1985 was but increased again between 1985 and 1990, when it reached the same level as in 1978 but lower than in 1970. Among white-collar workers, the range at
the occupation level declined from 1970 to 1985 but increased in 1990, when it reached a higher level than in 1970. At the occupation-establishment level, the range among blue-collar workers declined from 1970 to 1985 but increased between 1985 and 1990, when it reached a higher level than in 1978 but lower than in 1970. Among white-collar workers, the range at the occupation-establishment level declined from 1970 to 1980 but increased in 1985 and 1990, when it reached a higher level than in 1975 but not as high as in 1970. At both levels and for both groups of
employees, blue- and white-collar workers, there were thus first a decrease and then an increase in the range of wages.
VI. Empirical Results
Earlier studies have shown that the average wage of women is about 25 percent below that of men in Sweden (e.g.; SOU 1993;). In this study, focusing on employees in the private sector, we found a similar gap. In 1990, white-collar women on average earned 27.03 percent less than their male counterparts and blue-collar women 12.84 percent less (see Tables 3 and 4).
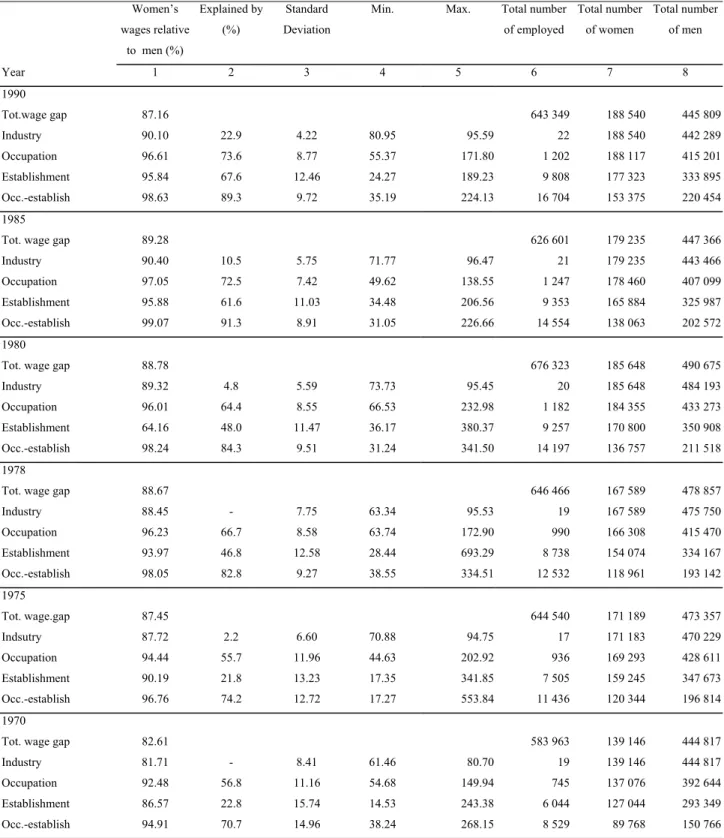
Focusing on blue-collar workers in 1990, we see three striking results in Table 3. The first is that the wage gap is quite small when we compare men and women working in the same occupation for the same employer. In 1990 it was 1.4 percent.
The second result is that occupational segregation is somewhat but not much more important for the gender wage gap than establishment segregation, meaning that differential
allocation of men and women on establishments accounts for a smaller portion of the wage gap. At the occupation and establishment levels the gaps were 3.39 and 4.16 percent respectively, small differences. The percentage of the gap explained by occupational segregation is 73.6 and the percentage explained by establishment segregation is 67.6. (See Table 3 row 2.)
The third result is that the within-occupation gap is relatively small, less than 4 percent. This reflects that within an occupation, wage levels are fairly uniform across firms, irrespective of establishment. So even if men and women are differentially distributed across firms, this does not necessarily translate into a large wage gap as long as occupation is held constant. We shall return to this point in our concluding discussion.
[Table 3 about here] [Table 4 about here]
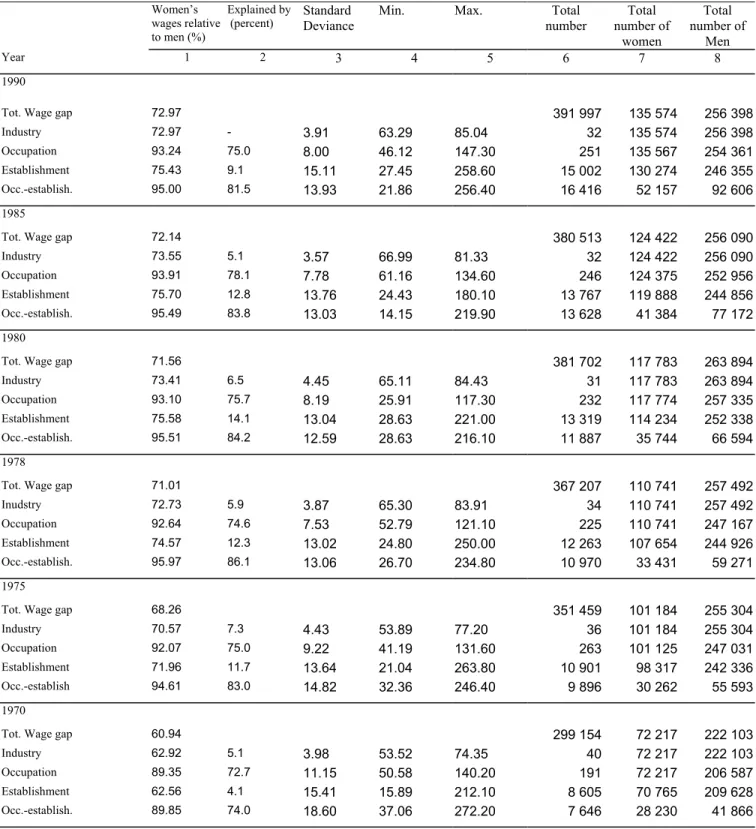
Let us turn next to white-collar workers. The first result from Table 4 shows a wage gap of 5.0 percent at the occupation-establishment level in 1990, with an overall gap of 27.3 percent. The gap is hence bigger among white- than blue-collar workers. But note that the occupational classification of white-collar workers in Sweden is coarse. It encompasses 276 positions across the entire
occupational spectrum and across rather diverse industries. Thus we probably have a large overestimate of the actual gap at the occupation-establishment level.
The second result for white-collar workers pictures the role of occupational
segregation as more important than among blue-collar workers, whereas establishment segregation is of little importance. (Table 4, row 2). The third result is that at the occupation level irrespective of establishment, the gap is also small, less than 7 percent.
For Sweden we have a consistent and long time series for the wage gap, with data for every five years from 1970 through 1990 plus 1978. If we focus first on blue-collar workers, it is striking that the largest changes in the occupation-establishment level wage gap occurred between 1970 and 1978 (prior to the passage of the equal pay act), when it dropped from about 5 percent to its current level of about 1.5 percent. There followed a small but steady decline from 1978 through 1990. Much the same is the case for white-collar workers, where the major drop occurred between 1970 and 1975, except that here the occupation-establishment gap never became as small as among
blue-collar workers. As we argued above, this is most likely an artifact of the data -- the occupational classification is too crude.
At the occupation and establishment levels, the wage gap also declined from 1970 to 1990. Among blue-collar workers the decline was from 13 to 4 percent at the establishment level and from 7.5 to 3.4 percent at the occupation level, with corresponding declines among white-collar employees, for whom the decline was from 27.4 to 24.6 percent at the establishment level and from 10.4 to 6.8 percent and occupation levels.
The Swedish results are quite similar to what was found in the U.S. and in Norway. In Norway the database used by Petersen et al. (1997) is constructed and managed in ways similar as to the Swedish case. It is however, restricted to a few important business sectors and to the years 1990 and 1984. Petersen et al., (1997) found a total wage gap of 11.6 percent for blue-collar
workers, compared to the Swedish figure of 12.64 percent for the year 1990. For the same year the within-occupation-establishment wage gap for blue-collar workers was 3.3 percent in Norway and 1.4 percent in Sweden. For the white-collar workers the total wage gap was 26.9 percent in Norway and 27 percent in Sweden; the within-occupation-establishment wage gap was 6.2 percent in
Norway and 5 percent in Sweden. As in Sweden, the relationships in Norway are stable for the period studied.
Petersen and Morgan’s (1995) results for the U.S. are very similar to those of Norway and Sweden. The study assessed wage differences between men and women employed in the same detailed occupation and establishment, using data collected by the U.S. Bureau of Labor Statistics covering about 1.5 million employees in the period 1974-1983. The total wage gap for blue-collar workers was 19.2 percent and for white-collar workers 15 percent. Within given occupation-establishment units, wage differences were relatively small: on average women earned 1.7 percent
less than men among blue-collar and clerical employees, and 3.1 percent less in seven professional and three administrative occupations.
Furthermore, for Sweden, 73.6 percent of the 1990 blue-collar gender wage gap is explained by occupational segregation and 67.6 percent is explained by establishment segregation. For Norway, the corresponding figures are 71.4 percent and 77.2 percent. For the US, they are 63.8 and 24.3 percent. The occupational segregation statistics appear similar in all three countries, although the contribution of establishment segregation appears much smaller in the US.16
VII. Summary of Findings and Discussion
The first and central finding is that, when we compare men and women working in the same occupation for the same employer, the wage gap has been small for the past 20 years. At the occupation-establishment level, the gap defined in this way is lowest among blue-collar workers, about 1.4 percent, while it is larger among white-collar workers, about 5 percent. This larger gap may reflect that the occupational codes among white-collar workers are cruder than those we have access to among blue-collar workers. The second group of findings compares the relative power of segregation by occupation or establishment to explain the gender wage gap. For white-collar workers, occupational segregation is far more important. Establishment segregation explains just 9.1 percent of the gap, whereas occupational segregation explains 75 percent. Among blue-collar workers, however, the two kinds of segregation have similar explanatory power. Establishment segregation accounts for 67.6 percent of the gap; the residual pay gap unexplained by establishment segregation is about 4 percent. In comparison, occupational segregation accounts for 73.6 percent of the gap, leaving a residual gap of about 3 percent.
Third, institutional changes in Sweden aimed at improving the status of working women had little discernible effect on the wage gap. Little change in the gap occurred following the
passage of the equal pay act in 1979. This conclusion applies to all of our categories: overall, industry, occupation, establishment, and occupation-establishment. Instead, the major changes in these gaps occurred before 1975 for white-collar workers and before 1978 for blue-collar workers.
The declines in the gender wage gap in Sweden occurred almost a decade before passage of additional family legislation advantageous to female careers. Earlier events that may have been significant for reducing the gap were the initiatives by the labor unions and the
employers' associations to attack gender inequality. These started in 1960 for blue-collar workers and were strengthened and applied to white-collar workers (Svensson 1995, pp. 127-28) beginning in 1974. By voluntary agreement between the parties on the labor market “the same pay for the same job” was reintroduced after some 20 years during which there were explicit rules that had paid men more than women for the same work.
Our fourth finding concerns the change in the gap that occurred in the second half of the 1980s, after the system of solidaristic wage bargaining dissolved starting in 1983. Among blue-collar workers, the overall gap increased by about 2.1 percentage points from 1985 to 1990. About 80 percent of this change is explained by increased occupation-establishment segregation. Among white collar workers, the corresponding figures are that the gap increased by about 0.8 percent, about 40 percent of which is explained by increased segregation.
In all three countries, Norway, U.S. and Sweden, segregation by occupations gives a better account of the gender wage gap than does segregation by establishments. However, both explain more of the gap in Sweden and in Norway than in the U.S. countries.17
The similarities in the within-occupation gender gap between Norway and Sweden on the one hand and the U.S., on the other are somewhat surprising. One would expect that greater flexibility of pay in the U.S. would lead to larger wage gaps, but that is not what we found. The small difference in magnitude of the U.S. wage gap at the occupation-establishment level may
reflect several factors. One may be the difference in occupational classifications used in these countries. The Swedish and the Norwegian classifications may be based on broader categories, which in turn will translate into a larger gap. But the Swedish and Norwegian data also comprise a larger spectrum of occupations than the U.S. data, where the gap may be wider in more managerial, administrative, and professional occupations. These issues are not easy to settle because detailed occupational classifications are difficult to compare across countries.
Another possibility may be that an Equal Pay Act has been in operation for a longer time in the U.S. than Sweden and Norway, so there has been more time to deal with this type of inequality. A third reason may be differences in the legal systems and legal cultures in the countries. The U.S. is considerably more litigious, putting employers at higher risk of being sued and hence possibly more on guard. But perhaps more important, in Sweden and Norway, equal pay cases typically must have to be initiated by individuals (Stabel 1991), whereas in the U.S. some proportion of cases are brought to the courts as class-action suits, often covering large groups of employees (see Rhoads 1993). And even though few class-action suits were filed, down from 1.106 in 1975 to 51 in 1989 (Donohue and Spiegelman 1991 p. 1019), they may still cover a large number of people and act as a deterrent to wage discrimination. In a legal climate where the costs of
litigation and of subsequent conviction are high for employers, the deterrents to discrimination are stronger. Between 1980 and 1991, Sweden had only one equal pay case concerning
within-occupation-establishment wage discrimination tried in the Work Court (see SOU 1993, p. 49). The fact that occupation explains more of the wage gap in Sweden and in Norway than in the U.S. is perhaps surprising given the greater amount of inter-occupational wage inequality in the U.S. But there are at least two countervailing effects. One is that the amount of occupational sex segregation is lower in the U.S. (see, e.g., Blau and Kahn 1996). In the U.S., women gained on men in the 1980s even though the amount of wage inequality increased in the
period (Blau and Kahn 1997). This occurred because women improved their position relative to men in the occupational wage hierarchy, gaining access to highly paid jobs in the professions and elsewhere. The lower degree of occupational sex segregation in the U.S. diminishes the role of occupation in explaining the gender wage gap. Another countervailing effect is that wage inequality within occupations likely is higher in the U.S., which lessens the effect of inter-occupational
inequality.
Our finding that the wage gender gap does not reflect unequal pay for equal work suggests that it may be an indicator of even more serious allocative distortions. As Blau and
Ehrenberg argue, “social welfare is maximized if we obtain the greatest possible productivity out of all our resources, including our human resources” (Blau and Ehrenberg 1997 p. 3). If discrimination does not reflect unequal pay for equal work, then it may reflect unequal use of equally qualified human resources, potentially at great cost to the economy. Alternatively, if, as Loury (1998) says, the gap originates on the supply side (such as skill differences between men and women), then the efficiency gains from closing the gap may be substantial. That suggests the value of research aimed at understanding better the differences in men’s and women’s work opportunities and, in particular, their opportunities for combining family and career (see Goldin 1997).
References
Blau, F. D., (1998), Trends in the Well-Being of American Women 1970-1995. Journal of
Economic Literature Vol. 36, (March), 112-165.
Blau, F. D., and R. G. Ehrenberg (Eds.). (1997), Gender and Family Issues in the Workplace.
Russell Sage Foundation, New York
Blau, F. D., and L. Kahn.(1996),Wage Structure and Gender Earnings Differentials: An International Comparison. Economica 63(Supplement), S29-S62.
Blau, F. D., and L. Kahn. (1997), Swimming Upstream: Trends in the Gender Wage Differentials in the 1980s. Journal of Labor Economics15(1), 1-42.
Darity, W. A. Jr., and P. L. Mason. (1998), Evidence on Discrimination in Employment: Codes of Color. Codes of Gender. Journal of Economic Perspectives12(2) (Spring), 63-90.
Donohue, J. J. III., and P. Spiegelman. (1991), The Changing Nature of Employment Discrimination Litigation. Stanford Law Review43(5), 983-1033.
Edin, P-A. and K. Richardsson (1999), Swimming With the Tide: solidarity wage policy and the gender earnings gap. Forthcoming in Scandinavian Journal of Economics.
Eatwell, J., M. Milgate, and P. Newman. (1989), Social Economics, The New PALGRAVE. W W Norton, New York.
Fritzell, J. (1991), Icke av marknaden allena: Inkomstfördelningen i Sverige. Stockholm. Almqvist Wiksell International, Sweden.
Goldin, C. (1997), Career and Family:College Women Look to the Past. Pp 20 – 58 in F. D. Blau and R. G. Eherenberg (Eds.), Gender &Family Issues in the Workplace. Russell Sage Foundation, New York.
Kamerman, S. B. (1991a), Parental Leave and Infant Care: U.S. and International Trends and Issues. 1978-1988. Pp. 11-23 in Parental Leave and Child Care: Setting a Research and Policy. J. S. Hyde and M. J. (Eds.). Templ University Press, Essex. Philadelphia. PA.
----.(1991b), Child Care Policies and Programs: An International Overview. Journal of Social Issues47(2), 179-196.
----. (1988), Maternity and Parenting Benefits: An International Overview. Pp 235—244 in the The
Parental Leave Crisis: Toward a National Policy. E. F. Ziegler and M. Frank (Eds.). Yale University Press, New Haven. CT.
Loury, G. C. (1998), Discrimination in the Post-Civil Rights Era: Beyond Market Interactions. Journal of Economic Perspectives 2(2) (Spring), 63-90.
Meyersson E. M. and T. Petersen. (1997), Lika Lön för lika arbete. En studie av svenska förhållanden i internationell belysning. Pp 104-125 in Kvinnors och mäns löner – varför så olika? I. Persson & E. Wadensjö (Eds.) SOU 1997:136 Rapport till Utredningen om fördelningen av ekonomisk makt och ekonomiska resurser mellan kvinnor och män. Stockholm.
Meyersson-Milgrom, E. M. and T. Petersen. (2000), Is There a Glass Ceiling for Women in Sweden, 1970-1990.mimeo.
NOU, (1997), Stillingsvurdering for aa oppnaa likelønn. Norges Offentlige Utredninger 1997:10. Statens Trykning, Oslo.
Petersen, T., and E. M. Meyersson. (1999), More Glory and Less Injustice: The Glass Ceiling in Sweden, 1970-1990. Pp. 199-261 in The Future of Affirmative Action (Ed) K. T. Leicht. Research in Social Stratification and Mobility Vol 17.
Petersen, T. and V. Snartland, E. M. Meyersson-Milgrom. (2000), Are Female Workers Less
Productive Than Male Workers? Productivity and the Gender Wage Gap, IUI working paper.
Petersen, T., and L. Morgan. (1995), Separate and Unequal: Occupation-Establishment Sex Segregation and the Gender Wage Gap. American Journal of Sociology 101(2), 329-365.
Petersen, T., V. Snartland, L-E. Becken, and K. Modesta Olsen. (1997), Within-Job Wage Discrimination and the Gender Wage Gap.The Case of Norway. European
Sociological Review 13(2), (September), 199-213.
Reskin, B. F., and H. I. Hartmann (Eds.). (1986), Women's Work. Men's Work: Sex Segregation on
the Job. National Academy Press, Washington. D.C.
Rhoads, S.E. (1993), Incomparable Worth. Pay Equity Meets the Market. Cambridge. Cambridge University Press, New York.
Rønsen, M., and M. Sundström. (1996), Maternal Employment in Scandinavia.
A Comparison of the After-Birth Employment Activity of Norwegian and Swedish Women. Journal of Population Economics 9(3), 267-85.
SOU, 1998:6, Ty Makten är din… Myten om det rationella arbetslivet och det jämställda Sverige. Sveriges Offentliga Utredningar, Stockholm.
SOU, 1993:7, Löneskillnader och lönediskriminering. Om kvinnor och män på arbetsmarknaden. Sveriges Offentliga Utredningar, Stockholm.
Spilerman, S. (1986), Organizational Rules and the Features of Work Careers. Research in Social Stratification and Mobility 5, 41-102. JAI Press, Greenwich. CT. Stabel, I. (1991), Lik lønn før arbeid av lik verdi---særlig om haandheving i forhold til
Svensson, L. (1997), En historia om löneutjämning – kvinnors och mäns löner i långsiktigt perspektiv. Pp 14-44 in SOU 1997:136 in Lika lön för lika arbete- En studie av svenska förhållanden i internationell belysning. Pp. 104-125 in Kvinnors och mäns löner – varför så olika? I. Persson and E. Wadensjö, (Eds.). Fritzes, Stockholm. ----.(1995), Closing the Gender Gap. Determinants of Change in the Female - to - Male Blue-Collar
Wage Rates in Swedish Manufacturing 1913-1990. Ekonomiska Historiska
FöreningenVol. 121, Lund, Sweden
U.S. Department of Labor Statistics. 1982, Labor Force Statistics Derived From the Current Population Survey: A Databook. Vol. 1, September. BLS, Bulletin 2096. GPO, Washington D.C.
TABLE 1. Description of data for blue, and white-collar workers in Sweden. 1970 – 1990 Number of employed Number of women Number of men Percent women Number of occupations Number of establishments Number of occupations- establishment pairs Number of industries Total average wage Average wage women Average wage men Year 1 2 3 4 5 6 7 8 9 10 11 Blue-collar workers 1990 643 349 188 540 445 809 29.7 1 849 23 544 87 640 23 64.10 58.99 67.69 1985 626 601 179 235 447 366 28.6 2 070 24 165 89 334 22 44.60 41.08 46.01 1980 676 323 185 648 490 675 27.4 2 482 24 916 95 917 22 29.15 26.70 30.07 1978 646 466 167 589 478 857 25.9 1 926 23 939 94 401 20 26.05 23.79 26.83 1975 644 540 171 183 473 357 26.6 1 832 19 290 86 227 18 19.02 17.21 19.68 1970 583 963 139 146 444 817 23.8 1 438 18 049 80 592 19 11.25 9.70 11.74 White-collar workers 1990 391 997 135 581 256 416 34.6 280 22 031 146 940 32 92.71 74.63 102.27 1985 380 513 124 423 256 090 32.7 279 20 669 145 070 32 63.03 50.03 69.35 1980 381 702 117 798 263 904 30.9 281 19 769 148 461 31 44.06 34.56 48.30 1978 367 207 110 460 256 747 30.1 271 18 457 144 309 34 37.19 28.93 40.74 1975 351 459 100 050 251 409 28.4 345 15 894 135 340 36 29.09 21.83 31.98 1970 299 154 73 318 222 472 24.8 256 13 779 108 121 40 17.09 11.46 18.94
Note: In 1990 643 349 blue-collar workers worked at 1 849 different occupations at 23 544 different
establishments within the SAF domain. (Each union has its own classification of occupations.) 18 In this table wages are reported as pay per hour and in Swedish Kronor SEK.
TABLE 2. Average Sample Range (as Percentage) of Hourly Wages Within Occupation and Occupation-Establishment for All and for Integrated Units
Sample range ( Percent) Number of units(N)
Occupation Occupation-establishment Occupation Occupation-establishment All Integ. All Integ. All Integ. All Integ.
Year 1 2 3 4 5 6 7 8
Panel A Blue-collar workers
1990 93.96 110.06 19.94 28.10 1 728 1 202 54 933 16 704 1985 70.69 83.67 16.19 23.49 1 911 1 247 54 870 14 554 1980 80.06 110.28 17.37 25.00 2 209 1 182 59 187 14 197 1978 90.44 118.71 17.09 25.89 1 762 990 57 647 12 532 1975 146.22 208.33 27.29 42.95 1 669 936 53 517 11 436 1970 128.48 159.07 29.74 49.46 1 329 745 50 116 8 529 Panel B White-collar workers
1990 296.41 315.85 24.14 34.71 276 251 58 341 16 416 1985 195.81 206.79 21.17 30.65 275 246 56 431 13 628 1980 204.46 222.05 20.15 29.02 276 232 56 831 11 890 1978 211.81 229.09 20.59 29.08 271 225 54 546 10 971 1975 217.24 247.67 24.49 34.58 336 263 50 612 9 907 1970 274.68 316.24 31.82 53.27 256 191 40 747 7 733
Note: The figures represent the average percentage ranges of wages at the occupation and occupation-establishment levels, calculated for occupations and occupation-establishment pairs with two or more employees. Separately for all units and for integrated units. We first computed how many points the highest wage was above the lowest wage in each occupation and each occupation-establishment pair. Thereafter we took the average of this percentage across all occupations and all occupation-establishment pairs.
TABLE 3. Women’s wages relative to men’s for blue-collar workers Women’s wages relative to men (%) Explained by (%) Standard Deviation
Min. Max. Total number of employed Total number of women Total number of men Year 1 2 3 4 5 6 7 8 1990 Tot.wage gap 87.16 643 349 188 540 445 809 Industry 90.10 22.9 4.22 80.95 95.59 22 188 540 442 289 Occupation 96.61 73.6 8.77 55.37 171.80 1 202 188 117 415 201 Establishment 95.84 67.6 12.46 24.27 189.23 9 808 177 323 333 895 Occ.-establish 98.63 89.3 9.72 35.19 224.13 16 704 153 375 220 454 1985
Tot. wage gap 89.28 626 601 179 235 447 366 Industry 90.40 10.5 5.75 71.77 96.47 21 179 235 443 466 Occupation 97.05 72.5 7.42 49.62 138.55 1 247 178 460 407 099 Establishment 95.88 61.6 11.03 34.48 206.56 9 353 165 884 325 987 Occ.-establish 99.07 91.3 8.91 31.05 226.66 14 554 138 063 202 572
1980
Tot. wage gap 88.78 676 323 185 648 490 675 Industry 89.32 4.8 5.59 73.73 95.45 20 185 648 484 193 Occupation 96.01 64.4 8.55 66.53 232.98 1 182 184 355 433 273 Establishment 64.16 48.0 11.47 36.17 380.37 9 257 170 800 350 908 Occ.-establish 98.24 84.3 9.51 31.24 341.50 14 197 136 757 211 518
1978
Tot. wage gap 88.67 646 466 167 589 478 857 Industry 88.45 - 7.75 63.34 95.53 19 167 589 475 750 Occupation 96.23 66.7 8.58 63.74 172.90 990 166 308 415 470 Establishment 93.97 46.8 12.58 28.44 693.29 8 738 154 074 334 167 Occ.-establish 98.05 82.8 9.27 38.55 334.51 12 532 118 961 193 142 1975 Tot. wage.gap 87.45 644 540 171 189 473 357 Indsutry 87.72 2.2 6.60 70.88 94.75 17 171 183 470 229 Occupation 94.44 55.7 11.96 44.63 202.92 936 169 293 428 611 Establishment 90.19 21.8 13.23 17.35 341.85 7 505 159 245 347 673 Occ.-establish 96.76 74.2 12.72 17.27 553.84 11 436 120 344 196 814 1970
Tot. wage gap 82.61 583 963 139 146 444 817 Industry 81.71 - 8.41 61.46 80.70 19 139 146 444 817 Occupation 92.48 56.8 11.16 54.68 149.94 745 137 076 392 644 Establishment 86.57 22.8 15.74 14.53 243.38 6 044 127 044 293 349 Occ.-establish 94.91 70.7 14.96 38.24 268.15 8 529 89 768 150 766
Note: Column 1 shows the average wage for women as a percentage of the average wage for men for the different levels: overall industry occupation, establishment, and occupation-establishment. Column 2 shows the percentage of the total wage gap explained by industry, occupation, establishment, and occupation-establishment pair. Column 3-5 give standard deviation, and min- and max-values for the data used in computing column 1. Column 6 gives the total number of employed in the data set for each year. Column 7 shows the number of women and column 8 the number of men in the computations of the table.
TABLE 4. Women’s wages relative to men’s for white-collar workers
Women’s wages relative to men (%)
Explained by
(percent) Standard Deviance Min. Max. number Total number of Total
women Total number of Men Year 1 2 3 4 5 6 7 8 1990
Tot. Wage gap 72.97 391 997 135 574 256 398
Industry 72.97 - 3.91 63.29 85.04 32 135 574 256 398
Occupation 93.24 75.0 8.00 46.12 147.30 251 135 567 254 361
Establishment 75.43 9.1 15.11 27.45 258.60 15 002 130 274 246 355
Occ.-establish. 95.00 81.5 13.93 21.86 256.40 16 416 52 157 92 606
1985
Tot. Wage gap 72.14 380 513 124 422 256 090
Industry 73.55 5.1 3.57 66.99 81.33 32 124 422 256 090
Occupation 93.91 78.1 7.78 61.16 134.60 246 124 375 252 956
Establishment 75.70 12.8 13.76 24.43 180.10 13 767 119 888 244 856
Occ.-establish. 95.49 83.8 13.03 14.15 219.90 13 628 41 384 77 172
1980
Tot. Wage gap 71.56 381 702 117 783 263 894
Industry 73.41 6.5 4.45 65.11 84.43 31 117 783 263 894
Occupation 93.10 75.7 8.19 25.91 117.30 232 117 774 257 335
Establishment 75.58 14.1 13.04 28.63 221.00 13 319 114 234 252 338
Occ.-establish. 95.51 84.2 12.59 28.63 216.10 11 887 35 744 66 594
1978
Tot. Wage gap 71.01 367 207 110 741 257 492
Inudstry 72.73 5.9 3.87 65.30 83.91 34 110 741 257 492
Occupation 92.64 74.6 7.53 52.79 121.10 225 110 741 247 167
Establishment 74.57 12.3 13.02 24.80 250.00 12 263 107 654 244 926
Occ.-establish. 95.97 86.1 13.06 26.70 234.80 10 970 33 431 59 271
1975
Tot. Wage gap 68.26 351 459 101 184 255 304
Industry 70.57 7.3 4.43 53.89 77.20 36 101 184 255 304
Occupation 92.07 75.0 9.22 41.19 131.60 263 101 125 247 031
Establishment 71.96 11.7 13.64 21.04 263.80 10 901 98 317 242 336
Occ.-establish 94.61 83.0 14.82 32.36 246.40 9 896 30 262 55 593
1970
Tot. Wage gap 60.94 299 154 72 217 222 103
Industry 62.92 5.1 3.98 53.52 74.35 40 72 217 222 103
Occupation 89.35 72.7 11.15 50.58 140.20 191 72 217 206 587
Establishment 62.56 4.1 15.41 15.89 212.10 8 605 70 765 209 628
Occ.-establish. 89.85 74.0 18.60 37.06 272.20 7 646 28 230 41 866
Appendix
We give the equations used for computing the decompositions in column 1 of Tables 3 and 4. The average wages for women, for men, the relative wages, and the number of sex-integrated units [only in (2)-(5)] are given by:
(1) in a sector, wf , wm, and wr r, =w wf / m;
(2) in industry b: wb f, , wb m, , wb r, =wb f, /wb m, , and Nb I( )
(3) in occupation o: wo f, , wo m, , wo r, =wo f, /wo m, , and No I( )
(4) in establishment e: we f, , we m, , we r, =we f, /we m, , and Ne I( )
(5) in occupation-establishment unit oe: woe f, , woe m, , woe r, =woe f, /woe m, , and Noe I( ). The raw relative wages between men and women is given as the ratio of average women’s to average men’s wages (multiplied by 100):
( , ) 100 f r r m w w w = × (1)
The relative wages controlling for industry, obtains as
( ) ( ) , ( , ) , 1 1 ( ) ( ) , 1 1 100 100 b I b I N N b f b r b r b b b I b I b m w w w N = N = w =
∑
× =∑
× (2)The relative wages controlling for occupation, obtains as
( ) ( ) , ( , ) , 1 1 ( ) ( ) , 1 1 100 100 o I o I N N o f o r o r o o o I o I o m w w w N = N = w =
∑
× =∑
× (3)The relative wages controlling for establishment, obtains as
( ) ( ) , ( , ) , 1 1 ( ) ( ) , 1 1 100 100 e I e I N N e f e r e r e e e I e I e m w w w N = N = w =
∑
× =∑
× (4)The relative wages controlling for occupation-establishment, obtains as
( ) ( ) , ( , ) , 1 1 ( ) ( ) , 1 1 100 100 oe I oe I N N oe f oe r oe r oe oe oe I oe I oe m w w w N = N = w =
∑
× =∑
× (5)The percentage of the raw wage gap—that is, 100 minus w(r,r), where w(r,r) comes from
( , ) ( , ) ( , ) ( , ) % 100 100 oe r r r e r r r w w w w − = × − (6)
The percentage due to industry, occupation, or establishment alone, obtains by replacing
w(oe,r) in (6) with w(b,r),w(o,r)or w(e,r).
One interpretation that can be given to the measures in (3)-(5) is this. In the case of occupation, with similar interpretations for establishment and occupation-establishment, equation (3) gives the overall wage gap one would observe if (a) men and women were equally distributed on occupations and (b) the wage gap within each occupation is the same across all occupations, equal to the average gap across occupations, so that wo,e equals
w(o,r) from (3).
The assumption made in (b) above, that the wage gap within each occupation is the same across all occupations, equal to the average gap across occupations, namely w(o,r) from (3),
amounts to the relationship , ( , ) , 100 o f o r o m w w w × = (7)
If instead one wants to estimate the overall wage gap with an equal distribution of men and women on occupations, but where the gap within an occupation varies across occupations, one would have to proceed as follows. Let πo, m be the proportion of the men who are in occupation o. With women having the same distribution on occupations as men, we get that overall wage gap, which we can call *
( , )r r w , would be ( ) ( ) , , * 1 ( , ) , , 1 100 o I o I N o m o f o r r N o m o m o w w w π π = = ⋅ = × ⋅
∑
∑
(9)Under the assumption in (7), inserting the right-hand side of (7) into (8) yields that * ( , )r r
w
then equals w( , )o r . In (8), one could use other distributions on occupations such as the male distribution, for example, the marginal distributions of on occupations.
1This paper is the first of a number by the authors addressing the gender wage gap in
Sweden 1970-1990. Furthermore, two papers reports variations on the theme: the
occupation segregation, in Sweden 1970-1990, and in particular whether men and women with the same education, work hours and age reach the same job rank (see Meyersson-Milgrom and Petersen 2000 and Petersen and Meyersson 1999). Finally, one paper focuses on productivity differences between women and men (Petersen, Snartland and Meyersson-Milgrom 2000).
2 The present study focus on jobs with the same titles and for practical purposes we will
label these jobs occupations. Occupation is often the term used in comparable articles and therefore makes the term occupation more reader friendly. Our use of the term defines occupation more narrow than is usual. A job is customarily defined as “a particular task within a particular work group in a particular company or establishment performed by one or more individuals'' (Reskin and Hartmann 1986, p. 9), whereas an occupation is an aggregation of jobs.
3 We follow the convention that discrimination occurs when men and women with equal
qualifications and productivity are treated unequally. This is not to say that the attainment of productive attributes, for example education, is itself not related to discrimination. (See Darity and Mason 1998, Loury 1998.)
4In Sweden separate wage lists for men and women were introduced in the beginning of
occurred in Norway, with an agreement entered in 1961 and implementation between 1963 and 1967 (see NOU 1997, p. 78).
5 There are many theoretical explanations for discrimination in the economic and
sociological literature. (For an overview of some of the literature see Eatwell, Milgate and Newman 1989.)
6 The law was expanded in 1991 and 1994, but those years are not covered in our
quantitative data analysis below.
7Blau and Kahn (1996) reported a lower overall gender wage gap in Sweden than in ten
other Western countries.
8Blau and Kahn (1997) demonstrated some of this quite strikingly.
9 Sweden saw several changes in parental-leave policies and child-care provisions over the
period 1970-1990 (see Rønsen and Sundström 1996).
10 The Family and Medical Leave Act (FMLA) requires medium and large employers to
provide 12 weeks of unpaid parental leave. Of course, many employers provided such benefits voluntarily and some states had such provisions, but nothing universal occurred before 1993, unlike most other industrialized countries.
11 Petersen and Morgan (1995) analyzed the gender wage gap at the
establishment-occupation level. The data were collected by the U.S. Bureau of Labor Statistics (1982) and cover 1.5 million employed during the period 1974 -1983. Petersen et al. (1997) analyzed the gender wage gap at the establishment occupation level in Norway. Their data contain all establishments in the most important business sectors and about 40 percent of all employed in the private sector. The panel data were collected for the years 1984 and
1990 by Norwegian Employer Federation (NAF) and were provided by the Norwegian Bureau of Statistics.
12Education and age/experience are standard variables included in analysis of gender wage
differentials. This would be the proper procedure if we were studying the question of whether men and women investing in the same type of human capital are assigned to the same jobs or earn the same wages. However, the principal question posed in this paper is different: do employers in general give equal pay to men and women working in the same job categories.
13 The white-collar workers’ code system for occupations, the so-called BNT-code, was
developed first in 1955 and has been revised several times since (SOU 1993, p. 204). Its main purpose was to aid in the collection of wage statistics, not for setting wages for jobs and individuals. It is not unlike the salary grade level structure in use in many large U.S. organization (e.g., Spilerman 1986), where a salary grade level indicates such things as the level of responsibility and qualifications associated with the position, but without a strong tie between the grade level and the actual salary itself, though a clear correlation exists.
14 It is often reported that men usually work more overtime hours than women (see, e.g.,
U.S. Department of Labor 1982, Table C-33), either because they prefer for more overtime or because they have better access to overtime hours, and overtime hours are usually paid at a higher rate. The present data do not conflate pay at regular and overtime hours, focusing only on wages during regular hours.
15 We have tried several alternative decomposition weights that could have been used, a
number of which we have computed with only negligible changes in the qualitative pattern of our results.
16 The relative roles of occupations and establishments for the wage gap in the three
countries are not entirely straightforward because one needs a concept of importance. Ours is as follows: We want to assess the impact on the wage gap of a redistribution of
employees on occupations and establishments These computations hold under two conditions. In the case of occupation, but with similar conditions in the case of establishment, we assume that (a) men and women get to be equally distributed on occupations and (b) the wage gap within each occupation is the same across all
occupations, equal to the average wage gap across occupations. For how to compute the overall wage gap after a redistribution of men and women on occupations but allowing for a wage gap that varies by occupation, see equation (8) in Appendix.
17 Blau and Kahn (1997) found similar results comparing the degree of occupation
segregation in Sweden and in the U.S.
18 There are 16,704 sex-integrated occupation-establishment units (Table 1 column 6),
employing 153,375 women and 220,454 men (columns 7-8), a total of 373,829 workers. From line 1 column 6 we see further that there were 643,349 blue-workers in 1990. Hence, a total of 269,520 (643,349-373,829) or 42 percent of the workers are excluded from the computation of the wage gap at the occupation-establishment level because they worked in units that were entirely segregated by sex.