ScienceDirect
Available online at www.sciencedirect.com
Procedia Computer Science 130 (2018) 294–301
1877-0509 © 2018 The Authors. Published by Elsevier B.V. Peer-review under responsibility of the Conference Program Chairs. 10.1016/j.procs.2018.04.042
10.1016/j.procs.2018.04.042
© 2018 The Authors. Published by Elsevier B.V.
Peer-review under responsibility of the Conference Program Chairs.
1877-0509 Available online at www.sciencedirect.com
ScienceDirect
Procedia Computer Science 00 (2018) 000–000
www.elsevier.com/locate/procedia
1877-0509 © 2018 The Authors. Published by Elsevier B.V. Peer-review under responsibility of the Conference Program Chairs.
The 9th International Conference on Ambient Systems, Networks and Technologies
(ANT 2018)
AGENT-BASED SIMULATION FRAMEWORK FOR THE TAXI
SECTOR MODELING
Josep Maria Salanova Grau
a*, Miquel Estrada
b, Panagiotis Tzenos
a, Georgia
Aifandopoulou
aaCentre for Research and Technology Hellas/Hellenic Institute of Transport, Thessaloniki, Greece bTechnical University of Catalonia, Barcelona, Spain
Abstract
Taxi services account for a significant part of the daily trips in most cities around the world. These services are regulated by a central authority, which usually monitors the performance of the taxi services provision and defines the policies applied to the taxi sector. In order to support policy makers, fleet managers and individual taxi drivers, there is a need for developing models to understand the behavior of these markets. Most of the models developed for analyzing the taxi market are based on econometric measurements and do not account for the spatial distribution of both taxi demand and supply. Only few simulation models are able to better understand the operational characteristics of the taxi market. This paper presents a framework for the development of agent based taxi simulation models. It is aimed at assessing policy makers, taxi fleet managers and individual drivers in the definition of the optimum operation mode and the number of vehicles.
© 2018 The Authors. Published by Elsevier B.V.
Peer-review under responsibility of the Conference Program Chairs.
Keywords: taxi modeling, agent-based modeling, modeling framework 1.Introduction
Taxi services are present in most of cities around the world, accounting for a significant part of the daily trips. There are three basic organizational and operational modes: stand, hailing and dispatching. In the stand mode taxis
* Corresponding author. Tel.: +302310498433; fax: +302310498269. E-mail address: [email protected]
Available online at www.sciencedirect.com
ScienceDirect
Procedia Computer Science 00 (2018) 000–000
www.elsevier.com/locate/procedia
1877-0509 © 2018 The Authors. Published by Elsevier B.V. Peer-review under responsibility of the Conference Program Chairs.
The 9th International Conference on Ambient Systems, Networks and Technologies
(ANT 2018)
AGENT-BASED SIMULATION FRAMEWORK FOR THE TAXI
SECTOR MODELING
Josep Maria Salanova Grau
a*, Miquel Estrada
b, Panagiotis Tzenos
a, Georgia
Aifandopoulou
aaCentre for Research and Technology Hellas/Hellenic Institute of Transport, Thessaloniki, Greece bTechnical University of Catalonia, Barcelona, Spain
Abstract
Taxi services account for a significant part of the daily trips in most cities around the world. These services are regulated by a central authority, which usually monitors the performance of the taxi services provision and defines the policies applied to the taxi sector. In order to support policy makers, fleet managers and individual taxi drivers, there is a need for developing models to understand the behavior of these markets. Most of the models developed for analyzing the taxi market are based on econometric measurements and do not account for the spatial distribution of both taxi demand and supply. Only few simulation models are able to better understand the operational characteristics of the taxi market. This paper presents a framework for the development of agent based taxi simulation models. It is aimed at assessing policy makers, taxi fleet managers and individual drivers in the definition of the optimum operation mode and the number of vehicles.
© 2018 The Authors. Published by Elsevier B.V.
Peer-review under responsibility of the Conference Program Chairs.
Keywords: taxi modeling, agent-based modeling, modeling framework 1.Introduction
Taxi services are present in most of cities around the world, accounting for a significant part of the daily trips. There are three basic organizational and operational modes: stand, hailing and dispatching. In the stand mode taxis
* Corresponding author. Tel.: +302310498433; fax: +302310498269. E-mail address: [email protected]
2 Salanova Grau, Estrada, Aifandopoulou, Tzenos / Procedia Computer Science 00 (2018) 000–000
and users meet at predetermined locations, called taxi stands or ranks, where a first-in-first-out (FIFO) system
applies for both the users’ and the drivers’ queue. In the hailing mode, taxis circulate looking for a user, and users wait for the first vacant taxi. Finally, in the dispatching market, taxi services are coordinated by dispatching centers,
which are responsible for matching available taxi services with the demand of users’ trips. Taxi markets are usually
composed by the three operation modes, but when the demand for taxi services is small, the stand and dispatching modes are the most usual ones. On the other hand, the hailing model is usually found in cities with high population densities where a Business District zone concentrates a high percentage of the daily trips.
The taxi market is quite important in cities, where the mobility share ranges between 1% and 15%. This market was strongly regulated during the last century, but during the last decade this sector has been significantly changed by technological advances, not only with regard to the technology itself, but also having an impact to operational and
organizational issues. At the end of the 20th century most taxi drivers were affiliated to dispatching centers aiming at
receiving rides from customers’ calls. These centers have become the main communication channel between the drivers and the customers. The knowledge about the network and the demand habits gathered by these centers are resulting crucial in order to be in the right place at the right time. Today, thanks to the penetration of mobile phones and smart devices, the communication between drivers and customers can be direct, without the need of the dispatching centers. Information value has also increased significantly during the last years, especially due to the rapid growth in communication and geolocation technologies, having a large impact in many fields, especially in the mobility domain. Value of information depends of many characteristics, such as accuracy or velocity, and it can be increased by processing the raw data and enriching it.
It is obvious that there is a business opportunity for the provision of prediction services to taxi drivers. At the same time there is a need for developing models for supporting decision makers and understanding the behavior of these markets to policy regulations or to deregulation. Most of the models developed to analyze the taxi market are based on econometric measurements and do not consider the spatial distribution of both demand and supply for taxi services. Only few instances of the simulation models developed are able to understand better the operational characteristics of the taxi market. This paper aims at providing a framework and guidelines for building agent-based simulation models for the taxi sector.
2.Literature review
1 was the first contribution that used the word agent-based model for designing computational models able to
simulate actions and interactions of autonomous entities. 2 examined the link between the agent-based modeling and
the current transportation problems and presented the definitions of agent and agent-based modeling as well as their attributes and structure. His work concluded with a study presenting various applications of agent-based models to
the traditional transportation sector. 3 and 4 continued the work started by 2 and extended the review of the use of
agent-based modeling approaches in the transportation field. Various agent-based models have been developed afterwards, but only few of them have been aimed at modelling taxi services. The main contribution of the latter is the possibility to obtain more detailed results about the optimum number of vehicles and the operation mode while analyzing the behavior of the taxi drivers and users with regard to the impact of the provision of information.
5 developed agent-based models for investigating the relation between the number of taxis and the performance in
the dispatching market, concluding that the waiting time is relatively insensitive to changes in demand but highly
sensitive to changes in the number of taxi cabs. 6 developed a discrete event method able to simulate dispatching taxi
services. A linear relation between total distance and fleet size was shown. 7 developed a simulation based stand taxi
services and proved that the use of information technologies could improve the quality of the service by 20%. 8 and 9
presented dynamic taxi stand demand models, highlighting the limitations of traditional aggregated models such as time-dependent patterns, imperfect information, convergence and the lack of economic equilibrium in taxi market due to regulation. The authors also tested the effects of Advanced Transport Information Systems (ATIS) in this
specific market. 10 presented a dispatching architecture for the increase of the customers’ satisfaction by concurrently
dispatching multiple taxis to the same number of customers in the same geographical region. 11 developed a
discrete-event simulation model for answering the “what-if” questions of the taxi market, supporting that the mathematical models are out of reach for such a complex stochastic multi-agent systems composed of taxis, users and the network.
Josep Maria Salanova Grau et al. / Procedia Computer Science 130 (2018) 294–301 295
ScienceDirect
Procedia Computer Science 00 (2018) 000–000
www.elsevier.com/locate/procedia
1877-0509 © 2018 The Authors. Published by Elsevier B.V. Peer-review under responsibility of the Conference Program Chairs.
The 9th International Conference on Ambient Systems, Networks and Technologies
(ANT 2018)
AGENT-BASED SIMULATION FRAMEWORK FOR THE TAXI
SECTOR MODELING
Josep Maria Salanova Grau
a*, Miquel Estrada
b, Panagiotis Tzenos
a, Georgia
Aifandopoulou
aaCentre for Research and Technology Hellas/Hellenic Institute of Transport, Thessaloniki, Greece bTechnical University of Catalonia, Barcelona, Spain
Abstract
Taxi services account for a significant part of the daily trips in most cities around the world. These services are regulated by a central authority, which usually monitors the performance of the taxi services provision and defines the policies applied to the taxi sector. In order to support policy makers, fleet managers and individual taxi drivers, there is a need for developing models to understand the behavior of these markets. Most of the models developed for analyzing the taxi market are based on econometric measurements and do not account for the spatial distribution of both taxi demand and supply. Only few simulation models are able to better understand the operational characteristics of the taxi market. This paper presents a framework for the development of agent based taxi simulation models. It is aimed at assessing policy makers, taxi fleet managers and individual drivers in the definition of the optimum operation mode and the number of vehicles.
© 2018 The Authors. Published by Elsevier B.V.
Peer-review under responsibility of the Conference Program Chairs.
Keywords: taxi modeling, agent-based modeling, modeling framework 1.Introduction
Taxi services are present in most of cities around the world, accounting for a significant part of the daily trips. There are three basic organizational and operational modes: stand, hailing and dispatching. In the stand mode taxis
* Corresponding author. Tel.: +302310498433; fax: +302310498269. E-mail address: [email protected]
Available online at www.sciencedirect.com
ScienceDirect
Procedia Computer Science 00 (2018) 000–000
www.elsevier.com/locate/procedia
1877-0509 © 2018 The Authors. Published by Elsevier B.V. Peer-review under responsibility of the Conference Program Chairs.
The 9th International Conference on Ambient Systems, Networks and Technologies
(ANT 2018)
AGENT-BASED SIMULATION FRAMEWORK FOR THE TAXI
SECTOR MODELING
Josep Maria Salanova Grau
a*, Miquel Estrada
b, Panagiotis Tzenos
a, Georgia
Aifandopoulou
aaCentre for Research and Technology Hellas/Hellenic Institute of Transport, Thessaloniki, Greece bTechnical University of Catalonia, Barcelona, Spain
Abstract
Taxi services account for a significant part of the daily trips in most cities around the world. These services are regulated by a central authority, which usually monitors the performance of the taxi services provision and defines the policies applied to the taxi sector. In order to support policy makers, fleet managers and individual taxi drivers, there is a need for developing models to understand the behavior of these markets. Most of the models developed for analyzing the taxi market are based on econometric measurements and do not account for the spatial distribution of both taxi demand and supply. Only few simulation models are able to better understand the operational characteristics of the taxi market. This paper presents a framework for the development of agent based taxi simulation models. It is aimed at assessing policy makers, taxi fleet managers and individual drivers in the definition of the optimum operation mode and the number of vehicles.
© 2018 The Authors. Published by Elsevier B.V.
Peer-review under responsibility of the Conference Program Chairs.
Keywords: taxi modeling, agent-based modeling, modeling framework 1.Introduction
Taxi services are present in most of cities around the world, accounting for a significant part of the daily trips. There are three basic organizational and operational modes: stand, hailing and dispatching. In the stand mode taxis
* Corresponding author. Tel.: +302310498433; fax: +302310498269. E-mail address: [email protected]
2 Salanova Grau, Estrada, Aifandopoulou, Tzenos / Procedia Computer Science 00 (2018) 000–000
and users meet at predetermined locations, called taxi stands or ranks, where a first-in-first-out (FIFO) system
applies for both the users’ and the drivers’ queue. In the hailing mode, taxis circulate looking for a user, and users wait for the first vacant taxi. Finally, in the dispatching market, taxi services are coordinated by dispatching centers,
which are responsible for matching available taxi services with the demand of users’ trips. Taxi markets are usually
composed by the three operation modes, but when the demand for taxi services is small, the stand and dispatching modes are the most usual ones. On the other hand, the hailing model is usually found in cities with high population densities where a Business District zone concentrates a high percentage of the daily trips.
The taxi market is quite important in cities, where the mobility share ranges between 1% and 15%. This market was strongly regulated during the last century, but during the last decade this sector has been significantly changed by technological advances, not only with regard to the technology itself, but also having an impact to operational and
organizational issues. At the end of the 20th century most taxi drivers were affiliated to dispatching centers aiming at
receiving rides from customers’ calls. These centers have become the main communication channel between the drivers and the customers. The knowledge about the network and the demand habits gathered by these centers are resulting crucial in order to be in the right place at the right time. Today, thanks to the penetration of mobile phones and smart devices, the communication between drivers and customers can be direct, without the need of the dispatching centers. Information value has also increased significantly during the last years, especially due to the rapid growth in communication and geolocation technologies, having a large impact in many fields, especially in the mobility domain. Value of information depends of many characteristics, such as accuracy or velocity, and it can be increased by processing the raw data and enriching it.
It is obvious that there is a business opportunity for the provision of prediction services to taxi drivers. At the same time there is a need for developing models for supporting decision makers and understanding the behavior of these markets to policy regulations or to deregulation. Most of the models developed to analyze the taxi market are based on econometric measurements and do not consider the spatial distribution of both demand and supply for taxi services. Only few instances of the simulation models developed are able to understand better the operational characteristics of the taxi market. This paper aims at providing a framework and guidelines for building agent-based simulation models for the taxi sector.
2.Literature review
1 was the first contribution that used the word agent-based model for designing computational models able to
simulate actions and interactions of autonomous entities. 2 examined the link between the agent-based modeling and
the current transportation problems and presented the definitions of agent and agent-based modeling as well as their attributes and structure. His work concluded with a study presenting various applications of agent-based models to
the traditional transportation sector. 3 and 4 continued the work started by 2 and extended the review of the use of
agent-based modeling approaches in the transportation field. Various agent-based models have been developed afterwards, but only few of them have been aimed at modelling taxi services. The main contribution of the latter is the possibility to obtain more detailed results about the optimum number of vehicles and the operation mode while analyzing the behavior of the taxi drivers and users with regard to the impact of the provision of information.
5 developed agent-based models for investigating the relation between the number of taxis and the performance in
the dispatching market, concluding that the waiting time is relatively insensitive to changes in demand but highly
sensitive to changes in the number of taxi cabs. 6 developed a discrete event method able to simulate dispatching taxi
services. A linear relation between total distance and fleet size was shown. 7 developed a simulation based stand taxi
services and proved that the use of information technologies could improve the quality of the service by 20%. 8 and 9
presented dynamic taxi stand demand models, highlighting the limitations of traditional aggregated models such as time-dependent patterns, imperfect information, convergence and the lack of economic equilibrium in taxi market due to regulation. The authors also tested the effects of Advanced Transport Information Systems (ATIS) in this
specific market. 10 presented a dispatching architecture for the increase of the customers’ satisfaction by concurrently
dispatching multiple taxis to the same number of customers in the same geographical region. 11 developed a
discrete-event simulation model for answering the “what-if” questions of the taxi market, supporting that the mathematical models are out of reach for such a complex stochastic multi-agent systems composed of taxis, users and the network.
296 Salanova Grau, Estrada, Tzenos, Aifadopoulou, / Procedia Computer Science 00 (2018) 000–000 Josep Maria Salanova Grau et al. / Procedia Computer Science 130 (2018) 294–301 3
drivers and its influence on the performance of the system. 7 developed a time-dependent agent-based taxi simulation
model and tested it with various customer patterns in order to provide policy-related guidelines for improving the
service performance when the demand pattern is asymmetric. 13 proposed a massive multiagent simulation platform
for investigating interactions among taxis and customers, incorporating real-world driver’s behaviors validated in a
real-world case study. 14 developed an agent-based model to assess the performance of various operation modes and
applied to the Sioux Falls network. 15 developed an agent-based model to obtain the optimum number of vehicles
and applied to the city of Barcelona using real-world data. 16 presented a large-scale microscopic simulation of taxi
services built using floating car data of Berlin and Barcelona. This model was utilized to analyze the performance of
various dispatching and fleet management techniques. Finally, 17 studied the impact of the provision of information
to taxi drivers by developing an agent-based model for the city of Thessaloniki in Greece, proving that the informed drivers perform significantly better, especially when they are a minority.
3.Framework for modeling information sharing in the taxi sector 3.1.Data collection and analysis
The first step is to collect and analyze the available data, most of the times generated by the individual taxis and available at the taxi associations. The data may be generated in various formats and contain different information. The most common format is Floating Car Data (FCD), where the locations of the vehicles are logged following a
spatial or temporal interval (Fig 1 right). FCD usually contains UTM coordinates, timestamp, orientation, status
(empty or occupied), stand id (if waiting at a stand) as well as vehicle and driver identities. Regarding the spatial and temporal intervals, the triggers actuating the log of the data can be a pre-defined distance or time, but also an event, such as picking-up or dropping-off a customer.
FIG 1 Space-time diagram of the dispatching market 18 (left). Floating car data sample 19 (right)
Once the data are available, it should be analyzed in order to understand how the market works by estimating various indicators, including city related variables such as number of vehicle-kilometers and vehicle-hours, number of total trips, total costs of the system (drivers costs and users costs); taxi driver related variables such as circulating time and distance (total, occupied and vacant), taxi occupancy and vacant taxi headway as well as earnings and benefits; taxi customers related variables such as waiting time, travel time and cost of trip. All the variables should be mapped to the operation mode (hail, stand and dispatch) both temporally and spatially (Fig 1 left).
These indicators should be generated for large series of days in order to identify the differences between weekdays and weekends as well as to define the characteristics of the typical day that will be used in the simulation. Performance indicators should be also defined, such as number of trips per driver, empty and occupied distance and time per driver as well as average speed. Once all the indicators have been defined and the calculation method
orientation
Time (seconds) Speed (km/h)
4 Salanova Grau, Estrada, Aifandopoulou, Tzenos / Procedia Computer Science 00 (2018) 000–000
defined, a representative distribution should be identified to characterize each of them, which will be the input of the simulation. These distributions should be validated towards the functional characteristics of the network, such as the peak hours.
Exogenous variables, such as the total demand (absolute value, temporal distribution and geographical distribution), supply (number of vehicles, temporal distribution and mode distribution), network geometry and links characteristics and taxi fare policy (fixed fare and distance/time-based charge rates) should be also collected and analyzed for the city in which the model will be developed.
3.2.Scenario set up
In a second phase, the data needed to feed the simulation tool should be collected and preprocessed. Road segments and intersections should be modeled in GIS including their functional characteristics, such as free flow speed, volume-delay functions, length and many others. At this point, various approaches can be followed:
- To model the impacts of the taxis in the network by defining the travel time in each section, based on the
number of taxis. This is the most challenging and resource-consuming approach, since the car traffic may be modeled together with a routing engine.
- To use the network as a background where the drivers circulate without having impact on its characteristics,
meaning that the travel times will be pre-defined. In this approach there is no need for modeling private vehicles traffic, but a routing engine is also needed.
- Network performance, distances and travel times between zones are estimated from the collected data and
are not modelled. This is the simplest approach since there is no need for modeling the private vehicles traffic flows neither developing a routing engine.
Once the network geometry and functionalities have been defined, the operative issues should be addressed, including the type of taxi market operation (hail, stand, dispatch or a combination), the shifts and the rules of the simulation agents. The two main agents to be simulated are the taxi drivers and the taxi customers. Taxi drivers and customers will be provided with decision capabilities based on various levels of information availability aiming at maximizing an objective function. For the taxi drivers, this function may mainly include income or earnings but also
productivity metrics, such as occupied time/distance versus empty time/distance, while the customers’ main metrics
is time. These metrics can be shared by the agents in a system optimum approach, were drivers will be also trying to
minimize customers’ waiting time, or independent from each other, in a more user optimum approach. Even within
the taxi drivers, there can be groups of collaborating agents aimed at maximizing the group revenues in front of the other groups. Customers can also be provided with collaborative capabilities.
Behavior rules of the agents should follow the patterns extracted from the data. For example, the dataset containing the empty trips of the drivers is fundamental for understanding how they behave when looking for a customer, if they just wait at the stands or circulate in specific zones. Information availability is modeled at this stage. Various driver behaviors can be considered, mainly grouped in conservative, empirical and informed, as developed below:
- Conservative drivers stay at the last customer’s destination zone and join the existing queue. This kind of
driver may be a low-experienced one having low (or none) knowledge about the spatial and temporal demand profile.
- Experienced drivers select a zone based on their experience and go there. They balance the distance and
travel time to the new zone versus the ride they expect to find, defined by both waiting time and income.
- Informed drivers may be supported by real-time information about taxi service demand, including future
predictions. They decide to visit other zones based on the current demand (as experienced by the drivers during the last time interval) or on available predictions.
3.3.Agent-based model development
3.3.1.Demand and supply generation
Taxis and customers will be fitted into the network following the distributions identified during the data analysis
drivers and its influence on the performance of the system. 7 developed a time-dependent agent-based taxi simulation
model and tested it with various customer patterns in order to provide policy-related guidelines for improving the
service performance when the demand pattern is asymmetric. 13 proposed a massive multiagent simulation platform
for investigating interactions among taxis and customers, incorporating real-world driver’s behaviors validated in a
real-world case study. 14 developed an agent-based model to assess the performance of various operation modes and
applied to the Sioux Falls network. 15 developed an agent-based model to obtain the optimum number of vehicles
and applied to the city of Barcelona using real-world data. 16 presented a large-scale microscopic simulation of taxi
services built using floating car data of Berlin and Barcelona. This model was utilized to analyze the performance of
various dispatching and fleet management techniques. Finally, 17 studied the impact of the provision of information
to taxi drivers by developing an agent-based model for the city of Thessaloniki in Greece, proving that the informed drivers perform significantly better, especially when they are a minority.
3.Framework for modeling information sharing in the taxi sector 3.1.Data collection and analysis
The first step is to collect and analyze the available data, most of the times generated by the individual taxis and available at the taxi associations. The data may be generated in various formats and contain different information. The most common format is Floating Car Data (FCD), where the locations of the vehicles are logged following a
spatial or temporal interval (Fig 1 right). FCD usually contains UTM coordinates, timestamp, orientation, status
(empty or occupied), stand id (if waiting at a stand) as well as vehicle and driver identities. Regarding the spatial and temporal intervals, the triggers actuating the log of the data can be a pre-defined distance or time, but also an event, such as picking-up or dropping-off a customer.
FIG 1 Space-time diagram of the dispatching market 18 (left). Floating car data sample 19 (right)
Once the data are available, it should be analyzed in order to understand how the market works by estimating various indicators, including city related variables such as number of vehicle-kilometers and vehicle-hours, number of total trips, total costs of the system (drivers costs and users costs); taxi driver related variables such as circulating time and distance (total, occupied and vacant), taxi occupancy and vacant taxi headway as well as earnings and benefits; taxi customers related variables such as waiting time, travel time and cost of trip. All the variables should be mapped to the operation mode (hail, stand and dispatch) both temporally and spatially (Fig 1 left).
These indicators should be generated for large series of days in order to identify the differences between weekdays and weekends as well as to define the characteristics of the typical day that will be used in the simulation. Performance indicators should be also defined, such as number of trips per driver, empty and occupied distance and time per driver as well as average speed. Once all the indicators have been defined and the calculation method
orientation
Time (seconds) Speed (km/h)
defined, a representative distribution should be identified to characterize each of them, which will be the input of the simulation. These distributions should be validated towards the functional characteristics of the network, such as the peak hours.
Exogenous variables, such as the total demand (absolute value, temporal distribution and geographical distribution), supply (number of vehicles, temporal distribution and mode distribution), network geometry and links characteristics and taxi fare policy (fixed fare and distance/time-based charge rates) should be also collected and analyzed for the city in which the model will be developed.
3.2.Scenario set up
In a second phase, the data needed to feed the simulation tool should be collected and preprocessed. Road segments and intersections should be modeled in GIS including their functional characteristics, such as free flow speed, volume-delay functions, length and many others. At this point, various approaches can be followed:
- To model the impacts of the taxis in the network by defining the travel time in each section, based on the
number of taxis. This is the most challenging and resource-consuming approach, since the car traffic may be modeled together with a routing engine.
- To use the network as a background where the drivers circulate without having impact on its characteristics,
meaning that the travel times will be pre-defined. In this approach there is no need for modeling private vehicles traffic, but a routing engine is also needed.
- Network performance, distances and travel times between zones are estimated from the collected data and
are not modelled. This is the simplest approach since there is no need for modeling the private vehicles traffic flows neither developing a routing engine.
Once the network geometry and functionalities have been defined, the operative issues should be addressed, including the type of taxi market operation (hail, stand, dispatch or a combination), the shifts and the rules of the simulation agents. The two main agents to be simulated are the taxi drivers and the taxi customers. Taxi drivers and customers will be provided with decision capabilities based on various levels of information availability aiming at maximizing an objective function. For the taxi drivers, this function may mainly include income or earnings but also
productivity metrics, such as occupied time/distance versus empty time/distance, while the customers’ main metrics
is time. These metrics can be shared by the agents in a system optimum approach, were drivers will be also trying to
minimize customers’ waiting time, or independent from each other, in a more user optimum approach. Even within
the taxi drivers, there can be groups of collaborating agents aimed at maximizing the group revenues in front of the other groups. Customers can also be provided with collaborative capabilities.
Behavior rules of the agents should follow the patterns extracted from the data. For example, the dataset containing the empty trips of the drivers is fundamental for understanding how they behave when looking for a customer, if they just wait at the stands or circulate in specific zones. Information availability is modeled at this stage. Various driver behaviors can be considered, mainly grouped in conservative, empirical and informed, as developed below:
- Conservative drivers stay at the last customer’s destination zone and join the existing queue. This kind of
driver may be a low-experienced one having low (or none) knowledge about the spatial and temporal demand profile.
- Experienced drivers select a zone based on their experience and go there. They balance the distance and
travel time to the new zone versus the ride they expect to find, defined by both waiting time and income.
- Informed drivers may be supported by real-time information about taxi service demand, including future
predictions. They decide to visit other zones based on the current demand (as experienced by the drivers during the last time interval) or on available predictions.
3.3.Agent-based model development
3.3.1.Demand and supply generation
Taxis and customers will be fitted into the network following the distributions identified during the data analysis
298 Salanova Grau, Estrada, Tzenos, Aifadopoulou, / Procedia Computer Science 00 (2018) 000–000 Josep Maria Salanova Grau et al. / Procedia Computer Science 130 (2018) 294–301 5
distributions or deterministically introduced from the observed data. Drivers starting time, location as well as shift duration can be also extracted from the data and modeled. Locations can be specific (x and y coordinates, stand identity) or less detailed (zone). If a network is needed for calculating the routes it should be defined as a directed graph composed of links and nodes. The links should have the following characteristics: Length; Free flow travel time; Volume-delay parameters; Flow of vehicles; Capacity. The demand can be elastic or inelastic and should be characterized by demand density functions. If it is elastic, these functions should contain all variables that alter the demand elasticity.
3.3.2.Flowchart diagram
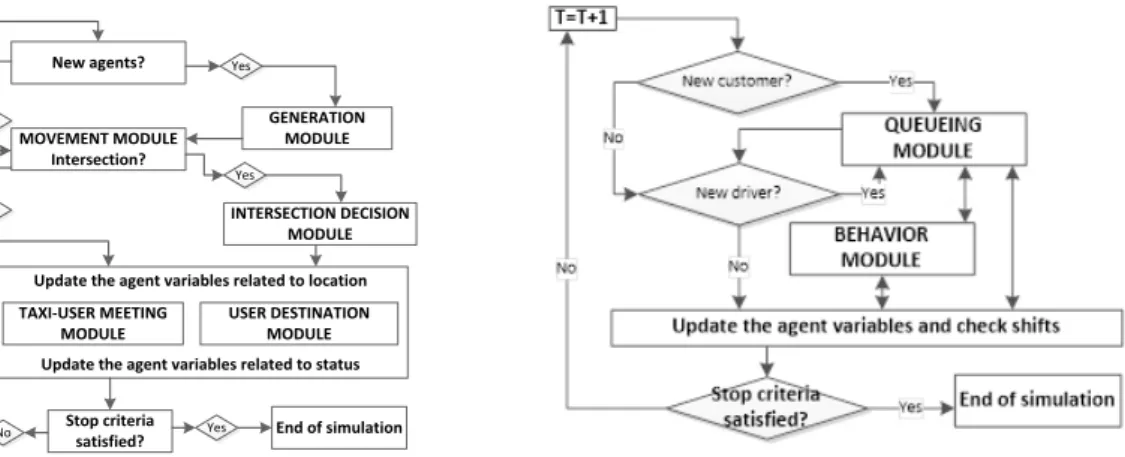
Once all components and modules have been addressed, the flowchart between all processes should be defined, emphasizing on their relations and the temporal dimension in which they are executed sequentially. Depending on the available components and agents, the connections between the modules may differ. Modules can be dedicated to demand and supply generation, vehicle movement and decision making, vehicle routing and navigation, vehicle-user meeting, drop-off, learning/experience enrichment, trip charging module, traffic update module among many others, always depending on the goal of the simulation and the available data. Various flowcharts are provided in Fig 2.
Update the agent variables related to location
Update the agent variables related to status New agents? MOVEMENT MODULE Intersection? INTERSECTION DECISION MODULE USER DESTINATION MODULE Yes No GENERATION MODULE Yes No TAXI-USER MEETING MODULE Stop criteria satisfied? Yes No End of simulation T=T+1
FIG 2. Flow chart diagram of 15 (left) and 17 (right).
3.3.3.Routing and decision making
If a background network is provided, a routing engine is needed to define the path between two locations. Professional drivers take into account other parameters in comparison to normal drivers, and they have a good knowledge of the network (even including real time information provided by other colleagues about bottlenecks). Therefore, route choice models can be used in order to understand how taxi drivers plan their routes. En-route decision making may be also modeled, providing re-routing options when congestion appears. During the empty kilometers, the routing component may be totally different, since the drivers are looking for a customer instead of going to a concrete location.
Speed of taxis within the network can be estimated as equal to the speed of the private vehicles, which it is a function of the geometric and functional characteristics of the road section as well as of the congestion level.
Volume-delay functions can be used, such as the link performance function proposed by 20 and adopted by the
Bureau of Public Roads. If taxis can run along dedicated lanes (bus or HOV lanes), this can be taken into account in the simulation by differentiating the travel time or the speed in the set of links where this infrastructure is available and using free flow speed.
When looking for a customer, the experience of drivers can be modeled by using a roulette rule, where every decision concerning where taxi should drive towards is based on the attractiveness of each road section or a concrete zone. Experience and learning process can be modeled by updating the attractiveness of each zone or road section during the simulation. This can be done also at driver-level, hence each driver will have its own learning experience. An illustration is provided in Fig 3.
6 Salanova Grau, Estrada, Aifandopoulou, Tzenos / Procedia Computer Science 00 (2018) 000–000
is the attractiveness of link
FIG 3. Intersection numeration (left), location of an agent (middle) and roulette for the intersection decision procedure (right) 15
3.4.Simulation run and scenarios assessment
Once the model has been completely defined, the scenario simulation can be run and the outputs of the model collected. Various runs are needed with different random seeds for the creation of the stochastic variables, using the average outputs obtained. However, users should check their distribution in order to eliminate the outliers and obtain average output distributions with small variability. If the variability of the outputs is high, the model should be checked and sensitivity analysis done in order to identify the variables and parameters responsible for this variability. In that case, we should try to better estimate them, or select other periods with less variability. The sensitivity analysis is also useful for identifying the critical variables, parameters, components and modules that
highly affect the model’s sensitiveness, and put more effort in their modeling and/or estimation.
3.4.1.Validation
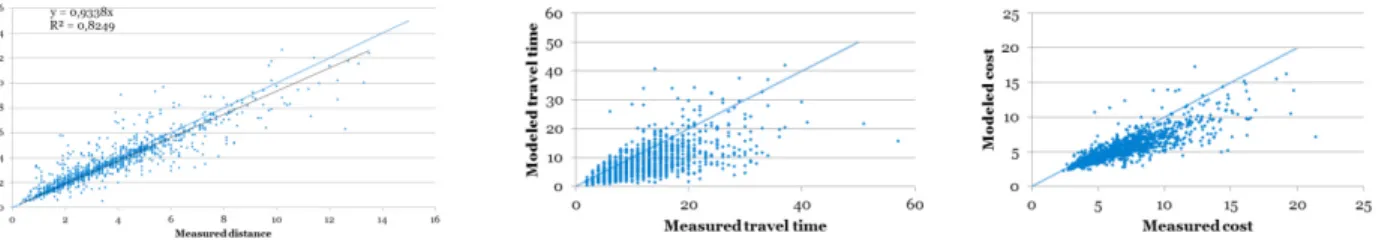
The outputs of the model should be validated towards exogenous variables of the trips, such as travel time, distance or cost as well as towards exogenous variables of the customers, such as waiting time, which may be collected and processed independently of the data used. In the validation process the parameters of the model should be calibrated in order to achieve a good fit with the exogenous measurements, such as the ones related to routing preferences and driving behavior of the drivers or to the charging system. Perfect validation may not be possible due to the assumptions done in the simulation model, such as constant speed during the whole simulation, which will end up to overestimation and underestimation of travel times when the network is more or less congested respectively in comparison to the congestion level used for defining the speed in each road section. Usually validation towards distances provide better fit than towards travel time, since it is less dependent on the congestion level (see Fig 4).
FIG 4. Validation towards distance (left), travel time (centre) and cost (right) 15
Validation can be also done with regard to the amount of vehicles in each state during the simulation. It allows a better tackling of the dynamics of the system as well as daily variations in demand and supply for taxi trips. Lacks in the monitoring data or lack of capabilities of the model for simulating the breaks of the drivers between shifts make this kind of validation more difficult. Finally, validation can be done using exogenous data sources, like statistical data collected and estimated by third parties, such as taxi organizations or public authorities related to the taxi sector. In this case economic variables like incomes or expenses can be used together with more operational ones, such as the working hours and shifts based on regulation.
3.4.2.Results
Once the model has been validated, the indicators defined earlier in the preparation of the model can be calculated from the results generated by the simulation runs. It is important to note that the whole model was built
distributions or deterministically introduced from the observed data. Drivers starting time, location as well as shift duration can be also extracted from the data and modeled. Locations can be specific (x and y coordinates, stand identity) or less detailed (zone). If a network is needed for calculating the routes it should be defined as a directed graph composed of links and nodes. The links should have the following characteristics: Length; Free flow travel time; Volume-delay parameters; Flow of vehicles; Capacity. The demand can be elastic or inelastic and should be characterized by demand density functions. If it is elastic, these functions should contain all variables that alter the demand elasticity.
3.3.2.Flowchart diagram
Once all components and modules have been addressed, the flowchart between all processes should be defined, emphasizing on their relations and the temporal dimension in which they are executed sequentially. Depending on the available components and agents, the connections between the modules may differ. Modules can be dedicated to demand and supply generation, vehicle movement and decision making, vehicle routing and navigation, vehicle-user meeting, drop-off, learning/experience enrichment, trip charging module, traffic update module among many others, always depending on the goal of the simulation and the available data. Various flowcharts are provided in Fig 2.
Update the agent variables related to location
Update the agent variables related to status New agents? MOVEMENT MODULE Intersection? INTERSECTION DECISION MODULE USER DESTINATION MODULE Yes No GENERATION MODULE Yes No TAXI-USER MEETING MODULE Stop criteria satisfied? Yes No End of simulation T=T+1
FIG 2. Flow chart diagram of 15 (left) and 17 (right).
3.3.3.Routing and decision making
If a background network is provided, a routing engine is needed to define the path between two locations. Professional drivers take into account other parameters in comparison to normal drivers, and they have a good knowledge of the network (even including real time information provided by other colleagues about bottlenecks). Therefore, route choice models can be used in order to understand how taxi drivers plan their routes. En-route decision making may be also modeled, providing re-routing options when congestion appears. During the empty kilometers, the routing component may be totally different, since the drivers are looking for a customer instead of going to a concrete location.
Speed of taxis within the network can be estimated as equal to the speed of the private vehicles, which it is a function of the geometric and functional characteristics of the road section as well as of the congestion level.
Volume-delay functions can be used, such as the link performance function proposed by 20 and adopted by the
Bureau of Public Roads. If taxis can run along dedicated lanes (bus or HOV lanes), this can be taken into account in the simulation by differentiating the travel time or the speed in the set of links where this infrastructure is available and using free flow speed.
When looking for a customer, the experience of drivers can be modeled by using a roulette rule, where every decision concerning where taxi should drive towards is based on the attractiveness of each road section or a concrete zone. Experience and learning process can be modeled by updating the attractiveness of each zone or road section during the simulation. This can be done also at driver-level, hence each driver will have its own learning experience. An illustration is provided in Fig 3.
is the attractiveness of link
FIG 3. Intersection numeration (left), location of an agent (middle) and roulette for the intersection decision procedure (right) 15
3.4.Simulation run and scenarios assessment
Once the model has been completely defined, the scenario simulation can be run and the outputs of the model collected. Various runs are needed with different random seeds for the creation of the stochastic variables, using the average outputs obtained. However, users should check their distribution in order to eliminate the outliers and obtain average output distributions with small variability. If the variability of the outputs is high, the model should be checked and sensitivity analysis done in order to identify the variables and parameters responsible for this variability. In that case, we should try to better estimate them, or select other periods with less variability. The sensitivity analysis is also useful for identifying the critical variables, parameters, components and modules that
highly affect the model’s sensitiveness, and put more effort in their modeling and/or estimation.
3.4.1.Validation
The outputs of the model should be validated towards exogenous variables of the trips, such as travel time, distance or cost as well as towards exogenous variables of the customers, such as waiting time, which may be collected and processed independently of the data used. In the validation process the parameters of the model should be calibrated in order to achieve a good fit with the exogenous measurements, such as the ones related to routing preferences and driving behavior of the drivers or to the charging system. Perfect validation may not be possible due to the assumptions done in the simulation model, such as constant speed during the whole simulation, which will end up to overestimation and underestimation of travel times when the network is more or less congested respectively in comparison to the congestion level used for defining the speed in each road section. Usually validation towards distances provide better fit than towards travel time, since it is less dependent on the congestion level (see Fig 4).
FIG 4. Validation towards distance (left), travel time (centre) and cost (right) 15
Validation can be also done with regard to the amount of vehicles in each state during the simulation. It allows a better tackling of the dynamics of the system as well as daily variations in demand and supply for taxi trips. Lacks in the monitoring data or lack of capabilities of the model for simulating the breaks of the drivers between shifts make this kind of validation more difficult. Finally, validation can be done using exogenous data sources, like statistical data collected and estimated by third parties, such as taxi organizations or public authorities related to the taxi sector. In this case economic variables like incomes or expenses can be used together with more operational ones, such as the working hours and shifts based on regulation.
3.4.2.Results
Once the model has been validated, the indicators defined earlier in the preparation of the model can be calculated from the results generated by the simulation runs. It is important to note that the whole model was built
300 Salanova Grau, Estrada, Tzenos, Aifadopoulou, / Procedia Computer Science 00 (2018) 000–000 Josep Maria Salanova Grau et al. / Procedia Computer Science 130 (2018) 294–301 7
for estimating these indicators, which means that other set of indicators may not be as accurate as the original ones. Three illustrative examples are provided below:
– Estimation of the rides per driver based on the behavior and access to information and predictions in
Thessaloniki (using one day of real data containing trajectories and status of all vehicles).
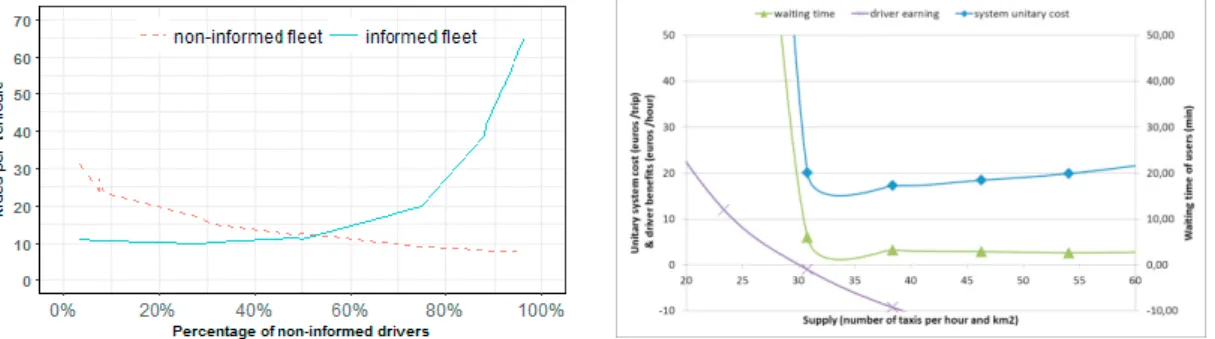
From Fig 5 (left), the difference in the number of rides per driver for informed drivers versus non-informed can be observed. When the informed drivers are minority, they outperform up to 100% better than the non-informed ones under the same conditions. This ride increment percentage is reduced to 25% when the informed drivers are majority, which is still a good result.
FIG 5 Rides per vehicle in informed and non-informed fleets 17 / Waiting time, driver benefits and unitary costs for each fleet size 15
– Estimation of the best operation taxi operation mode in the Sioux Falls network (using generated data).
Table 1: Simulation Results of the Three Operation Models: 14
Dispatching Stand Hailing Optimum fleet for system cost (vehicles) 8 10 14 Average occupied distance (m) 6.100 4.900 3.500 Average vacant distance (m) 4.200 330 14.000 Average occupied time (min) 25 20 14,5 Average vacant moving time (min) 35 16 90 Income (euros/h) 67 54 38 Driver unitary earnings (euros/hour) 32,5 30 -8
Ratio occupied/vacant moving time 0.65 (35-40%) 1.3 (55-60%) 0.16 (10-15%) Rate occupied/vacant distance 1.5 (60%) 15 (94%) 0.25 (20%) Average user waiting time (sec) 136 65 392 User unitary cost (euros/hour) 6,45 6,25 7,5 System cost (euros/hour) 385 325 865
From the results (table 1), it can be observed that the dispatching mode has the lowest number of vehicles requested and therefore the highest income for the drivers. However, it presents larger waiting time for the users than stand mode, which leads to the lowest system cost.
– Estimation of the optimum number of vehicles that minimizes the generalized system cost function in
Barcelona (using 9 years of real data containing customer trip origins and destinations).
The social optimum number of taxis per hour and km2 is 33-34 (Fig 5 right), while the maximum number of
vehicles that will not generate losses to taxi drivers is 30. Therefore, social optimum solution in not feasible in this
case unless local authorities subsidize taxi sector. If subsidization is not feasible, there will be 30 taxis/hour*km2
instead of 33-34, increasing the waiting time of the customers by a few minutes.
8 Salanova Grau, Estrada, Aifandopoulou, Tzenos / Procedia Computer Science 00 (2018) 000–000 4.Conclusions
The entry of third parties to the taxi sector together with the deregulation of their markets has resulted in the redesign of operational rules and policy frameworks of the taxi sector worldwide. New models should be developed for supporting decision makers in how to regulate and how to operate the taxi market from a public and private perspective respectively. During the next years, studies on the impact of innovative mobility schemes, some of them involving taxis, such as mobility as a service, will be supported by new modeling and simulating capabilities, allowing to replicate and to analyze such complicate environments. Activity-based and agent-based models can fulfill these needs thank to the larger availability and granularity of the data.
The large amount of available data allows for developing data intensive models, not only for transport planning purposes but also for operation issues. There is a need for defining the right modeling frameworks allowing for correctly handling the new datasets and delivering useful and reliable transport models. Nowadays agent-based modeling is a powerful tool able to reproduce complex environments with reliability and provide detailed and useful outputs without large computation needs. In order to develop such models, data science skills should complement the domain expertise.
5.References
1. Holland, J.H.. Miller, J.H. (1991). Artificial Adaptive Agents in Economic Theory. American Economic Review 81 (2), 365-71. 2. Kikuchi S., Rhee J. and Teodorovic D. (2002) Applicability of an agent-based modeling concept to modeling of transportation
phenomena. Yugoslav Journal of Operations Research 12 (2), 141-156.
3. Teodorovic D. (2003) Transport modeling by multi-agent systems: a swarm intelligence approach. Transportation planning and Technology 26 (4), 289-312.
4. Chen B. and Cheng H. H. (2010) A Review of the Applications of Agent Technology in Traffic and Transportation Systems. IEEE transactions on intelligent transportation systems vol. II (2) pp. 485 - 497.
5. Bailey, W. A. and Clark, T. D. (1987) A simulation analysis of demand and fleet size effects on taxicab service rates. Proc. of the 19th conference on Winter simulation, 838-844.
6. Bailey, W. A. and Clark, T. D. (1992) Taxi management and route control: a systems study and simulation experiment. Proc. of the 24th conference on Winter simulation, 1217-1222.
7. Kim H., Yang I. and Choi K. (2011) An Agent-based Simulation Modelfor Analyzing the Impact of Asymetric Passenger Demand on Taxi Service. KSCE Journal of Civil Engineering 15 (1), 187-195.
8. Song, Z. Q. and Tong, C. O. (2006) A simulation based dynamic model of taxi service. Proc. of Dynamic Traffic Assignment: First International Symposium on Dynamic Traffic Assignment.
9. Song, Z. Q. (2006). A Simulation Based Dynamic Taxi Model. Master thesis at the University of Hong Kong.
10. Chen Y. M. and Wang B. Y. (2009) Towards Participaroty Design of Multi-agent Approach to Transport Demands. DCSI International Journal of Computer Science Issues 4 (1) pp. 10 - 15.
11. Lioris J. E., Cohen G., and La Fortelle A. (2010) Evaluation of Collecvite Taxi Systems by Discrete-Event Simulation. Second International Conference on Advances in System Simulation pp. 34-39.
12. Shi W. (2010) Dynamic simulation and quantitative analysis of urban taxi services. Thesis for the degree of Master of Philosophy at the University of Hong Kong.
13. Cheng S. F. and Nguyen T. D. (2012) Taxisim: A Multiagent Simulation Platform for Evaluating Taxi Fleet Operations. AAMAS Workshops, LNAI 7068, 359-360.
14. Salanova J. M. (2013). Modeling of taxi cab fleets in urban environment. PhD thesis, Polytechnic University of Catalonia, BarcelonaTECH.
15. Salanova Grau J., Estrada M. (2015). Agent based modelling for simulating taxi services. Procedia – Computer Sciences, Vol 52, pp 902-907.
16. Maciejewski M., Salanova J. M., Bischoff J., Estrada M. (2016). Large-scale microscopic simulation of taxi services. Berlin and Barcelona case studies. Journal of Ambient Intelligence and Humanized Computing 7(3), pp 1-9
17. Salanova Grau J.M., Moreira-Matias L., Saadallah Amal, Tzenos P., Aifandopoulou G., Chaniotakis E.m Estrada M. (2018) informed versus non-informed taxi drivers: agent-based simulation framework for assessing their performance, Transportation Research Board 96th Annual Meeting, Washington, USA.
18. Salanova J. M., Estrada M. A., Mitsakis E., Stamos I. (2013) Agent Based Modeling for Simulating Taxi Services, Journal of Traffic and Logistics Engineering (JTLE) (ISSN: 2301-3680), Vol. 1 No. 2, June 2013. pp. 159 – 163.
19. Salanova J. M., Maciejewski M., Bischoff J., Estrada M., Tzenos P., Stamos I. (2017). Use of probe data generated by taxis. Big Data for regional science. Routledge Advances in Regional Economics, Science and Policy. Taylor & Francis Group.
20. SHEFFI, Y. (1985) Urban Transportation Networks: Equilibrium Analysis with Mathematical Programming Methods, Prentice-Hall, Englewood Cliffs, New Jersey.
for estimating these indicators, which means that other set of indicators may not be as accurate as the original ones. Three illustrative examples are provided below:
– Estimation of the rides per driver based on the behavior and access to information and predictions in
Thessaloniki (using one day of real data containing trajectories and status of all vehicles).
From Fig 5 (left), the difference in the number of rides per driver for informed drivers versus non-informed can be observed. When the informed drivers are minority, they outperform up to 100% better than the non-informed ones under the same conditions. This ride increment percentage is reduced to 25% when the informed drivers are majority, which is still a good result.
FIG 5 Rides per vehicle in informed and non-informed fleets 17 / Waiting time, driver benefits and unitary costs for each fleet size 15
– Estimation of the best operation taxi operation mode in the Sioux Falls network (using generated data).
Table 1: Simulation Results of the Three Operation Models: 14
Dispatching Stand Hailing Optimum fleet for system cost (vehicles) 8 10 14 Average occupied distance (m) 6.100 4.900 3.500 Average vacant distance (m) 4.200 330 14.000 Average occupied time (min) 25 20 14,5 Average vacant moving time (min) 35 16 90 Income (euros/h) 67 54 38 Driver unitary earnings (euros/hour) 32,5 30 -8
Ratio occupied/vacant moving time 0.65 (35-40%) 1.3 (55-60%) 0.16 (10-15%) Rate occupied/vacant distance 1.5 (60%) 15 (94%) 0.25 (20%) Average user waiting time (sec) 136 65 392 User unitary cost (euros/hour) 6,45 6,25 7,5 System cost (euros/hour) 385 325 865
From the results (table 1), it can be observed that the dispatching mode has the lowest number of vehicles requested and therefore the highest income for the drivers. However, it presents larger waiting time for the users than stand mode, which leads to the lowest system cost.
– Estimation of the optimum number of vehicles that minimizes the generalized system cost function in
Barcelona (using 9 years of real data containing customer trip origins and destinations).
The social optimum number of taxis per hour and km2 is 33-34 (Fig 5 right), while the maximum number of
vehicles that will not generate losses to taxi drivers is 30. Therefore, social optimum solution in not feasible in this
case unless local authorities subsidize taxi sector. If subsidization is not feasible, there will be 30 taxis/hour*km2
instead of 33-34, increasing the waiting time of the customers by a few minutes.
4.Conclusions
The entry of third parties to the taxi sector together with the deregulation of their markets has resulted in the redesign of operational rules and policy frameworks of the taxi sector worldwide. New models should be developed for supporting decision makers in how to regulate and how to operate the taxi market from a public and private perspective respectively. During the next years, studies on the impact of innovative mobility schemes, some of them involving taxis, such as mobility as a service, will be supported by new modeling and simulating capabilities, allowing to replicate and to analyze such complicate environments. Activity-based and agent-based models can fulfill these needs thank to the larger availability and granularity of the data.
The large amount of available data allows for developing data intensive models, not only for transport planning purposes but also for operation issues. There is a need for defining the right modeling frameworks allowing for correctly handling the new datasets and delivering useful and reliable transport models. Nowadays agent-based modeling is a powerful tool able to reproduce complex environments with reliability and provide detailed and useful outputs without large computation needs. In order to develop such models, data science skills should complement the domain expertise.
5.References
1. Holland, J.H.. Miller, J.H. (1991). Artificial Adaptive Agents in Economic Theory. American Economic Review 81 (2), 365-71. 2. Kikuchi S., Rhee J. and Teodorovic D. (2002) Applicability of an agent-based modeling concept to modeling of transportation
phenomena. Yugoslav Journal of Operations Research 12 (2), 141-156.
3. Teodorovic D. (2003) Transport modeling by multi-agent systems: a swarm intelligence approach. Transportation planning and Technology 26 (4), 289-312.
4. Chen B. and Cheng H. H. (2010) A Review of the Applications of Agent Technology in Traffic and Transportation Systems. IEEE transactions on intelligent transportation systems vol. II (2) pp. 485 - 497.
5. Bailey, W. A. and Clark, T. D. (1987) A simulation analysis of demand and fleet size effects on taxicab service rates. Proc. of the 19th conference on Winter simulation, 838-844.
6. Bailey, W. A. and Clark, T. D. (1992) Taxi management and route control: a systems study and simulation experiment. Proc. of the 24th conference on Winter simulation, 1217-1222.
7. Kim H., Yang I. and Choi K. (2011) An Agent-based Simulation Modelfor Analyzing the Impact of Asymetric Passenger Demand on Taxi Service. KSCE Journal of Civil Engineering 15 (1), 187-195.
8. Song, Z. Q. and Tong, C. O. (2006) A simulation based dynamic model of taxi service. Proc. of Dynamic Traffic Assignment: First International Symposium on Dynamic Traffic Assignment.
9. Song, Z. Q. (2006). A Simulation Based Dynamic Taxi Model. Master thesis at the University of Hong Kong.
10. Chen Y. M. and Wang B. Y. (2009) Towards Participaroty Design of Multi-agent Approach to Transport Demands. DCSI International Journal of Computer Science Issues 4 (1) pp. 10 - 15.
11. Lioris J. E., Cohen G., and La Fortelle A. (2010) Evaluation of Collecvite Taxi Systems by Discrete-Event Simulation. Second International Conference on Advances in System Simulation pp. 34-39.
12. Shi W. (2010) Dynamic simulation and quantitative analysis of urban taxi services. Thesis for the degree of Master of Philosophy at the University of Hong Kong.
13. Cheng S. F. and Nguyen T. D. (2012) Taxisim: A Multiagent Simulation Platform for Evaluating Taxi Fleet Operations. AAMAS Workshops, LNAI 7068, 359-360.
14. Salanova J. M. (2013). Modeling of taxi cab fleets in urban environment. PhD thesis, Polytechnic University of Catalonia, BarcelonaTECH.
15. Salanova Grau J., Estrada M. (2015). Agent based modelling for simulating taxi services. Procedia – Computer Sciences, Vol 52, pp 902-907.
16. Maciejewski M., Salanova J. M., Bischoff J., Estrada M. (2016). Large-scale microscopic simulation of taxi services. Berlin and Barcelona case studies. Journal of Ambient Intelligence and Humanized Computing 7(3), pp 1-9
17. Salanova Grau J.M., Moreira-Matias L., Saadallah Amal, Tzenos P., Aifandopoulou G., Chaniotakis E.m Estrada M. (2018) informed versus non-informed taxi drivers: agent-based simulation framework for assessing their performance, Transportation Research Board 96th Annual Meeting, Washington, USA.
18. Salanova J. M., Estrada M. A., Mitsakis E., Stamos I. (2013) Agent Based Modeling for Simulating Taxi Services, Journal of Traffic and Logistics Engineering (JTLE) (ISSN: 2301-3680), Vol. 1 No. 2, June 2013. pp. 159 – 163.
19. Salanova J. M., Maciejewski M., Bischoff J., Estrada M., Tzenos P., Stamos I. (2017). Use of probe data generated by taxis. Big Data for regional science. Routledge Advances in Regional Economics, Science and Policy. Taylor & Francis Group.
20. SHEFFI, Y. (1985) Urban Transportation Networks: Equilibrium Analysis with Mathematical Programming Methods, Prentice-Hall, Englewood Cliffs, New Jersey.