1 INTRODUCTION
When designing reinforced-concrete structures, a de-signer must satisfy not only the strength require-ments but also the serviceability requirerequire-ments. To ensure the serviceability requirements of tall rein-forced concrete buildings, it is necessary to accu-rately assess the deflection under lateral and gravity loads. In recent years high-rise and slender structures have been constructed using high-strength steel and concrete. Therefore, the serviceability limit state for lateral drift becomes much more important design criterion and must be satisfied to prevent large sec-ond-order P-delta effects. In addition, the control of the deformation in reinforced concrete beams is also important to ensure the serviceability requirements. Due to low tensile strength of concrete, cracking, which is primarily load dependant, can occur at ser-vice loads and reduce the flexural and shear stiffness of reinforced concrete members. For accurate deter-mination of the deflections, cracked members in the reinforced concrete structures need to be identified and their effective flexural and shear stiffnesses de-termined.
Cracked state in reinforced concrete beam ele-ments can be modeled in several ways (Ngo & Scor-delis 1967, Channakeshava & Sundara 1988). These methods take into account the constitutive relation-ships of both steel and concrete together with the bond-slip relationship. However, due to the
com-plexities of the actual behavior R/C frames and cum-bersome computations to be carried out these methods can not easily be adopted by design engi-neers.
In the design of tall reinforced concrete structures, the moments of inertia of the beams and columns are usually reduced at the specified ratios to compute the lateral drift by considering the cracking effects on the stiffness of the structural frame (Stafford & Coull 1991). The gross moment of inertia of col-umns is generally reduced to 80% of their uncracked values while the gross moment of inertia of beams is reduced to 50%, without considering the type, his-tory and magnitude of loading, and the reinforce-ment ratios in the members.
A simplified and computationally more efficient method for the analysis of two dimensional rein-forced concrete frames with beam elements in cracked state was developed by Tanrikulu et. al. (2000). ACI (1966) and CEB (1985) model equa-tions, which consider the contribution of tensile re-sistance of concrete to flexural stiffness by moment-curvature relationships, were used to evaluate the ef-fective moment of inertia. Shear deformations were also taken into account in the formulation and the variation of shear stiffness due to cracking was con-sidered by reducing the shear stiffness through ap-propriate models. In the analysis cracking was con-sidered only for beam elements, hence, the linear
3D analysis of RC frames using effective-stiffness models
C. Dundar & I.F. Kara
Department of Civil Engineering, Cukurova University, Adana, Turkey
ABSTRACT: In the present study, a computer program has been developed using rigid diaphragm model for the three dimensional analysis of reinforced-concrete frames with cracked beam and column elements. ACI, CEB and probability-based effective stiffness models are used for the effective moment of inertia of the cracked members. In the analysis, shear deformations which can be large following crack development are taken into account and the variation of the shear stiffness due to cracking is considered by reducing the shear stiffness through appropriate models. The computer program is based on an iterative procedure which is sub-sequently experimentally verified by fitting the results of a test on a two-story R/C frame. A parametric study is also carried out on a four-story, three-dimensional reinforced-concrete frame. The iterative analytical proce-dure can provide an accurate and efficient prediction of deflections in R/C structures due to cracking under service loads. The most significant feature of the proposed procedure is that the variations in the flexural stiff-ness of beams and columns can be directly evaluated.
elastic stiffness equation was used for columns. However, for accurate determination of lateral de-flections of tall reinforced concrete structures, it is important to consider the effects of concrete crack-ing on the stiffness of the columns. Therefore, the reduction of flexural and shear stiffnesses in the col-umns due to cracking should also be taken into ac-count.
Two iterative analytical procedures were devel-oped for calculating the lateral drifts in tall rein-forced concrete structures (Chan et. al. 2000). A general probability-based effective stiffness model was used to consider the effects of concrete crack-ing. The analytical procedures named direct effective stiffness and load incremental methods were based on the proposed effective stiffness model and itera-tive algorithm with the linear finite element analysis. The variation of shear stiffness due to cracking was not considered in the analysis. Whereas, after the de-velopment of cracks, shear deformations, can be large and significant. Hence, the reduction of shear stiffnesses due to cracking should also be included for improving the results of the analysis.
In practice, the analysis of reinforced concrete frames is usually carried out by linear elastic models which either neglect the cracking effect or consider it by reducing the stiffness of members arbitrarily. It is also quite possible that the design of tall reinforced concrete structures on the basis of linear elastic the-ory may not satisfy the serviceability requirements. Therefore, an analytical model which can include the effects of concrete cracking on the flexural and shear stiffness of the members and accurately assess the deflections would be very useful. In the present study, a computer program has been developed using rigid diaphragm model for the three dimensional analysis of reinforced concrete frames with cracked beam and column elements. In the analysis, stiffness matrix method is applied to obtain the numerical so-lutions, and the cracked member stiffness equation is evaluated by including the uniformly distributed and point loads on the member. In obtaining the flexibil-ity influence coefficients a cantilever beam model is used which greatly simplifies the integral equations for the case of point load. In the program, the varia-tion of the flexural stiffness of a cracked member is evaluated by ACI, CEB and probability-based effec-tive stiffness models. Shear deformation effect is also taken into account and reduced shear stiffness is considered by using effective shear modulus models (Cedolin & dei Poli 1977, Al-Mahaidi 1978 and Yu-zugullu & Schnobrich 1973). The results have been verified with the experimental results available in the literature. Finally a parametric study is carried out on a four-story, three-dimensional reinforced-concrete frame.
2 MODELS FOR THE EFFECTIVE FLEXURAL STIFFNESS OF A CRACKED MEMBER ACI and CEB models which consider the effect of cracking and participation of tensile concrete be-tween cracks have been proposed to define the effec-tive flexural behavior of reinforced concrete cracked section. In the ACI model the effective moment of inertia is given as cr M M for 2 I m M cr M 1 1 I m M cr M eff I ≥ − + = (1b) cr M M for 1 I eff I = < (1b)
where m=3. This equation was first presented by Bronson (1963) with m=4 when Ieff is required for the calculation of curvature in an individual section. In the CEB model Ieffis also defined in the following form: 1 1 2 2 cr 2 1 1 2 cr 2 1 eff forM M I 1 M M β β 1 I 1 M M β β I ≥ − + = − (2a) cr M M for 1 I eff I = < (2b)
in which β1=0.5 for plain bars and 1 for high bond reinforcement; β2=1 for the first loading and 0.5 for the loads applied in a sustained manner or in a large number of load cycles (Ghali & Favre 1986).
In Eqs. (1) and (2), I1 and I2 are the moments of iner-tia of the gross section and the cracked transformed section, respectively, M is the bending moment, Mcr
is the moment corresponding to flexural cracking considered. The cracking moment, Mcr is calculated by the program using the following equation:
(
)
t 1 v r cr y I f M = +σ (3)where σv is the axial compressive stress, fr is the flexural tensile strength of concrete, and yt is the dis-tance from centroid of gross section to extreme fiber in tension.
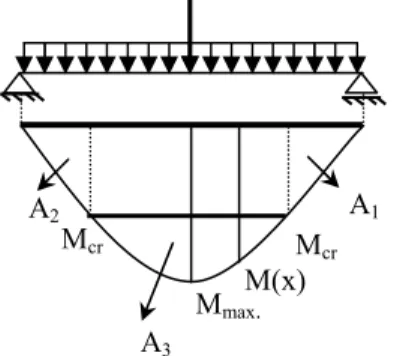
In addition to ACI and CEB models, probability-based effective stiffness model (Chan et. al. 2000) which accounts for the effects of concrete cracking with the stiffness reduction has been considered. In the probability-based effective stiffness model, the effective moment of inertia is obtained as the ratio of the area of moment diagram segment over which the working moment exceeds the cracking moment Mcr to the total area of moment diagram in the following form (Fig.1). ∫ = + = < cr M ) x ( M 2 1 uncr A A M(x) A (4a)
∫ = = ≥ cr M ) x ( M 3 cr A M(x) A (4b) uncr cr A A A= + (4c)
[
]
A A M ) x ( M Puncr < cr = uncr (4d)[
]
A A M ) x ( M Pcr ≥ cr = cr (4e) 2 cr 1 uncr eff P I P I I = + (4f)where Acr is the area of moment diagram segment
over which the working moment exceeds the crack-ing moment Mcr and A is the total area of moment
diagram. In the same equation, Pcr and Puncr are the
probability of occurrence of cracked and uncracked sections, respectively. The applicability of the pro-posed model was also verified with the frame test re-sults (Chan et. al. 2000).
Figure 1. Cracked and uncracked regions of the simply sup-ported beam element subjected to concentrated and a uni-formly-distributed loads.
In the literature (Cosenza 1990, Sakai & Kakuta 1980 and Al-Shaikh & Al-Zaid 1993), the effective moment of inertia given by ACI and CEB is the best among the commonly accepted simplified methods for the estimation of instantaneous deflection. Al-though ACI and CEB models are usually considered for beams, in the present study these models are also used for columns, including the axial force in the de-termination of the cracking moment. In the analysis the axial force in the beams is also considered for the calculation of the cracking moment, no matter if it is relatively small. In the computer program developed in the present study, afore-mentioned models are used for the effective moment of inertia of the cracked section.
3 MODELS USED FOR THE EFFECTIVE SHEAR STIFFNESS OF CONCRETE
Several formulations are found in the literature for concrete effective shear modulus after cracking.
Cedolin and dei Poli (1977) observed that a value of Gc linearly decreasing with the fictitious strain normal to the crack would give better predictions for beams failing in shear, and suggested the following equation cr 1 1 c c 0.24G (1-250 ) for G = ε ε ≥ε (5a) cr 1 c c G for G = ε <ε (5b)
where Gc is the elastic shear modulus of uncracked concrete, ε1 is the principal tensile strain normal to the crack and εcr is the cracking tensile strain.
Al-Mahaidi (1978) recommended the following hyperbolic expression for the reduced shear stiffness
c
G to be employed in the constitutive relation of cracked concrete cr 1 c c / G 4 . 0 G ε ε = (6)
Yuzugullu and Schnobrich (1973) used a constant value of G for the effective shear modulus c
beams deep for G 25 . 0 Gc = c (7a) systems frame wall shear for G 125 . 0 Gc = c − . (7b)
The computer code developed in this research pro-ject has been implemented with the afore-mentioned formulations of the shear modulus after cracking.
In the rigid diaphragm model developed for the three dimensional analysis of reinforced-concrete frames, the basic assumption being that there are no in-plane deformations in the floor and also, the floor is assumed to be infinite rigid in its plane. Each floor plate is assumed to be translate in plan and rotate about a vertical axis as a rigid body. In this study, since rigid diaphragm model is considered, cracking occurs only in the beam element due to flexural moments in local y direction. On the other hand, the column element cracks due to the flexural moments in local y and z directions. Hence Ieff, Mcr, M, I1, I2,
ε1and ε2, are the values related to the flexure in local y and z directions.
4 FORMULATION OF THE PROBLEM
In this section, the flexibility coefficients of a member will first be evaluated, and then using compatibility conditions and equilibrium equations, stiffness matrix and the load vector of a member with some regions in cracked state will be obtained.
Mcr Mcr
Mmax.
A3
A2 A1
Figure 2. A typical member subjected to concentrated and a uniformly-distributed loads.
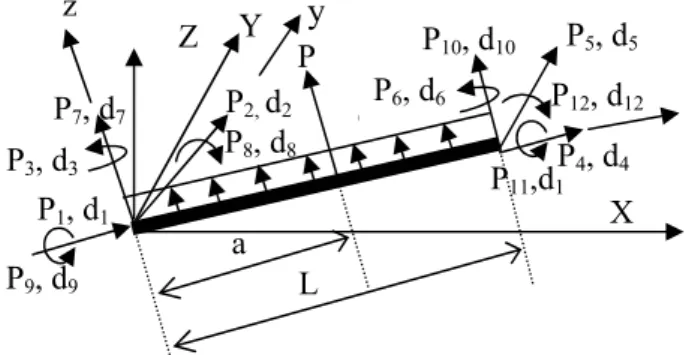
A typical member subjected to concentrated and a uniformly-distributed loads, and positive end forces with corresponding displacements are shown in Fig-ure 2. A cantilever model is used for computing the relations between nodal actions and basic deforma-tion parameters of a general space element (Fig. 3).
Figure 3. A cantilever model for computing the relations be-tween the nodal actions and basic deformation parameters. The basic deformation parameters of a general space element may be established by applying unit loads in turn in the directions of 1-3 and 7-9. Then, the com-patibility conditions give the following equation in matrix form: = 9 8 7 3 2 1 9 8 7 3 2 1 99 88 87 78 77 33 32 23 22 11 d d d d d d P P P P P P f 0 0 0 0 0 0 f f 0 0 0 0 f f 0 0 0 0 0 0 f f 0 0 0 0 f f 0 0 0 0 0 0 f (8)
in which, fij is the displacement in i-th direction due
to the application of unit loads in j-th direction, and can be evaluated by means of the principal of virtual work as follows dx A E N N I G M M s A G V V s A G V V I E M M I E M M f L 0 c j i o c bj bi c zj zi c yj yi effy c yj yi effz c zj zi ij ∫ + + + + + = (9) In Eq. (9), Mzi, Mzj, Myi, Myj, Vzi, Vzj, Vyi, Vyj, Mbi, Mbj, Ni and Nj are the bending moments, shear
forces, torsional moments and axial forces due to the application of unit loads in i-th and j-th directions, respectively, Ec and I0 denote the modulus of
elastic-ity of concrete and torsional moment of inertia of the cross section, s and A are the shape factor and the cross sectional area, respectively.
Three dimensional member stiffness matrix is ob-tained by inverting the flexibility matrix in Eq. (8) and using the equilibrium conditions
The member fixed-end forces for the case of a point and a uniformly distributed loads can be evalu-ated by means of compatibility and equilibrium con-ditions as follows 0. P P P P P P P P10 = 20 = 30 = 40 = 50 = 60 = 90= 110 = (10a) ). f f f (f / ) f f -f (f -P70 = 88 70 78 80 77 88 78 87 (10b) ). f f f (f / ) f f -f (f -P80 = 77 80 78 70 77 88 78 87 (10c) ). P P L (q -P100 = + + 70 (10d) ) P L P a) -(L P 2 / L (q -P120 = 2 + + 70 + 80 (10e)
where fi0 (i=7,8) is the displacement in i-th direction
due to the application of span loads which can be ob-tained by using the principal of virtual work in the following form dx s A G V V I E M M f L 0 c 0 zi effy c 0 yi 0 i ∫ + = (11)
where M0and V0 are the bending moment in local y
direction and shear force in local z direction due to the span loads. Finally, the member stiffness equa-tion can be obtained as
P P d
k + 0 = (12) where k (12x12) is the stiffness matrix, d (12x1) is the displacement vector, P0 (12x1) is the fixed end force vector and P (12x1) is the total end force vec-tor of the member. Since Eq. (12) is given in the member coordinate system (x, y, z), it should be transformed to the structure coordinate system (X, Y, Z).
In the rigid diaphragm model, member equations are first obtained and then considering contributions which come from each element, the system stiffness matrix and system load vector are assembled. Fi-nally, the system displacements and member end forces are obtained by solving the system equation. This procedure is repeated step by step in all itera-tions.
The flexibility influence coefficient can be evaluated by means of Eqs. (9) and (11) with the expressions of moment and shear forces obtained from the application of unit and span loads. Details of the formulation can be found in Dundar and Kara (2007).
It should be noted that, since the member has cracked and uncracked regions, integral operations in Eqs. (9) and (11) will be performed in each gion. In general, the member has three cracked re-gions and two uncracked rere-gions as seen in Fig. 4.
P9, d9 z P4, d4 P5, d5 y Z X P1, d1 P7, d7 P2, d2 P3, d3 P10, d10 P12, d12 P6, d6 a P P8, d8 P11,d1 Y L q 8 3 1 9 2 y z x 7
Figure 4. Cracked and uncracked regions in a member.
In the cracked regions where M>Mcr, Ieff and c
G vary with M along the region. Hence, the integral values in these regions should be computed by a numerical integration technique. The variation of ef-fective moment of inertia and efef-fective shear modulus of concrete in the cracked regions necessi-tate the redistribution of the moments in the struc-ture. Therefore, iterative procedure should be ap-plied to obtain the final deflections and internal forces of the structure.
5 COMPUTER PROGRAM
A general purpose computer program developed in the present study on the basis of iterative procedure is coded in FORTRAN 77 language. In the solution procedure, the member end forces used in each itera-tion step are taken as the mean value of the end forces of all previous iterations. This procedure ac-celerates the convergence of the algorithm. In the program, the following equation is used as the con-vergence criterion ε ≤ − − n i 1 n i n i P P P . (13)
In Eq.(13) n is the iteration number, ε is the conver-gence factor and Pin (i=1,12) is the end forces of each member of the structure for n-th iteration.
6 VERIFICATION OF ITERATIVE PROCDURE BY THE EXPERIMENTAL RESULTS AND A FOUR STORY FRAME EXAMPLE
In this part, two examples are presented. The first example is taken from the literature to verify the ap-plicability of the analytical procedure. The second example is the application of the proposed analytical
method on a three-dimensional, four-story reinforced concrete frame.
6.1 Example 1
In this example, the test results given by Chan et. al. (2000) for a two story reinforced concrete frame have been compared with the results of the present computer program. This reinforced concrete frame was designed with a center to center span of 3000 mm, a first story height of 1170 mm and a second story height of 2000 mm (Fig. 5). This frame is mod-eled by four columns of 250x375 mm and two beam elements of 250x350 mm cross sections. The rein-forcing steel in the beams and columns, the span and the loads are also shown in the figure.
The test procedure involved first applying a total axial load of 200 kN to each column and maintain-ing this load throughout the test. The lateral load (Q) was then monotonically applied until the ultimate capacity of the frame was achieved. In the analysis, ACI and probability-based effective stiffness models are used for the effective moment of inertia and Al-Mahaidi’s model is used for the shear modulus of concrete in the cracked regions. The reduction of the flexural stiffness in the beams and columns under increasing lateral loads are also obtained by using probability-based effective stiffness model. In com-puting flexural tensile strength and modulus of elas-ticity of concrete the following equations (ACI 1995) are also used.
2 c c 4730 f N /mm E = (14a) 2 c r 0.62 f N/mm f = (14b)
in which, fc is the compressive strength of concrete.
Figure 5. Two story reinforced concrete frame tested by Chan et. al. (2000) (dimensions in mm).
350 Section A-A 250 50 50 3Φ20 3Φ20 250 375 40 40 3Φ20 3Φ2 0 2Φ20 200 kN 200 kN 6 2 5 C3 B2 3 Q 3000 B B B1 2000 A A C2 C1 C4 A A A A A A B B Section B-B 1 4 P Mi Mj Mcr Mcr 1 2 3 4 5 1, 3, 5 cracked regions 2, 4 uncracked regions L q a j i Mcr Mcr 1170
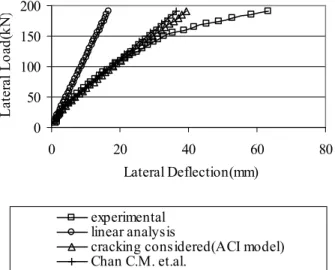
In order to determine the applicability of pro-posed procedure, the comparison between the test and theoretical results for the lateral deflection of joint 6 obtained by the linear analysis and cracking analysis, is presented in Fig. 6.
Figure 6. Comparison between experimental and analytical re-sults concerning the drift of joint 6.
It is seen that the deflections calculated by the de-veloped computer program using ACI model agree well with the test results for applied lateral loads up to approximately 80% of the ultimate load (i.e., at the value of approximately 155 kN). When the lat-eral load is beyond this load level the difference tween the experimental and theoretical results be-comes significant. On the other hand, the results of the proposed analytical procedure which considers the variation of shear stiffness due to cracking gives better prediction of deflections than the other nu-merical study developed by Chan et. al. (2000).
Figure 7. Plots of the drift (joint 6) according to the different models adopted for the effective moment of inertia.
Fig. 7 presents a comparison of the top deflections using the different models for the effective moment
of inertia of the cracked members. As seen from the figure, although different models have been used for the effective flexural stiffness, the results are very close to each other.
Figure 8. Flexural stiffness reduction of each member versus lateral loads.
The variation of the flexural stiffness of beams and columns with respect to the lateral applied load is also shown in Fig. 8. As seen from the figure, the beams of the first and second stories crack first and then two columns on the lateral loading side, C4 and C2, start to crack followed by, in the final stage, the cracking of both columns on the opposite loading side, C3 and C1. Fig 8 also shows that when the lat-eral load reaches 78% of the ultimate latlat-eral load, the beams at the first and second stories have 45 and 47%, respectively, of the gross moment of inertia, and the two columns at the second story have 55 and 60% of their uncracked values. The other two col-umns at the first story have also 53 and 60% of their gross moment of inertia. The results show that con-sidering the cracking effect on the stiffness of struc-tural frame by assigning an 80% reduced moment of inertia to all the columns and a 50% reduced mo-ment of inertia to all the beams does not always guarantee a conservative prediction of the lateral drift.
Figure 9. Effects of shear deformation on frame drift (joint 6) according to the proposed numerical procedure.
0 50 100 150 200 0 20 40 60 80 Lateral Deflection(mm) L ate ra l L o ad (k N ) experimental
cracking considered(ACI model)
cracking considered(probability-based eff. stiff.mod.) 0 50 100 150 200 0 20 40 60 80 Lateral Deflection(mm) L a te ra l L o a d (k N ) experimental linear analysis
cracking considered(ACI model) Chan C.M. et.al. 0 50 100 150 200 0 10 20 30 40 Lateral Deflection(mm) L at er al L o ad ( k N )
shear deformation considered shear deformation not considered
0 0.2 0.4 0.6 0.8 1 0 50 100 150 200 Lateral Load(kN) Ieff / I1 1 st column(C1) 2 nd column(C2) 3 rd column(C3) 4 th column(C4) 1 st beam(B1) 2 nd beam(B2)
Fig. 9 shows the contribution of the shear defor-mation to the lateral drift of joint 6. This contribu-tion increases under increasing lateral loads (for in-stance, by 14% at 78% of the ultimate lateral load).
6.2 Example 2
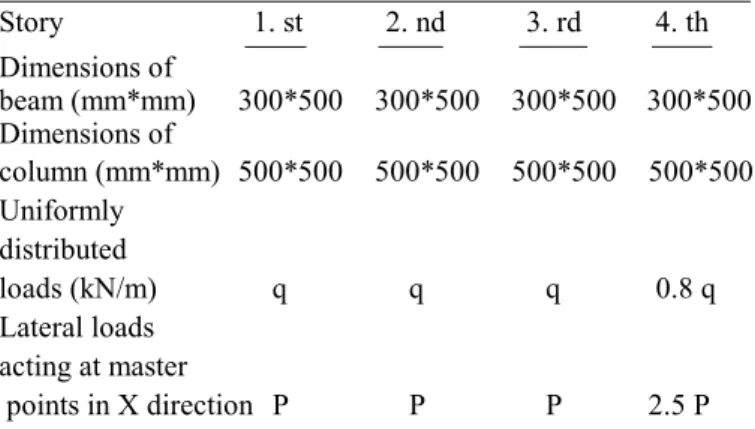
In this example, the four-story reinforced concrete frame shown in Fig. 10 is analyzed by means of the proposed procedure. This three-dimensional rein-forced-concrete frame is subjected to lateral loads at each story master point and uniformly distributed loads on the beams. The dimensions of the members and the loads are given in Table 1. In the analysis, the effective moment of inertia is evaluated by ACI and probability-based effective stiffness models and the effective shear modulus is predicted by Al-Mahaidi’s model. In this example, the lateral loads acting at each story master point, which are ex-pressed in terms of the values of P, are increased while the intensity of uniform loads (q=30 kN/m) remain constant.
Figure 10. Four-story reinforced concrete frame (dimensions in m
Table 1. Dimensions of the members and loads applied to the frame Story 1. st 2. nd 3. rd 4. th Dimensions of beam (mm*mm) 300*500 300*500 300*500 300*500 Dimensions of column (mm*mm) 500*500 500*500 500*500 500*500 Uniformly distributed loads (kN/m) q q q 0.8 q Lateral loads acting at master points in X direction P P P 2.5 P
The variation of the maximum relative lateral dis-placement of the second floor with the lateral load, when cracking is considered and not considered for beams and columns are shown in Fig. 11. As seen from the figure, the differences in the maximum relative lateral displacement of the second floor be-tween the two cases increase with increasing lateral loads. The difference becomes significant at higher loads such as 70 % for P=200 kN.
Figure 11. Plots of the drift of the second floor as a function of the lateral load.
The flexural stiffness reductions of various mem-bers with respect to the lateral applied load are shown in Fig. 12. As seen from figure, when the stiffness of beams are reduced to 50% of their un-cracked stiffness, the two first-story columns have reduced to 57-61% of their uncracked stiffness.
Figure 12. Flexural stiffness reductions of beams and columns with respect to the lateral applied load.
C1 3.2 3.2 3.2 3.2 5 5 4 5 5 5 5 X Y Z B1 B3 B2 C2 B4 C3 0 50 100 150 200 0 2 4 6 8 10 12
Relative Lateral Displacement(mm)
L at er al L o ad (P ,k N)
cracking considered (ACI model) linear analysis
cracking considered (probability-based eff. stiff. mod.) 0 0.2 0.4 0.6 0.8 1 0 50 100 150 200 Lateral Load(P,kN) Ieffy / I1y 1 st column (C1) 2 nd column (C2) 3 rd column (C3)' 1 st beam (B1) 2 nd beam(B2) 3 rd beam (B3) 4 th beam (B4)
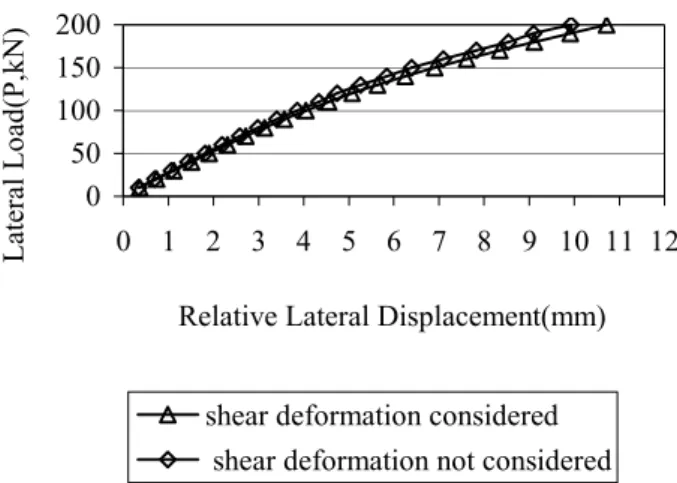
Fig. 13 also shows the theoretical influence of shear deformation on the maximum relative lateral displacement of the second floor. The shear deformations contribute up to approximately 10% of the total lateral displacements.
Figure 13. Theoretical influence of shear deformation on the lateral deflection of a three dimensional reinforced concrete frame.
7 CONCLUSIONS
An iterative procedure has been developed to ana-lyze three dimensional reinforced-concrete frames with cracked beams and columns. The variation of the flexural stiffness of a cracked member has been evaluated by using ACI, CEB and probability-based effective stiffness models. Shear deformations which can be large after the development of cracks and be of practical importance in the design and behavior of the structure are also taken into account in the analy-sis. The role of shear stiffness in cracked regions has also been investigated taking advantage of the for-mulations found in the literature for the reduced shear stiffness.
The capability and the reliability of the proposed procedure have been tested by means of comparisons with the theoretical and experimental results avail-able in the literature. The numerical results of the analytical procedure have been found to be in good agreement with the test results for applied loads up to approximately 80% of the ultimate load capacity of the frame. The analytical procedure not only pre-dicts the deflections to a value of load equal to ap-proximately 80% of the ultimate load with good ac-curacy, but it also can give an estimation of behavior at approximately 85% of the ultimate load with an acceptable degree of accuracy.
In the analysis, flexural stiffness reductions of beams and columns with respect to the lateral ap-plied load can be obtained by the developed program using the probability-based effective stiffness model for the effective moment of inertia. This is the most
significant feature of the proposed procedure and the variations in the flexural stiffness reductions of beams and columns in the reinforced concrete struc-ture can be directly evaluated.
The theoretical deflections of reinforced concrete structure have also been evaluated using different ef-fective flexural stiffness models. It should be noted that different models provide quite similar results.
The numerical results of the analytical procedures indicate that the proposed procedure which considers the variation of shear stiffness after the development of cracks gives better predictions of deflections than other analytical procedures. It is therefore important to consider the variation of shear stiffness in the cracked regions of members in order to obtain more accurate results.
RFERENCES
ACI Committee 435. 1966. Deflection of reinforced concrete flexural members. ACI J. 63: 637-674.
Al-Mahaidi, R.S.H. 1978. Nonlinear finite element analysis of reinforced concrete deep members. Department of Struct. Engrg. Cornell University. Report No: 79-1: 357.
Al-Shaikh, A.H. & Al-Zaid R.Z. 1993. Effect of reinforcement ratio on the effective moment of inertia of reinforced con-crete beams. ACI Structural J. 90: 144-149.
Branson, D.E. 1963. Instantaneous and time-dependent deflec-tions of simple and continuous reinforced concrete beams.
Alabama Highway Deparment/USBureau of Public Roads HPR Report No.7(1): 78.
Cedolin, L. & dei Poli S. 1977. Finite element studies of shear critical reinforced concrete beams. J. Engineering Mech. Div. ASCE (EM3).
Comite Euro-International du Beton. 1985. Manual on Crack-ing and Deformation. Bulletin d’Information 158-E. Cosenza, E. 1990. Finite element analysis of reinforced
con-crete elements in a cracked state. Computers & Structures
36(1): 71-79.
Chan, C.M. Mickleborough, N.C Ning, F. 2000. Analysis of cracking effects on tall reinforced concrete buildings. J. Struct. Engrg. 126(9): 995-1003.
Channakeshava, C. & Sundara Raja Iyengar, K.T. 1988. Elasto-plastic cracking analysis of reinforced concrete. J. Struct. Engrg. ASCE 114: 2421-2438.
Dundar, C. & Kara, I.F. 2007. Three dimensional analysis of reinforced concrete frames with cracked beam and column elements. Accepted for publication in Engineering Struc-tures.
Ghali, A. & Favre R. 1986. Concrete Structures: Stresses and Deformations. Chapman & Hall, N.Y.
Ngo, D. & Scordelis A.C. 1967. Finite element analysis of rein-forced concrete beams. ACI J. 64(3): 152-163.
Sakai, K. & Kakuta, Y. 1980. Moment-curvature relationship of reinforced concrete members subjected to combined bending and axial force. ACI J. 77: 189-194.
Stafford, S.B. & Coull, A. 1991. Tall building structures: Analysis and design. Wiley, New York.
Tanrikulu, A.K. Dundar, C. Cagatay, I.H. 2000. A Computer program for the analysis of reinforced concrete frames with cracked beam elements. Structural Engineering and Me-chanics 10(5): 463-478.
Yuzugullu, O. Schnobrich, W.C. 1973. A numerical procedure for the determination of the behaviour of a shear wall frame system. ACI J. 70(7): 474-479. 0 50 100 150 200 0 1 2 3 4 5 6 7 8 9 10 11 12
Relative Lateral Displacement(mm)
L ate ra l L o ad (P ,k N )
shear deformation considered shear deformation not considered