Volume 16 | Issue 1 Article 17
5-1-2017
An Extended Weighted Exponential Distribution
Abbas Mahdavi
Department of Statistics, Faculty of Mathematical Sciences, Vali-e-Asr University of Rafsanjan, Rafsanjan, Iran, [email protected]
Leila Jabari
Department of Statistics, Faculty of Mathematical Sciences, Vali-e-Asr University of Rafsanjan, Rafsanjan, Iran
Follow this and additional works at:http://digitalcommons.wayne.edu/jmasm
Part of theApplied Statistics Commons,Social and Behavioral Sciences Commons, and the Statistical Theory Commons
Recommended Citation
Mahdavi, A. & Jabbari, L. (2017). An extended weighted exponential distribution. Journal of Modern Applied Statistical Methods, 16(1), 296-307. doi: 10.22237/jmasm/1493597760
Abbas Mahdavi is Faculty of Mathematical Sciences in the Department of Statistics. Email them at: [email protected]. Leila Jabbari is Faculty of Mathematical Sciences in the Department of Statistics.
An Extended Weighted Exponential
Distribution
Abbas Mahdavi
Vali-e-Asr University of Rafsanjan Rafsanjan, Iran
Leila Jabbari
Vali-e-Asr University of Rafsanjan Rafsanjan, Iran
A new class of weighted distributions is proposed by incorporating an extended exponential distribution in Azzalini’s (1985) method. Several statistics and reliability properties of this new class of distribution are obtained. Maximum likelihood estimators of the unknown parameters cannot be obtained in explicit forms; they have to be obtained by solving some numerical methods. Two data sets are analyzed for illustrative purposes, and show that the proposed model can be used effectively in analyzing real data.
Keywords: Exponential distribution, extended exponential distribution, hazard rate function, maximum likelihood estimation, weighted exponential distribution
Introduction
Adding an extra parameter to an existing family of distribution functions is common in statistical distribution theory. Introducing an extra parameter often brings more flexibility to a class of distribution functions, and it can be very useful for data analysis purposes. Azzalini (1985) introduced the skew normal distribution by introducing an extra parameter to bring more flexibility to the normal distribution. Afterwards, extensive works on introducing shape parameters for other symmetric distributions have been defined, and several properties and their inference procedures have been discussed by several authors; see for example Balakrishnan and Ambagaspitiya (1994), Arnold and Beaver (2000), and Nadarajah (2009).
Recently, there has been an attempt to use Azzalini's method for non-symmetric distributions. Gupta and Kundu (2009) introduced a class of weighted exponential (WE) distribution that has a shape parameter. It is said that a random variable X follows the WE(α, λ) distribution if its density function is given by
1
f x; ,
e x 1 e x
(1) where x > 0, α > 0, and λ > 0.Shakhatreh (2012) generalized the WE distribution to the two-parameter weighted exponential (TWE) distribution. A random variable X is said to have a TWE distribution with shape parameters α1 > 0, α2 > 0 and scale parameter λ > 0 if the PDF of X is given by
1
2
1 2 1 2 f x; ,
, k
, ex 1 e x 1 e x , x0 (2) where
1 2 1 2 1 2 1 2 1 2 1 1 1 k , 2 .It is observed that the WE and TWE distributions can provide a better fit for survival time data relative to other common distributions such as the gamma, Weibull, or generalized exponential distributions.
The aim of this study is to introduce an extended weighted exponential (EWE) distribution based on extended exponential (EE) distribution introduced by Gómez, Bolfarine, and Gómez (2014). A random variable X follows the EE distribution with parameters λ and β if its density function is given by
2
1
f ; , , 0 x x e x x
(3)where λ > 0 and β > 0 with the notation X ~ EE(λ, β).
One of the goals of the introduction of the EWE is that involves the WE as its sub-model. The EWE has three parameters, one scale parameter and two shape parameters, which makes it more flexible in describing different types of real data than its sub model.
It is observed that the EWE distribution has several desirable properties. The generation of random samples from the EWE is straight forward. The maximum likelihood estimators (MLEs) of unknown parameters can be obtained by solving three nonlinear equations. For illustrative purposes we have analyzed the two real data sets. After analyzed the data using the EWE model, observe that EWE provides a better fit than the WE model and TWE.
Definition, Interpretations, and Generation
Definition: A random variable X is said to have an extended weighted
exponential distribution with shape parameters α > 0, β > 0 and scale parameter
λ > 0, denoted by EWE(α, β, λ), if the density function of X is given as below
1
2
f ; , , e e 1 x x x x (4)for x > 0 and 0 otherwise.
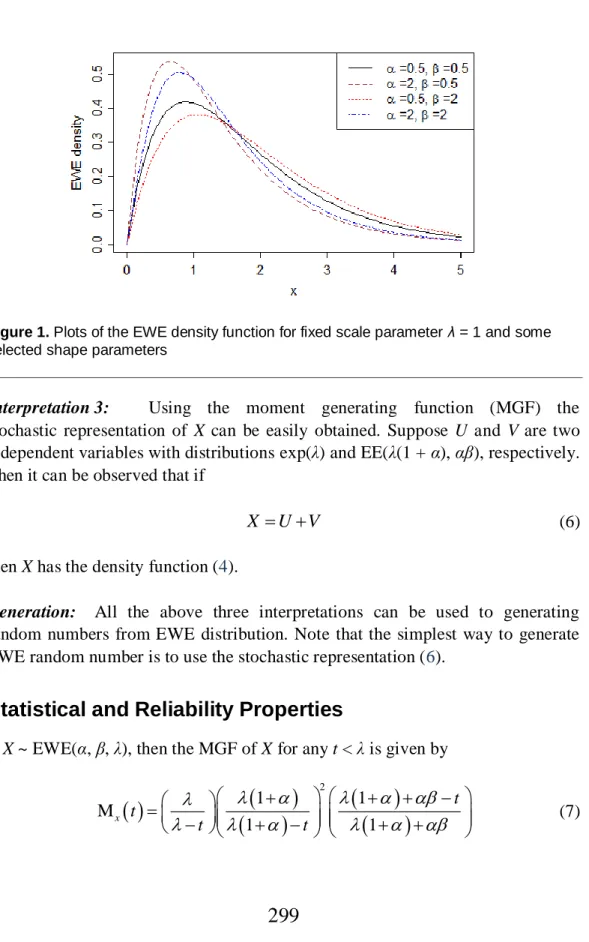
Plots of the EWE density function for fixed scale parameter λ = 1 and selected shape parameters are given in Figure 1. It is a unimodal density function for various values of the shape parameters. It is easy to show that if α→ 0 then (4) converges to gamma(2, λ) and if α→∞ then (4) converges to exp(λ). Note that, when β = 0, then EWE(α, β = 1, λ) = WE(α, λ).
Interpretation 1: EWE distribution can be obtained the same way that
Azzalini obtained the skew-normal distribution. Suppose X1 and X2 are two independent variables and X1 ~ exp(λ), X2 ~ EE(λ, β). For any α > 0, consider a new random variable X = X1 given that αX1 > X2. It can be easily observed that the density function of X is (4).
Interpretation 2: EWE distribution can be obtained by the hidden truncation
model proposed by Arnold and Beaver (2000). Suppose Z and Y are two dependent random variables with the joint density function
3
1 , fZ Y z y,
z 1
zy e z y , z 0,y 0
(5)It can be shown that the conditionally random variable Z |Y≤ α has the EWE distribution.
Figure 1. Plots of the EWE density function for fixed scale parameter λ = 1 and some selected shape parameters
Interpretation 3: Using the moment generating function (MGF) the
stochastic representation of X can be easily obtained. Suppose U and V are two independent variables with distributions exp(λ) and EE(λ(1 + α), αβ), respectively. Then it can be observed that if
X U V (6) then X has the density function (4).
Generation: All the above three interpretations can be used to generating
random numbers from EWE distribution. Note that the simplest way to generate EWE random number is to use the stochastic representation (6).
Statistical and Reliability Properties
If X ~ EWE(α, β, λ), then the MGF of X for any t < λ is given by
2 1 1 M 1 1 x t t t t
(7)By straightforward integration, the row moments of X about the origin are found to be
2 ! 1 1 1 E 1 1 r r r X
(8)In particular, mean and E(X 2) are given, respectively, by
1
3
1
2 E 1 1 X (9)
4 2 2 2 2 1 1 3 E 1 1 X
(10)The distribution function for the random variable X is given by
1 0 1 1 2 F ; , , 1 C , , e C , , e C , , e x x X x x x
(11) where
2 0 1 2 1 1 C , , , C , , , 1 1 1 C , , 1
Also, the survival function and hazard rate function (HRF) of X can be placed in the following compact forms respectively:
1 0 1 1 2 F ; , , C , , e C , , e C , , e x x X x x x
(12)
2 1 1 0 1 2 1 e 1 h C , , e C , , e C , , e x x X x x x x x x
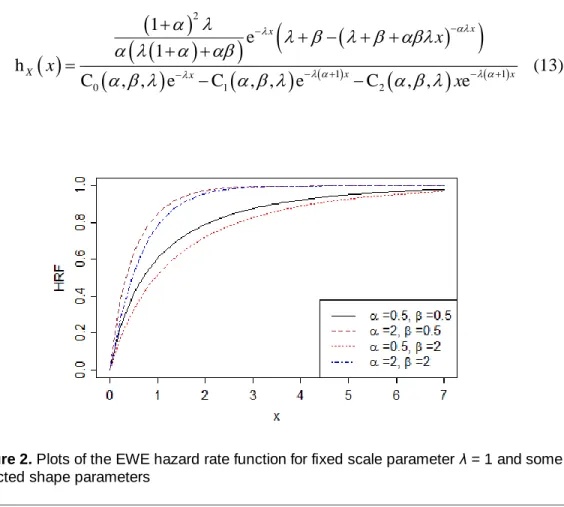
(13)Figure 2. Plots of the EWE hazard rate function for fixed scale parameter λ = 1 and some selected shape parameters
In Figure 2, the HRF of the EWE distribution is plotted for selected values
of the shape parameters and fixed scale parameter λ = 1. The HRF is an increasing function. The concept of an increasing failure rate is very attractive in an engineering context, where it has often been related to a mathematical representation of wear out (Marshall & Olkin, 2007).
One of the well-known properties of the life time distribution is mean residual life time. For the EWE distribution it can be written as
1 0 3 1 2 1 0 1 1 2 m E | C , , e C , , e 1 C , , e 1 1 C , , e C , , C , , t t t t t t t X t X t t e te
(14) where
3 1 2 C , , 1 1
.Maximum Likelihood Estimation
The MLEs will be derived for the unknown parameters of the EWE distribution from complete samples only.
Let X1,…, Xn be a random sample from GWE(α, β, λ). The log-likelihood function based on the observed sample {x1,…, xn} is
1 1 1 l , , | , , 2 ln 1 ln ln ln 1 ln i n n n x i i i i x x n n n n x x e
(15)To find the MLE estimates for the EWE model parameters, differentiate the log-likelihood function and equating the resulting expressions to 0 as follows:
2 2 1 1 1 e e l 2 0 1 1 e 1 1 e l 0 1 e 1 1 1 e 1 e l 1 i i i i i i i x x n i i x i i x n i x i i x x n i i i i i n x x n n x x n x n x x x n x
1 0 e i n x i xi
The MLEs of the unknown parameters cannot be obtained explicitly. They have to be obtained by solving some numerical methods, like the
Newton-Raphson method, Gauss-Newton method, or their variants. In this paper we use the optim function from the statistical software R (R Core Team, 2013) to estimate the unknown parameters.
Simulation
Some simulation results are presented to see how the maximum likelihood estimators behave for different sample sizes and for different parameter values. The sample sizes, namely n = 20, 40, 60, and 80 and two different sets of parameter values: Set 1: α = 0.5, λ = β = 1, and Set 2: β = 0.5, α = λ = 1. In each case, the maximum likelihood estimators of the unknown parameters are computed by maximizing the log-likelihood function (15). The average estimates and mean squared errors were computed over 1000 replications and the results are reported in Table 1. In all the cases the performances of the maximum likelihood estimates are quite satisfactory. As sample size increases the average estimates and the mean squared error decrease for all the parameters, as expected. It verifies the consistency properties of the MLEs.
Table 1. The average MLEs and the associated square root of the mean squared errors (within brackets) Set 1 Set 2 n α β λ α β λ 20 0.6143 1.1257 1.1014 1.1316 0.6013 1.1286 (0.0726) (0.0793) (0.0563) (0.0811) (0.0701) (0.0599) 40 0.5825 1.1094 1.0614 1.1105 0.5784 1.0742 (0.0592) (0.0696) (0.0352) (0.0713) (0.0501) (0.0431) 60 0.5675 1.0835 1.0452 1.0922 0.0553 1.0562 (0.0411) (0.0536) (0.0261) (0.0658) (0.0398) (0.0371) 80 0.5595 1.0658 1.0352 1.0715 0.5462 1.0402 (0.0388) (0.0414) (0.0201) (0.0456) (0.0321) (0.0245)
Data Analysis
Two real data sets are considered to demonstrate the performance of the proposed distribution in practice. For each data set, the results of the fitted proposed model are compared with the WE, TWE, and EE models. To see which one of these
Smirnov (K-S) distance between the empirical cumulative distribution function and the fitted distribution function was obtained in each case, as well as the associated p-value.
Data Set 1: Bjerkedal (1960) provided a data set consisting of survival times of
72 Guinea pigs injected with different amount of tubercle. We consider only the study in which animals in a single cage are under the same regimen. The data represents the survival times of Guinea pigs in days. The data are given below:
12 15 22 24 24 32 32 33 34 38 38 43 44 48 52 53 54 54 55 56 57 58 58 59 60 60 60 60 61 62 63 65 65 67 68 70 70 72 73 75 76 76 81 83 84 85 87 91 95 96 98 99 109 110 121 127 129 131 143 146 146 175 175 211 233 258 258 263 297 341 341 376
Table 2. The MLEs of parameters, AIC, and K-S statistics for the Guinea pigs data
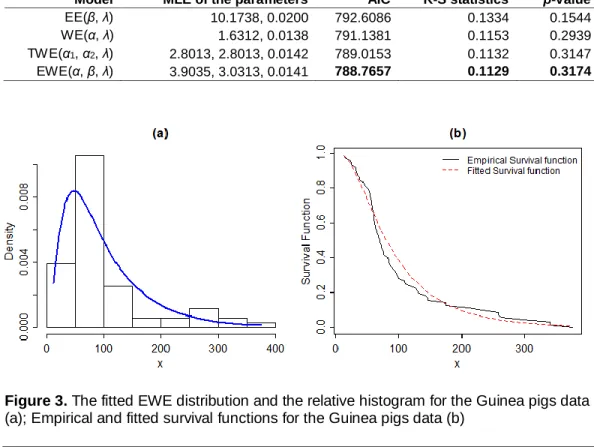
Model MLE of the parameters AIC K-S statistics p-value
EE(β, λ) 10.1738, 0.0200 792.6086 0.1334 0.1544
WE(α, λ) 1.6312, 0.0138 791.1381 0.1153 0.2939
TW E(α1, α2, λ) 2.8013, 2.8013, 0.0142 789.0153 0.1132 0.3147
EWE(α, β, λ) 3.9035, 3.0313, 0.0141 788.7657 0.1129 0.3174
Figure 3. The fitted EWE distribution and the relative histogram for the Guinea pigs data (a); Empirical and fitted survival functions for the Guinea pigs data (b)
Table 3. The MLEs of parameters, AIC, and K-S statistics for the melanoma data
Model MLE of the parameters AIC K-S statistics p-value
EE(β, λ) 4.1321, 0.0019 913.2957 0.1551 0.1158
WE(α, λ) 1.6197 ,0.0010 912.5643 0.0767 0.8651
TW E(α1, α2, λ) 0.0136 0.2099 0.0022 913.3586 0.0696 0.9271
EWE(α, β, λ) 0.0375, 0.1435, 0.0021 912.0859 0.0620 0.9710
It is clear from Table 2 that, based on the AIC value and also based on the K-S statistic, the proposed EWE model provides a better fit than the WE, TWE and EE models for this specific data set. The relative histogram and the fitted EWE distribution are plotted in Figure 3. In order to assess if the model is appropriate, the plots of the fitted EWE survival function and empirical survival function are displayed in Figure 3.
Data Set 2: This data set relates to survival time for 57 patients in Denmark
with malignant melanoma (Andersen, Borgan, Gill, & Keiding, 1993). The data are given below:
185 204 210 232 279 295 386 426 469 529 621 629 659 667 718 752 779 793 817 833 858 869 872 967 977 982 1041 1055 1062 1075 1156 1228 1252 1271 1312 1435 1506 1516 1548 1560 1584 1621 1667 1690 1726 1933 2061 2062
2103 2108 2256 2388 2467 2565 2782 3042 3338
The results are given in Table 3. The lowest values of the AIC and K-S test statistics are obtained for the EWE distribution. Based on these measures, the EWE is the best distribution among all those used here to fit the data set. In order to assess if the model is appropriate, the histogram of the data and the plot of the fitted EWE model are displayed inFigure 4.
Figure 4. The fitted EWE distribution and the relative histogram for the melanoma data (a); Empirical and fitted survival functions for melanoma data (b)
Conclusion
A new class of weighted distributions based on the extended exponential distribution were introduced. The proposed model contains the WE model as its submodel. It is shown that the distribution function, hazard function, and moment generating function can be obtained in closed form. The MLEs can be computed using numerical algorithms. The failure rate function of proposed distributions is an increasing function. The flexibility of the proposed distribution and increased range of skewness was able to fit and capture features in two real data sets much better than the WE and other popular distributions.
References
Andersen, P. K., Borgan, O., Gill, R. D., & Keiding, N. (1993). Statistical models based on counting processes. New York: Springer.
Arnold, B. C., & Beaver, R. J. (2000). The skew-Cauchy distribution. Statistics & Probability Letters, 49(3), 285-290. doi: 10.1016/S0167-7152(00)00059-6
Azzalini, A. (1985). A class of distributions which includes the normal ones.
Scandinavian Journal of Statistics, 12(2), 171-178. Available from
Balakrishnan, N., & Ambagaspitiya, R. (1994). On skew-Laplace distributions (Technical report). Hamilton, Ontario, Canada: Department of Mathematics and Statistics, McMaster University.
Bjerkedal, T. (1960). Acquisition of resistance in guinea pigs infected with different doses of virulent tubercle bacilli. American Journal of Hygiene, 72(1), 130-148.
Gómez, Y. M., Bolfarine, H., & Gómez, H. W. (2014). A new extension of the exponential distribution. Revista Colombiana de Estadística, 37(1), 25-34. doi: 10.15446/rce.v37n1.44355
Gupta, R. D., & Kundu, D. (2009). A new class of weighted exponential distributions. Statistics: A Journal of Theoretical and Applied Statistics, 43(6), 621-634. doi: 10.1080/02331880802605346
Marshall, A. W., & Olkin, I. (2007). Life distributions: Structure of nonparametric, semiparametric, and parametric families. New York: Springer.
Nadarajah, S. (2009). The skew logistic distribution. AStA Advances in Statistical Analysis, 93(2), 187-203. doi: 10.1007/s10182-009-0105-6
R Core Team. (2013). R: A language and environment for statistical computing [computer software]. Vienna, Austria: R Foundation for Statistical Computing.
Shakhatreh, M. K. (2012). A two-parameter of weighted exponential distributions. Statistics and Probability Letters, 82(2), 252-261. doi: