The Journal of Immunology
Defining GM-CSF– and Macrophage-CSF–Dependent
Macrophage Responses by In Vitro Models
Derek C. Lacey,
1Adrian Achuthan,
1Andrew J. Fleetwood, Hang Dinh, John Roiniotis,
Glen M. Scholz, Melody W. Chang, Sandra K. Beckman, Andrew D. Cook, and
John A. Hamilton
GM-CSF and M-CSF (CSF-1) induce different phenotypic changes in macrophage lineage populations. The nature, extent, and generality of these differences were assessed by comparing the responses to these CSFs, either alone or in combination, in various human and murine macrophage lineage populations. The differences between the respective global gene expression profiles of mac-rophages, derived from human monocytes by GM-CSF or M-CSF, were compared with the differences between the respective profiles for macrophages, derived from murine bone marrow cells by each CSF. Only 17% of genes regulated differently by these CSFs were common across the species. Whether a particular change in relative gene expression is by direct action of a CSF can be confounded by endogenous mediators, such as type I IFN, IL-10, and activin A. Time-dependent differences in cytokine gene ex-pression were noted in human monocytes treated with the CSFs; in this system, GM-CSF induced a more dramatic exex-pression of IFN-regulated factor 4 (IRF4) than of IRF5, whereas M-CSF induced IRF5 but not IRF4. In the presence of both CSFs, some evidence of “competition” at the level of gene expression was observed. Care needs to be exercised when drawing definitive conclusions from a particular in vitro system about the roles of GM-CSF and M-CSF in macrophage lineage biology. The
Journal of Immunology, 2012, 188: 000–000.
T
he CSFs, M-CSF (or CSF-1) and GM-CSF, were defined originally as hemopoietic growth factors (1). M-CSF is ubiquitously produced by many tissues and controls macrophage numbers in many tissues (2, 3). However, GM-CSF has low basal circulating levels that are often elevated during immune/inflammatory reactions (4); recent evidence implicates it in the development of a type of dendritic cell (DC), namely, the “monocyte-derived” or “inflammatory” DC (5, 6). These CSFs have different receptors and downstream signaling pathways, and their receptors are distributed differently on myeloid cell pop-ulations (7). One common responding cell lineage is the macro-phage with both CSFs capable of promoting cell survival/pro-liferation, differentiation, and activation (8, 9). Partly because of their involvement in macrophage and/or DC biology, M-CSF and GM-CSF have been implicated in inflammatory/autoimmune conditions because their blockade or that of their receptors canlead to disease alleviation in arthritis and many other indications (7), prompting heightened interest in their biology.
Macrophage lineage populations respond differently to M-CSF and GM-CSF (7, 10–13), although the nature of the differences is still not clear nor have the responsible mechanisms been eluci-dated. In vitro systems have been developed to attempt to un-derstand CSF-dependent macrophage biology at the molecular level; as an example, many studies have highlighted the ability of GM-CSF to induce cells with DC (antigen-presenting) properties (5, 6, 14, 15). Because macrophages at a site of inflammation could be exposed to both M-CSF and GM-CSF (7, 16), a limited number of studies have included both CSFs in the cultures to at-tempt to mimic this situation (11, 17–21). With this approach, some evidence has been obtained even for opposing actions of the CSFs, and M-CSF has been proposed to be attempting to restore the macrophage target population to a steady-state as a mechanism for inflammatory reaction resolution (7, 21).
M-CSF–treated human blood monocytes are often used to gen-erate, following differentiation, monocyte-derived macrophages (MDM) as a model for tissue macrophages (10, 13, 22, 23). GM-CSF–treated monocytes are widely used as a model system for DC development and function, although bioinformatics analysis of their transcriptome indicates that they are closer to macrophages than to DCs (24, 25); they will therefore be referred to here as GM-CSF monocyte-derived macrophages (GM-MDM). Macro-phage functions have begun to be defined by different polarization or activation states to define them more clearly. One such cate-gorization is M1 and M2 polarization, with the former state (classical activation) resulting from the action of stimuli, such as IFN-g, in the absence or presence of a microbial agent such as LPS, and the latter (alternative activation) after stimulation with IL-4 or IL-13 (26–29). Based mainly on expression of certain cytokines, the population resulting from GM-CSF treatment of human monocytes has been referred to as Mw-1 macrophages with a “proinflammatory” cytokine profile and with some features of Department of Medicine, Arthritis and Inflammation Research Centre, University of
Melbourne, The Royal Melbourne Hospital, Parkville, Victoria 3050, Australia
1D.C.L. and A.A. contributed equally to this work.
Received for publication December 1, 2011. Accepted for publication April 2, 2012. This work was supported by grants and a Senior Principal Research Fellowship (to J.A.H.) from the National Health and Medical Research Council of Australia. The microarray data presented in this article have been submitted to ArrayExpress Archive (http://www.ebi.ac.uk/arrayexpress/) under accession numbers E-MTAB-790, E-MTAB-791, and E-MTAB-792.
Address correspondence and reprint requests to Prof. John Hamilton, Arthritis and Inflammation Research Centre, University of Melbourne, Department of Medicine, The Royal Melbourne Hospital, Parkville, VIC 3050, Australia. E-mail address: [email protected]
The online version of this article contains supplemental material.
Abbreviations used in this article: BMM, bone marrow-derived macrophage; GM-BMM, GM-CSF bone marrow-derived macrophage; GM-MDM, GM-CSF monocyte-derived macrophage; GO, Gene Ontology; IGF, insulin-like growth factor; IRF, IFN-regulated factor; MDM, monocyte-derived macrophage; qPCR, quantitative PCR. CopyrightÓ2012 by The American Association of Immunologists, Inc. 0022-1767/12/$16.00
M1 cells, with the M-CSF–generated counterparts being termed Mw-2, with an “anti-inflammatory” cytokine repertoire and with some features of M2 macrophages (13). Along these lines, it has been reported that MDM express a substantial repertoire of the M2 transcriptome (22), and for murine bone marrow-derived macro-phages (BMM), the differences from M1 and M2 macromacro-phages have been mentioned (30, 31). Recently, the transcription factor, IFN-regulated factor (IRF5), was proposed to be key for the GM-CSF–induced M1 polarization in human monocytes (32).
In the mouse, BMM, derived from bone marrow cells cultured in M-CSF are a frequently used and convenient population to study macrophage function and signaling (33). GM-CSF–treated bone marrow cells, in contrast, give rise to cells used as a model for DCs, although they have macrophage markers (11), are excellent osteoclast precursors (17), and have a transcriptome closer to macrophages than to DCs (31); for this reason, we shall continue, as before (11, 34), to refer to them as GM-CSF bone marrow-derived macrophages (GM-BMM). We recently showed by micro-array analysis that endogenous type I IFN can have a profound influence on the transcriptomes of GM-BMM and BMM, partic-ularly for the latter (34). Based solely on cytokine expression, we also showed that GM-BMM and BMM have some properties similar to M1 and M2 cells, and thus termed their phenotypes as “M1-like” and “M2-like,” respectively (11). IRF5 has also been implicated in the M1 polarization attributed to GM-BMM (32).
What is needed is a comparative analysis of M-CSF– and GM-CSF–treated human and murine macrophage populations in the one study to gain some idea ultimately of their potential relevance as models for the function of these CSFs in human macrophage biology and pathology, in particular, inflammatory diseases. Ex-pression data for such populations were analyzed and are com-pared later. We also describe a number of factors that need to be considered when defining the respective CSF responses in mac-rophage lineage populations.
Materials and Methods
MiceFemale C57BL/6 mice (8–12 wk) were from Monash University, Clayton, VIC, Australia, and IL-102/2mice were a gift from N. O’Brien-Simpson (The University of Melbourne, Parkville, VIC, Australia). All experiments were approved by the Royal Melbourne Hospital Research Foundation Animal Ethics Committee.
Reagents and Abs
Reagents included recombinant murine GM-CSF (PeproTech, Princeton, NJ), human GM-CSF (R&D Systems, Minneapolis, MN) and human M-CSF (Chiron, Emeryville, CA), and LPS (Sigma-Aldrich, St. Louis, MO); mono-clonal Abs were against IRF4 and IRF5 (Cell Signaling Technology, Danvers, MA), IL-10 and activin A (R&D Systems),b-tubulin (Sigma-Aldrich), and CD14 PerCP-Cy5.5 and isotype control (eBioscience, San Diego, CA). Isolation and culture of human monocytes
Human monocytes were purified from buffy coats (Red Cross Blood Bank, Melbourne, VIC, Australia), using RosetteSep Ab mixture (Stem Cell Technologies, Vancouver, BC, Canada), which negatively selects CD14+monocytes, followed by Ficoll-Paque density gradient
centrifuga-tion (23). They were cultured in RPMI 1640, supplemented with 10% heat-inactivated FCS (CSL Biosciences, Parkville, VIC, Australia), 2 mM GlutaMax-1 (Invitrogen, Carlsbad, CA), 100 U/ml penicillin, and 100mg/ ml streptomycin, and stimulated with M-CSF (2500 U/ml), human GM-CSF (5 ng/ml), or both, for appropriate time periods, or cultured for 7 d in M-CSF to differentiate them into MDM (23) or in GM-CSF to differentiate them into GM-MDM, or in both CSFs to differentiate them into (M-CSF + GM-CSF)-MDM.
Isolation and culture of bone marrow cells
BMM and GM-BMM were prepared as previously described (11). In brief, bone marrow cells were isolated from femurs of mice and cultured in
RPMI 1640 medium, supplemented with 10% heat-inactivated FCS, 2 mM GlutaMax-1, 100 U/ml penicillin, and 100 mg/ml streptomycin in the presence of M-CSF (2500 U/ml) or murine GM-CSF (5 ng/ml). At day 4, nonadherent cells were collected and cultured for a further 3 d in M-CSF (2500 U/ml) to derive BMM or in GM-CSF (5 ng/ml) to derive GM-BMM. On day 7, adherent cells were harvested.
Microarray experiments
All microarray experiments were performed following recommended protocols supplied by Agilent Technologies (Santa Clara, CA). RNA was isolated from three independent donors (23). cRNA was hybridized to a whole human genome microarray (Agilent Technologies) containing 43,376 probes corresponding to 41,264 transcripts. Microarrays were then scanned using a DNA microarray scanner, Model G2565A; data extraction was conducted using Feature Extraction software Version 10.5 and then analyzed using Genespring GX software, Version 11.5.1 (Agilent Tech-nologies). Normalization was performed according to the Agilent Feature Extraction One-Color Protocol. Filtering was applied, whereby probes that were considered “present” in at least 6 of the 9 samples were included, generating a list of 23,672 genes. Genes were analyzed by a Welchttest, and differences between groups were determined using Tukey’s honest significant difference post hoc test and Benjamini–Hochberg multiple testing correction. Genes showing.2-fold differences and statistical sig-nificance with a false discovery rate of 0.05 were identified as being dif-ferentially expressed, and these were subjected to Gene Ontology (GO) analysis for biological process and molecular function at levels 3 and 4 (35). Significant ontologies were calculated using a Fisher exact test, andp values#0.05 are reported. The data set and technical information com-pliant with minimum information about a microarray experiment (35) can again be found at the ArrayExpress Archive Web site (http://www.ebi.ac. uk/arrayexpress/; accession number E-MTAB-791).
Similarly, RNA from BMM and BMM or BMM, treated with GM-CSF, GM-CSF and M-GM-CSF, or M-CSF alone for 16 h, were processed as described earlier. cRNA was hybridized to a whole murine genome microarray (Agilent Technologies) containing 45,220 probes corresponding to 41,543 transcripts. Microarrays were then scanned, data extracted, and analyzed similarly to earlier description. Filtering was applied, whereby probes that were considered “present” in at least 100% of samples in any one of the conditions were included, generating a list of 20,873 entities. Genes were considered to be significantly different after a pairedttest, with a correctedpvalue#0.05, using Benjamini–Hochberg for multiple testing correction (11,620 entities). Genes showing.2-fold differences and statistical significance with a false discovery rate of #0.05 were identified as being differentially expressed (4206 entities), and these genes were subjected to GO analysis as described earlier. Significant ontologies andpvalues were as described earlier. The data set and minimum infor-mation about a microarray experiment compliance (35) can again be found at the ArrayExpress Archive Web site (http://www.ebi.ac.uk/arrayexpress/; accession numbers E-MTAB-790 and E-MTAB-792).
Quantitative PCR
Total RNA was extracted using RNeasy mini-kits (Qiagen, Valencia, CA) and reverse transcribed using SuperScript III reverse transcriptase (Invi-trogen). Quantitative PCR (qPCR) was performed using an ABI PRISM 7900HT sequence detection system (Applied Biosystems, Carlsbad, CA) and predeveloped TaqMan probe/primer combinations for human and for murine TNF, IL-1b, IL-6, IL-8, IL-10, IL-12p35, IL-12p40, IL-23p19, CCL2, CCL5, CCL12, CCL17, CXCL10, TGF-b, insulin-like growth factor 1 (IGF-1), INHBA (activin A), UBC, and 18S rRNA (Applied Biosystems) (11, 34). Custom-designed primer sequences were used for IRF4 and IRF5, STAT1 and STAT2, and UBC using SYBR Green. All samples were performed in triplicates. Threshold cycle numbers were transformed toΔΔcycle threshold values, and the results were expressed
relative to reference genes 18S rRNA or UBC. Cell lysis and Western blotting
Whole-cell extracts were lysed and Western blotted as described previously (34). Protein concentrations of the samples were determined with a Bio-Rad protein assay kit. The whole-cell lysates were run on 10% SDS-PAGE (Invitrogen). The separated proteins were transferred onto a polyvinylidene fluoride membrane and then Western blotted with appropriate Abs. Secreted cytokines
Cytokines in cell supernatants were measured by ELISA (OptEIA ELISA kits; BD Pharmingen, Franklin Lakes, NJ).
Statistics
Statistical comparisons between groups were performed using unpaired Studentttest (GraphPad Prism 4 software) or Wilcoxon matched pairs test (STATISTICA 5.1 software). Thep values#0.05 indicate significance. Data were plotted using GraphPad Prism 4.03 software.
Results
Human and murine macrophage gene expression profiles on differentiation in GM-CSF or M-CSF
We compared at the global level the relative gene expression for human and murine macrophage populations generated in the presence of GM-CSF or M-CSF.
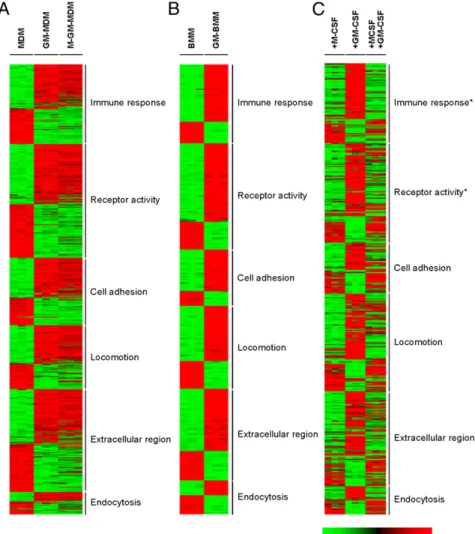
Human cells.We first compared gene expression profiles for human monocytes after their differentiation into GM-MDM or MDM over a period of 7 d. In total, 23,672 genes were present after detection call and spot assessment analysis (seeMaterials and Methods). From 3 experiments, 87% of the genes were similarly expressed (i.e., ratio , 2-fold change) between both macrophage pop-ulations. The remaining genes (3044), whose relative expression was different (i.e.,p#0.05 and ratio$2-fold change; the top 100 genes collated in Supplemental Table I), were categorized on the basis of GO classification and certain key macrophage functions as before for MDM (23), such as immune response and endocy-tosis. The data are presented as a GO “heat map” (Fig. 1A); the relative numbers of genes upregulated in these categories are shown (Fig. 2A). As examples, there were more genes annotated to the classifications, immune response and extracellular region,
that were expressed in GM-MDM more highly than in MDM. The 10 most relatively regulated genes in the categories selected are presented in Table I. The overall concordance of the patterns between different donors can be noted in Fig. 1A. The profile obtained in the presence of both CSFs is discussed later. Murine cells. We assessed the relative gene expression profiles for GM-BMM versus BMM by microarray, and the data were ar-ranged in the same GO categorization as described earlier. From 3 experiments, 80% of genes (16,667 of 20,873) were similarly expressed (i.e., ratio , 2-fold change) between GM-BMM and BMM. For the remaining genes whose expression was differen-tially expressed (i.e.,p#0.05 and ratio$2-fold change; the top 100 genes collated in Supplemental Table I), the GO “heat map” (Fig. 1B) and the relative numbers of genes upregulated in the chosen categories (Fig. 2B) are again shown. As examples, there were more genes annotated to the GO classifications, immune response and extracellular region, that were more highly expressed in GM-BMM than in BMM, as for the respective human pop-ulations. Again, the 10 most relatively regulated genes in the categories selected are listed (Table II).
Human versus murine cells.Given that the respective human and murine cell populations analyzed earlier are widely used in vitro models for studying CSF biology, as well as the biology of macrophages and DCs, it is important to determine how these in vitro macrophage models compare across species, especially because their sources are quite different.
FIGURE 1. GO analysis of differentially ex-pressed genes for M-CSF– and GM-CSF–differ-entiated human and murine macrophages. (A) MDM, GM-MDM, and (M-CSF + GM-CSF)-MDM; (B) BMM and GM-BMM; and (C) BMM were starved for 24 h and then treated with M-CSF, GM-M-CSF, or both for 16 h. Data mining was perMaterials and Methods. (AandB) Shown are six significant and nonredundant classifications at levels 3 and 4 for biological process and molec-ular function. (C) Asterisk indicates immune re-sponse and receptor activity were the only GO categories of these six that were significant. All data are representative of three independent ex-periments.
As mentioned earlier and as can be seen from Figs. 1, 2A, and 2B, the relative pattern for the different biological processes was similar between the respective human and murine CSF-treated populations; however, it should be noted (Table I versus Table II; Supplemental Table I) that the differently expressed genes within each species were not the same, and for those that were the extent of their regulation (i.e., relative fold change) were often not comparable.
Therefore, we next analyzed further the similarities and dif-ferences between the human and murine macrophage populations by first comparing in detail individual differentially regulated genes, the global GO categories, and the molecular pathways activated. Of the 4206 genes differentially regulated between the murine GM-BMM and BMM, 3045 (72%) had human homologs, which we compared with the genes differentially regulated between GM-MDM versus MDM. There were 812 of these genes that were common in both species, with 530 of this common list regulated in the same direction in both human and murine populations (Fig. 2C). Thus, overall, only 17% of the genes regulated differently by these CSFs and in the same direction are common between the human and murine macrophage systems. For the top 150 genes most differentially regulated in the same direction between GM-MDM versus GM-MDM and GM-BMM versus BMM, there were only 11 common to both species.
When the human and murine gene lists were compared at the level of GO categories (36), there were 106 relatively regulated in
a similar manner by the CSFs across both species (false recovery rate,p#0.05), which represents 41 and 34% of the total cate-gories regulated differently by the CSFs within the human and murine macrophages, respectively (data not shown). However, when the GO categories were ranked, of the 50 GO categories that were differentially regulated the most (i.e., lowestpvalue), 84% were similar across the species. Thus, when a higher level of stringency is applied to the GO classification, a greater degree of similarity is observed. We next conducted a “pathway” analysis using two pathway databases, namely, National Cancer Institute-Nature and BioCarta. Using this approach, of the pathways dif-ferentially regulated by the CSFs in the same direction, 82% of the human and 77% of the murine, respectively, were common across the species; the top 50 such “pathways” for each species are listed in Supplemental Table II using the NCI-Nature database.
The findings from the three approaches used earlier to compare the relative gene expression for the respective CSF-generated mac-rophage populations between species indicate that when cell func-tion is considered, that is, using GO classificafunc-tion and “pathway” analysis rather than individual gene expression, more overlap results.
Contribution of endogenous type I IFN to CSF-induced macrophage polarization
We showed before with GM-BMM and BMM that endogenous type I IFN had a profound effect on basal gene expression, par-FIGURE 2. Number of differentially expressed
genes (GO analysis) for M-CSF– and GM-CSF– differentiated human and murine macrophages. (A) MDM and GM-MDM; (B) BMM and GM-BMM. Data mining was per Materials and Methods. Shown is the number of genes upregulated by M-CSF or GM-M-CSF in the six significant and nonre-dundant GO classifications at levels 3 and 4 for biological process and molecular function (see Fig. 1A, 1B). (C) Venn diagram showing the number of genes differentially regulated in only human cells, only murine cells, or cells from both species. All data are representative of three independent experi-ments
ticularly for the latter with its high endogenous levels (34). We now examined how many of these type I IFN genes were in the list of genes that were differentially expressed in GM-BMM and BMM as an indication of the possible contribution of endogenous type I
IFN to this difference. Of the total of 569 validated genes that were different in both IFNAR2/2GM-BMM and BMM from their corresponding wild-type populations, that is, type I IFN dependent (34), 333 of them were also differentially expressed in GM-BMM Table I. The top 10 most differentially expressed genes in GM-MDM versus MDM for each GO category
Gene Symbol Description
Fold Change: GM versus M Immune response
CYP27B1 Cytochrome P450, family 27, subfamily B, polypeptide 1 47.2
CD226 CD226 molecule 11.9
CTSW Cathepsin W 10.5
CCL22 Chemokine (C-C motif) ligand 22 9.7 BNIP3 BCL2/adenovirus E1B 19-kDa interacting protein 3 210.0
IL10 IL-10 210.5
CADM1 Cell adhesion molecule 1 211.8 SECTM1 Secreted and transmembrane 1 215.3
THBS1 Thrombospondin 1 216.2
CD28 CD28 molecule 240.6
Receptor activity
TACSTD2 Tumor-associated calcium signal transducer 2 71.8 CCR6 Chemokine (C-C motif) receptor 6 39.4 GUCY1B3 Guanylate cyclase 1, soluble,b3 32.1
IL22RA2 IL-22Ra2 30.9
IL3RA IL-3Ra 26.3
GPR114 G protein-coupled receptor 114 20.3 GP1BA Glycoprotein Ib (platelet),apolypeptide 17.2 TNFRSF8 TNFR superfamily, member 8 217.3 ALK Anaplastic lymphoma kinase 221.1 EDG1 Endothelial differentiation G protein-coupled receptor 1 228.2 Cell adhesion
CLDN14 Claudin 14 25.2
SORBS1 Sorbin and SH3 domain containing 1 22.2
CDH17 Cadherin 17 15.7
PTPRF Protein tyrosine phosphatase, receptor type, F 14.4 PTPRK Protein tyrosine phosphatase, receptor type, K 13.6
RND3 Rho family GTPase 3 212.5
FBLN5 Fibulin 5 219.0
NRG1 Neuregulin 1 221.5
CD93 CD93 molecule 240.4
DLL1 d-like 1 2119.8
Locomotion
IGFBP5 Insulin-like growth factor binding protein 5 31.4
EDN1 Endothelin 1 28.3
CCL24 Chemokine (C-C motif) ligand 24 28.1
CSF1 CSF1 21.4
PDGFRB Platelet-derived growth factor receptor,bpolypeptide 12.8 CCL5 Chemokine (C-C motif) ligand 5 12.8
F3 Coagulation factor III 11.3
CXCR4 Chemokine (C-X-C motif) receptor 4 218.6 EDNRB Endothelin receptor type B 253.7 IGF1 Insulin-like growth factor 1 256.0 Extracellular region
CCL1 Chemokine (C-C motif) ligand 1 129.2
INHBA Inhibin,bA 112.0
IGFBP2 Insulin-like growth factor binding protein 2 17.7
IL1A IL-1a 16.6
FLT1 fms-related tyrosine kinase 1 14.6
PRG2 Proteoglycan 2 13.8
PRSSL1 Protease, serine-like 1 13.0
DKK2 Dickkopf homolog 2 12.9
CFD Complement factor D 218.6
LOXL1 Lysyl oxidase-like 1 222.2
Endocytosis
ADORA1 Adenosine A1 receptor 7.7
SFTPD Surfactant, pulmonary-associated protein D 5.2
GATA2 GATA binding protein 2 4.7
PDLIM7 PDZ and LIM domain 7 4.6
LDLRAP1 Low-density lipoprotein receptor adaptor protein 1 4.6
FOLR1 Folate receptor 1 3.9
CAV1 Caveolin 1 3.5
ADRB2 Adrenergic,b-2-, receptor 23.4 MSR1 Macrophage scavenger receptor 1 24.1 ITSN1 Intersectin-1 (SH3 domain-containing protein 1A) 26.0
and BMM (the top 50 genes are collated in Table III). These data suggest that endogenous type I IFN can also contribute signifi-cantly to the gene expression differences between GM-BMM and BMM. In the human cells, it was found that the expression of 154
of these type I IFN-regulated genes (34) were also different be-tween GM-MDM and MDM (the top 50 genes are collated in Table III), suggesting that type I IFN may also be contributing to this difference as in the mouse. There were 104 type I IFN-Table II. The top 10 most differentially expressed genes in GM-BMM versus BMM for each GO category
Gene Symbol Description
Fold Change: GM-BMM versus BMM Immune response
Ccr7 Chemokine (C-C motif) receptor 7 4905.4
Thy1 Thymus cell Ag 1,u 341.2
Cacnb3 Calcium channel voltage-dependent,b3 236.1
Ciita CIITA 226.7
Cfb Complement factor B 215.1
Lta Lymphotoxin A 108.5
H2-Ab1 Histocompatibility 2 class II Ag Ab1 106.8 Tnfsf4 TNF (ligand) superfamily, member 4 86.2 Cfh Complement component factor h 263.6 Cx3cr1 Chemokine (C-X3-C) receptor 1 2128.2 Receptor activity
Adra2a Adrenergic receptor,a2a 1006.0 Klrb1b Killer cell lectin-like receptor subfamily B member 1B 764.5 Gpr120 G protein-coupled receptor 120 417.2 Ramp3 Receptor activity modifying protein 3 352.2
Il28ra IL-28Ra 330.9
Pglyrp1 Peptidoglycan recognition protein 1 209.8
Cd200r3 CD200 receptor 3 185.9
Olr1 Oxidized low-density lipoprotein receptor 1 181.3
Il1r1 IL-1R, type I 151.1
Il1rl2 IL-1R-like 2 137.4
Cell adhesion
Cldn1 Claudin 1 213.2
Cdh1 Cadherin 1 154.9
Ddr1 Cak receptor kinase 137.5
Pkp2 Plakophilin 2 96.1
Clec7a C-type lectin domain family 7, member a 41.8
Vcam1 VCAM 1 40.4
Itga1 Integrina1 32.1
Itga6 Integrina6 220.3
Cadm1 Cell adhesion molecule 1 276.8
S1pr1 Sphingosine-1–phosphate receptor 1 299.8 Locomotion
Ear3 Eosinophil-associated, RNase A family, member 3 771.8 Ccl17 Chemokine (C-C motif) ligand 17 380.8 Cxcl3 Chemokine (C-X-C motif) ligand 3 139.7 Six1 Sine oculis-related homeobox 1 homolog 101.3
Pdpn Podoplanin 67.9
Cxcr2 Chemokine (C-X-C motif) receptor 2 63.5
Mmp14 Matrix metallopeptidase 14 62.7
Met Met protooncogene 62.0
Gja1 Gap junction protein,a1 263.4
Cspg4 Chondroitin sulfate proteoglycan 4 267.7 Extracellular region
Ccdc80 Coiled-coil domain containing 80 490.9
Prss34 Protease, serine, 34 452.4
Edn1 Endothelin 1 300.1
Rbp4 Retinol binding protein 4, plasma 192.1 Klk1b21 Kallikrein 1-related peptidase b21 160.9
Il1b IL-1b 133.1
Klk8 Kallikrein related-peptidase 8 61.6
Gata2 GATA binding protein 2 60.0
Timp3 Tissue inhibitor of metalloproteinase 3 53.9 Col18a1 Collagen, type XVIII,a1 265.8 Endocytosis
Ptx3 Pentraxin-related gene 767.7
Pacsin1 Protein kinase C and casein kinase substrate in neurons 1 107.7
Snph Syntaphilin 104.9
Cav1 Caveolin 1 37.9
C3 Complement component 3 26.0
Hip1r Huntingtin interacting protein 1 related 17.7
Cd24a CD24a Ag 11.5
Cd209b CD209b Ag 11.4
Syp Synaptophysin 211.2
regulated genes common between human and murine, 71 of which were regulated in the same direction in both human and murine populations.
IRFs and CSF-induced macrophage polarization
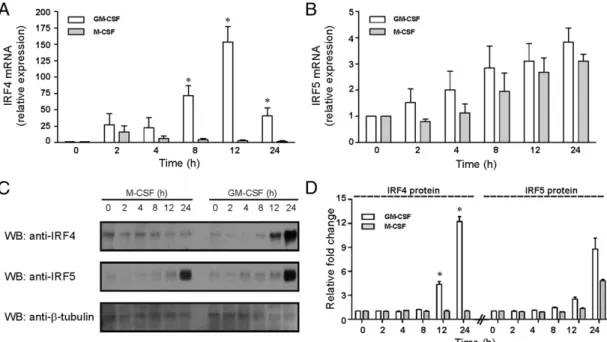
The IRF family of transcription factors is important in controlling type I IFN cellular responses, as well as its synthesis. Of particular relevance to CSF biology, it was recently suggested that IRF5 has a critical role in GM-CSF–driven M1 macrophage polarization (32), whereas IRF4 has been implicated in M-CSF–dependent M2 polarization (37). When relative IRF expression was monitored in GM-MDM versus MDM by microarray analysis, we found, however, that IRF5 was no higher, whereas IRF4 was 4-fold
higher. Another IRF member, namely, IRF7, was 2-fold lower. In GM-BMM versus BMM, similar findings were made with regard to the relative mRNA expression of IRF5 (2-fold higher), IRF4 (44-fold higher), and IRF7 (8-fold lower), the data for IRF7 mRNA being consistent with prior qPCR results (34). For IRF7 mRNA, these differences were modulated by endogenous type I IFN, as judged by comparing the differences found between wild-type GM-BMM and BMM with those found between their cor-responding INFAR2/2counterparts (34).
As part of the study implicating IRF5 in M1 macrophage po-larization, it was reported that for human monocytes treated with GM-CSF over a time course of 48 h, GM-CSF stimulated IRF5 mRNA and protein expression, but not those of IRF4 (32). Given our microarray findings earlier in both the human and murine systems, in particular, the strong relative IRF4 expression in GM-CSF–derived populations, we carried out a similar time course. In contrast with Krausgruber et al. (32), in our hands, GM-CSF stimulated IRF4 mRNA much more strongly than IRF5 mRNA with only a trend toward an increase being observed for the latter (Fig. 3A, 3B); protein levels increased for both IRFs (Fig. 3C, 3D). Also, in contrast with the literature (32, 38) and with GM-CSF action, M-GM-CSF did not induce IRF4, although it enhanced expression of IRF5 to a similar extent as GM-CSF. These data are consistent with our earlier microarray data for the relative gene expression of IRF5 and IRF4 in the CSF-differentiated pop-ulations. In the time-course experiment whose data are provided in Fig. 3, neither CSF enhanced IRF3 and IRF6 mRNA expression nor that of the STAT transcription factors implicated in IFN function, namely, STAT1 and STAT2 (data not shown).
Cytokine gene expression changes in GM-CSF– and M-CSF–treated human monocytes
Relative gene expression.For the murine GM-BMM and BMM, we previously showed that there was a different relative cytokine expression profile, with the former, as a generalization, expressing higher levels of proinflammatory cytokines (e.g., TNF, IL-12, and IL-23), whereas the reverse was true for the anti-inflammatory cytokine, IL-10 (11, 34). In GM-MDM versus MDM, when rel-ative basal gene expression of TNF, IL-1b, IL-12p35, IL-12p40, IL-23p19, IL-10, CCL2, and IL-8 were examined by qPCR, the only statistically significant difference observed was for higher IL-10 mRNA and CCL2 mRNA in MDM (Fig. 4A). It can also be noted that, apart from IL-10 and CCL2 mRNA expression in MDM, when the values for cytokine gene expression were com-pared with those in the starting monocytes, they were either similar or lower in both CSF-differentiated macrophage popula-tions.
Effect of endogenous IL-10 and activin A.In both GM-MDM and MDM, secreted cytokine levels are often quite low or undetectable unless given another stimulus, such as LPS (13, 39). Data for TNF and IL-10 are presented in Fig. 4B. It can be observed that se-creted TNF is not detectable unless LPS is given (GM-MDM. MDM), whereas IL-10 is found in untreated MDM but not in GM-MDM unless LPS is added.
It is possible that endogenous IL-10 could be contributing to the time-dependent changes in the human cells particularly for M-CSF–treated human monocytes (40, 41). We see in Fig. 5A evidence for a contribution of endogenous IL-10 to cytokine gene expression with neutralizing anti–IL-10 Ab increasing mRNA levels for IL-12 p40, IL-23 p19, and IL-10, with a trend toward increased TNF mRNA expression for human monocytes treated with M-CSF for only 16 h. As regards the mouse, for BMM, evidence that such endogenous IL-10 (42), possibly controlled, in turn, by endogenous type I IFN (34, 43), can contribute to the Table III. Top 50 type I IFN-dependent genes differentially expressed
between human GM-MDM versus MDM and murine GM-BMM versus BMM Human Murine Gene Symbol Fold Change: GM-MDM versus MDM Gene Symbol Fold Change: GM-BMM versus BMM SERPINB2 2354.7 Epx 1320.6 MAOB 85.3 Klrb1b 764.5 EDNRB 253.7 Prss34 452.4 COL23A1 252.3 Flrt3 379.4 FCGBP 250.1 Prg2 378.4 LGMN 242.2 Ramp3 352.2 P2RY14 30.8 Klk1b27 315.9 CH25H 29.1 Arg2 278.9 CCL24 28.1 Serpina3g 264.8 SMPD3 27.9 Pglyrp1 209.8 GPRC5B 223.4 Prg3 203.8 CSF1 21.4 Ffar2 193.5 PACSIN1 21.0 Dnahc2 192.8 PLXDC1 219.8 Gpr68 192.2 FBLN5 219.0 Cxcl14 2187.1 RAP1GAP 18.4 Itgb2l 186.1 CDKN1C 215.5 Camp 184.6 F13A1 215.1 Pla1a 156.7 STAB1 214.9 Chi3l1 153.7 SPIB 14.9 Ltf 144.1 FLT1 14.6 Lrg1 132.3 MS4A3 14.0 Lcn2 130.8 PRG2 13.8 Klrk1 118.5 PRSSL1 13.0 Cd200 117.6 GGTLA1 12.9 Egfbp2 115.4 CCL5 12.8 Pacsin1 107.7 PRSS22 12.4 Slco2b1 2107.5 TAGLN3 11.9 Hpgd 2106.5 MMP10 11.5 Dapk2 97.6 NFE2 11.4 Pkp2 96.1 ITGA2B 11.4 Klk1b4 94.0 RGL1 211.4 Ccl5 93.2 TMEM119 211.2 S100a8 88.9 CD69 11.0 Itga8 287.5 CORO2B 10.7 Cttn 72.6 GP1BB 10.0 Dppa3 270.0 CTSG 9.5 Ctla2b 268.6 HPGD 9.5 Ngp 67.9 CAMP 9.2 Cspg4 267.7 EPX 9.1 Cfh 263.6 DPP4 29.1 Klk8 61.6 IGFBP6 9.1 Hdc 59.3 SDC3 29.0 Stab1 257.4 SIGLEC1 28.7 Lipg 56.7 TLR7 27.4 Sema6d 56.6 OLFML3 27.3 Spib 54.3 GEM 7.2 Dach1 54.3 SOCS1 7.0 Chi3l4 50.0 GPC4 7.0 Tuba8 49.2 CDKN2A 7.0 Dpp4 48.7
control of expression of certain cytokines is provided in Fig. 5B and 5C, respectively, by comparing unstimulated and LPS-stimulated wild-type and IL-102/2cells. At the mRNA level for unstimulated macrophages and for the secreted protein in LPS-stimulated macrophages, IL-102/2BMM had higher expression of TNF, IL-6, IL-12, and IL-23. Such effects were not observed in GM-BMM (data not shown).
Table I shows that the gene for INHBA, which codes for the inhibinbA subunit of activin A, is one of the most differentially regulated genes between GM-MDM and MDM, with a fold-change for GM-MDM versus MDM of 112 (Table I). Recently, it was found that neutralizing anti-activin A Ab inhibited the ac-quisition of M1 markers by GM-CSF–treated human monocytes (i.e., GM-MDM) as part of the evidence for the proposition that activin A contributes to the “proinflammatory” macrophage po-larization triggered by GM-CSF and limits the acquisition of the “anti-inflammatory” phenotype (12). In Fig. 5D, we show that GM-CSF stimulates inhibinbA (activin A) mRNA dramatically in human monocytes with higher levels at 16 h than at 7 d (i.e., GM-MDM). Consistent with the data by Sierra-Filardi et al. (12), in-clusion of neutralizing anti-activin A Ab throughout the genera-tion of GM-MDM elevated IL-10 and IGF-1 mRNA levels, indicating that there is a significant downregulation of their ex-pression by endogenous activin A even in the absence of a second stimulus. A slight decrease in the “proinflammatory” IL-12 p35 mRNA can also be noted.
Time-dependent changes in cytokine gene expression. Because cells in the long-term (7 d) cultures used to generate our macro-phage populations may be subjected to feedback regulation over time by accumulating mediators, such as type I IFN, IL-10, and activin A, we examined cytokine gene expression of human monocytes treated with GM-CSF and M-CSF at earlier time points. First, we see that at 16 h, GM-CSF induced more TNF, IL-12p40, IL-23p19, and IL-8 mRNA (Fig. 4C) than CSF did, whereas
M-CSF did likewise for IL-10 and CCL2 mRNA (Fig. 4C), with there being little relative difference in the response to each CSF for IL-12p35 mRNA (there was a trend toward increased relative IL-1bmRNA for GM-CSF–treated monocytes). Second, during a time course over 24 h, for TNF, IL-1b, IL-12p40, and IL-23p19 mRNA, higher levels are expressed in GM-CSF–treated mono-cytes than in M-CSF–treated cells, with the opposite result ob-tained again for IL-10 mRNA (Fig. 6). Thus, the time point chosen for the CSF treatment of human monocytes can markedly deter-mine the relative gene expression profiles for this set of cytokine genes and presumably others.
Gene expression in the presence of both GM-CSF and M-CSF There is evidence that GM-CSF and M-CSF can have some op-posing effects on monocytes/macrophages with possible implica-tions for the magnitude and maintenance of inflammatory reacimplica-tions (7, 11, 17, 19, 21). We next explored this possibility further in both the human and murine cell populations under study. Human cells.Fig. 1A shows that if GM-CSF and M-CSF are both included in the 7-d monocyte cultures, then the microarray profile resembles more that found for GM-MDM rather than that for MDM. Of the 3044 genes that were.2-fold differentially regu-lated between GM-MDM and MDM (see earlier), only ∼10% were modulated by CSF coaddition. The top 50 genes relative to MDM and to GM-MDM are collated in Supplemental Table III. This modest effect could be because GM-CSF treatment of human monocytes can upregulate M-CSF synthesis and secretion in its own right (44), with this endogenous M-CSF possibly contributing already to the GM-CSF–induced profile in these 7-d cultures. Consistent with this prior observation, it can be noted in Table I that M-CSF (CSF-1) is much more highly expressed (21-fold) at the gene level in GM-MDM versus MDM.
As regards the possible contribution of endogenous type I IFN (45) in the cocultures, of the putative endogenous type I IFN-FIGURE 3. GM-CSF preferentially induces IRF4 in human monocytes. Human monocytes were stimulated with either GM-CSF (5 ng/ml) or M-CSF (2500 U/ml) or in culture medium (negative control) for indicated periods. (AandB) qPCR with UBC mRNA as reference. mRNA expression for IRF4 and IRF5, in triplicate, was plotted relative to that at t = 0, which were given an arbitrary value of 1.0. Results are means6SE (n= 4 donors). mRNA expression for cells in culture medium alone did not change over the time course (not shown). Statistical analyses (GM-CSF versus M-CSF) were performed using Wilcoxon matched pairs test, *p#0.05. (C) Whole-cell lysates were subjected to Western blotting with anti-IRF4, anti-IRF5, and anti–b-tubulin Abs. (D) IRF4 and IRF5 protein levels (n= 3 donors) were plotted relative to expression at t = 0 as means6SE. Statistical analyses (GM-CSF versus M-CSF) were performed using Studentttest, *p#0.05.
regulated genes regulated differently in GM-MDM and MDM (Table III), 37 of them were modulated in the CSF coaddition group (data not shown). For the IRFs, in both short-term (16-h) and long-term (7-d) cultures, M-CSF suppressed the induction of IRF4 mRNA by GM-CSF with no significant differences in IRF5
mRNA between M-CSF–treated, GM-CSF–treated, or coaddition cultures (Fig. 7).
With respect to the cytokines studied earlier (Figs. 4, 6), over the 24-h time course shown earlier for CSF-treated monocytes, M-CSF coaddition reduced the increased gene expression caused by FIGURE 4. Cytokine mRNA levels in GM-MDM and MDM, and in monocytes treated with GM-CSF and M-CSF. (A) GM-MDM, MDM, and fresh monocytes. qPCR with 18S rRNA as reference. mRNA expression, in triplicate, was plotted relative to that at t = 0 (i.e., monocytes), which was given an arbitrary value of 1.0 for each cytokine. Box-and-whisker plots represent mRNA expression from eight donors. Statistical analysis was performed using Wilcoxon matched pairs test;p#0.05 is indicated for GM-MDM versus MDM. (B) GM-MDM and MDM (n= 5 donors) were left untreated or stimulated with LPS (100 ng/ml) for 24 h. Cytokines in the supernatant were measured. Statistical analysis was performed using Wilcoxon matched pairs test, where p#0.05 is indicated for GM-MDM versus MDM after LPS stimulation. N.D., not detected. (C) Fresh monocytes (t = 0) and monocytes treated with GM-CSF (5 ng/ml) or M-CSF (2500 U/ml) for 16 h. mRNA expression and statistical analysis as in (A) (n= 8 donors again);p#0.05 is indicated for GM-CSF versus M-CSF.
GM-CSF for TNF and IL-12p40, but not for IL-1band IL-23p19; in contrast, GM-CSF reduced the IL-10 induction by M-CSF (Fig. 6).
Murine cells. We showed previously that when BMM were “primed” with GM-CSF for a short period (16 h), the cells started to express certain secreted cytokines on LPS stimulation, such as IL-12 and IL-23, that is, started to adopt, to some extent, the features of GM-BMM (11). The data for the basal gene expression of these and other cytokines in BMM and GM-BMM are provided in Fig. 8A; it can be seen that GM-CSF addition to BMM increases mRNA levels for certain cytokines that have been as-sociated with an M1 phenotype (11, 32, 34), namely, TNF, IL-6, IL-1b, IL-12p35, IL-23p19, and CCL17, whereas it decreases those for cytokines that have been linked with an M2 phenotype, namely, IL-10, IFN-b, TGF-b, CCL5, CCL12, CXCL10, and
CCL2 (11, 32, 34). Conversely, M-CSF suppresses the mRNA levels of the M1-associated cytokines (TNF, 12p40, and IL-23p19) (11) (Fig. 8B).
To assess the generality of these observations for GM-CSF– treated BMM, we measured by microarray the relative gene ex-pression profiles for BMM, prestarved overnight of M-CSF, after 16-h treatment with the CSFs, either alone or in combina-tion. From 3 experiments, 3065 genes (12%) were differentially expressed (i.e., p , 0.05 and ratio $ 2-fold change) between BMM treated with GM-CSF or M-CSF (the top 50 genes are collated in Supplemental Table IV). The “heat map” is presented in Fig. 1C. The top 50 genes from BMM cotreated with M-CSF and GM-CSF relative to GM-CSF–treated BMM and to M-CSF– treated BMM are collated in Supplemental Table IV. In the presence of both CSFs, M-CSF addition reversed the expression of FIGURE 5. Effect of endogenous IL-10 and activin A on cytokine expression. (A) Fresh monocytes (t = 0) and monocytes cultured with M-CSF (2500 U/ml) together with either anti–IL-10 Abs (5mg/ml) or its isotype control (5mg/ml) for 16 h. qPCR with 18S rRNA as reference. mRNA expression, in triplicate, was plotted relative to that at t = 0 (i.e., monocytes), which was given an arbitrary value of 1.0 for each cytokine. Statistical analysis was performed using Wilcoxon matched pairs test;p#0.05 is indicated for anti–IL-10 versus isotype control (n= 5 donors). (B) Wild-type and IL-102/2 BMM. qPCR with 18S rRNA as reference. Basal mRNA expression, in triplicate, from IL-102/2BMM levels were plotted relative to their expression in wild-type BMM, which was given an arbitrary value of 1.0 for each cytokine. Results are means6SE from four independent experiments. (C) Wild-type and IL-102/2BMM stimulated with LPS (100 ng/ml) for 24 h (6 h for TNF). Cytokines in the supernatant were measured by ELISA. Results are mean values6SE from four independent experiments. N.D., not detected. *p#0.05 (Studentttest) for IL-102/2versus wild-type. (D) Fresh monocytes (t = 0) and monocytes treated with GM-CSF (5 ng/ml) for 16 h and 7 d (i.e., GM-MDM). qPCR with 18S rRNA as reference. mRNA expression in triplicate cultures, plotted relative to that at t = 0 (n= 6 donors). (E) GM-MDM generated with either anti-activin A Ab or its isotype control (100 ng/ml). qPCR with 18S RNA as reference. mRNA expression for triplicate cultures, plotted relative to that of isotype control (n= 6 donors), *p#0.05 (Studentttest) unless indicated as NS.
1936 (63%) genes regulated by GM-CSF alone; this is reflected in the “heat map” (Fig. 1C), with the (M-CSF + GM-CSF)–treated BMM being more similar to the M-CSF–treated BMM than to the GM-CSF–treated BMM. Of the GM-CSF–regulated genes re-versed by M-CSF, 222 of these were type I IFN-sensitive genes (34), suggesting that, for starved BMM in short-term cultures, M-CSF can have significant modulating effects on the response to GM-CSF, in part, by modulating endogenous type I IFN levels. As for the IRF qPCR data for the human cells (Fig. 7), by micro-array analysis, M-CSF reduced the increase in IRF4 mRNA in GM-CSF–treated BMM (16 h), with there being no significant dif-ferences between M-CSF–, GM-CSF–, or (M-CSF + GM-CSF)– treated BMM for IRF5 mRNA (data not shown).
Discussion
Both the human GM-MDM and MDM, and the murine GM-BMM and BMM are widely studied populations as models for GM-CSF and M-CSF function, respectively, but also for DC and/or mac-rophage biology (7, 10–13, 15, 22–25, 33, 46). Most studies on CSF actions on macrophage lineage populations have usually been with one CSF as for our gene expression analysis comparing hu-man monocytes with MDM (23). Bioinformatics analyses on GM-MDM and GM-BMM using public access databases indicate that
they have basal transcriptomes that are close to those of macro-phages rather than DCs (24, 25, 31). Within each species, we reported earlier that the GM-CSF–derived populations have basal transcriptome profiles (.80%) similar to those of macrophages, in our case, M-CSF–derived populations. How similar or otherwise the relative gene expression profiles of these GCSF– and M-CSF–generated populations between human and mouse are has not been assessed previously as an indication of how appropriate the murine populations are as models for the corresponding human cell types. We found that at the individual level, only around 17% of the genes in the human GM-CSF versus M-CSF comparison had a conserved expression profile to the murine GM-CSF versus M-CSF comparison; this conservation was higher when compar-isons were made across GO categories and molecular pathways. The degree of overlap found at the individual gene level pre-sumably reflects the fact that the starting populations are dif-ferent, namely, monocytes (human) and bone marrow (murine), and also that there are very different degrees of differentiation versus proliferation occurring during the generation of the CSF-dependent populations. It is perhaps not unreasonable that, for both species, GM-CSF–derived populations expressed relatively more genes implicated in immune/inflammatory reactions seeing that GM-CSF tends to be produced during such reactions (7). FIGURE 6. Time course for cytokine mRNA levels in monocytes treated with GM-CSF, M-CSF, or both. Human monocytes were cultured with GM-CSF (5 ng/ml), M-CSF (2500 U/ml), or both for indicated periods. qPCR with 18S rRNA as reference. mRNA expression, in triplicate, was plotted relative to that at t = 0 (i.e., no growth factor is present), which was given an arbitrary value of 1.0 for each cytokine. mRNA expression for cells in culture medium alone did not change over the time course (not shown). Results are means6SE from four donors. Statistical analyses were performed using Wilcoxon matched pairs test, *p#0.05, GM-CSF versus M-CSF.
FIGURE 7. M-CSF suppresses GM-CSF induction of IRF4 mRNA in human monocytes. Human monocytes were cultured with either GM-CSF (5 ng/ ml), M-CSF (2500 U/ml), or both for 16 h or 7 d (168 h). qPCR with UBC mRNA as reference. mRNA expression for IRF4 and IRF5, in triplicate, was plotted relative to that at t = 0 (i.e., no growth factor is present), which was given an arbitrary value of 1.0. Box-and-whisker plot represents mRNA expression from six donors. Statistical analyses were performed using Wilcoxon matched pairs test,p#0.05.
Given the differences observed, caution should be exercised in interpreting the relevance of data obtained from the murine GM-BMM and GM-BMM for the (developmental) functions of the CSFs on human macrophage lineage cells.
As described previously (34, 43, 47), endogenous mediators can influence quite dramatically the gene expression profiles of mac-rophage populations particularly in long-term cultures. We have extrapolated our earlier findings on the role of endogenous type I IFN in determining the gene expression profiles of BMM and GM-BMM individually (34) by now highlighting that type I IFN can also contribute to the difference in the profiles between BMM and GM-BMM; we also suggested earlier that a similar contribution could be occurring for MDM and GM-MDM. The potential con-tribution of at least endogenous type I IFN, as well as IL-10 and activin A, should therefore always be taken into account when assessing CSF function. Interestingly, there is evidence for a link in macrophages between these mediators with endogenous type I IFN able to promote IL-10 formation (34, 43), but endogenous activin A able to inhibit it (Fig. 5E) (12). Such endogenous mediators are likely to accumulate over time in macrophage cul-tures, thereby making it important to examine CSF-induced responses at different time points if one is to dissect out the di-rect effects of the CSFs. In support of this contention, we showed earlier that the time of exposure can be quite critical for the es-timation of CSF-dependent cytokine expression in human mono-cyte cultures.
For convenience, macrophage populations are being categorized into M1 and M2 polarization (activation) states after short-term treatment with agents such as IFN-g 6LPS or IL-4 and IL-13, respectively, to help define their function in host defense and inflammation/repair (26–29). However, this M1/M2 classification, although worthwhile, has of necessity to be limited, and additional criteria, such as developmental ones dependent on the CSFs, are needed (48); also, such categorization is made difficult because some of the markers used to define M1 and M2 polarization differ between the mouse and the human (49). We and others have highlighted that, for the CSF-differentiated human and murine cell types studied earlier, GM-CSF gave rise to populations that tended to produce higher levels of “proinflammatory” cytokines (e.g., TNF, IL-23), but lower levels of “anti-inflammatory” cytokines (e.g., IL-10), than M-CSF did (11, 13, 42). With this in mind, we have previously labeled GM-BMM and BMM as “M1-like” and “M2-like,” respectively, based only on this pattern of cytokine expression (11). Likewise, Verreck et al. (13) have labeled GM-MDM and GM-MDM as Mw-1 and Mw-2 macrophages, respectively, based on similar relative cytokine expression data. Even though there is some overlap, we suggest that such “conservative” no-menclature, rather than M1/M2, be used to denote macrophage phenotypes induced in response to GM-CSF or M-CSF because many responses to these cytokines will differ from those resulting from the very different signaling pathways activated by IFN-g, LPS, IL-4, among others. Using specific cytokine expression again as the readout, we showed previously (11), and also earlier in this article, that short-term treatment of BMM and GM-BMM with the CSF not used to generate them “switched” to some extent the target population to the other phenotype. Again, for the expression of the cytokines that we have used to define the murine pop-ulations in this way, namely, TNF, IL-23, IL-10, among others (11), the time point of the analysis after CSF exposure can be critical (Figs. 4, 6), with endogenous mediators again capable of contributing to the outcome (Fig. 5).
Recently, the transcription factor, IRF5, has been proposed to be critical for the development of the M1 phenotype including that generated by GM-CSF (32, 38). However, our earlier data on the striking degree of upregulation of IRF4 by GM-CSF compared with that of IRF5 suggests that the former may be worth further consideration as being critical for GM-CSF–dependent responses. In addition, our data on the lack of upregulation of IRF4 (Fig. 3), and indeed its suppression (Fig. 7) by M-CSF, raises questions as to its proposed role in M-CSF–induced M2 polarization in mac-rophages (37).
For its role in macrophage lineage biology, the ubiquitous M-CSF is particularly implicated in the steady-state control of tissue macrophage development, whereas GM-CSF is often con-sidered to be making its contribution in this context during im-mune/inflammatory reactions (7). In the latter reactions, therefore, macrophage populations are likely to be exposed often to both CSFs simultaneously (16). There are examples in the literature where M-CSF can have the opposite effects to or even oppose the responses of monocyte/macrophage populations to GM-CSF (7, 11, 17–21, 50, 51). For both human and murine populations, cultured long term or short term, evidence was given earlier for such a “competition” at the global gene expression level, as well as for the control of specific cytokine genes. Further experimen-tation is needed to explore the significance of such “competition,” particularly because M-CSF has been proposed also to have a possible involvement in the resolution of inflammatory reactions in its role as a homeostatic macrophage lineage regulator (7). In this context, for IRF4 mRNA, but not IRF5 mRNA, M-CSF downregulated its enhancement because of GM-CSF. Obviously FIGURE 8. Modulation of cytokine gene expression in BMM by
GM-CSF and in GM-BMM by M-GM-CSF. (A) BMM cultured in GM-CSF (5 ng/ ml) for 16 h; (B) GM-BMM cultured in M-CSF (2500 U/ml) for 16 h. qPCR with 18S rRNA as reference. mRNA expression, in triplicate, was plotted relative to basal expression in either BMM or GM-BMM given an arbitrary value of 1.0. Results are means6SE from four independent experiments. mRNA expression relative to unstimulated BMM (A) or GM-BMM (B) is significant (p#0.05, Studentttest) unless indicated as NS.
more thorough analyses of the role of IRFs in CSF-dependent macrophage lineage biology and of the mechanism of any “com-petition” between the CSFs are warranted. We also demonstrated earlier that gene expression data obtained from CSF cocultures may also be influenced by the time period of the dual-exposure cultures and by the presence of endogenous mediators such as type I IFN; care again needs to be exercised when endeavoring to as-sess whether a particular gene change is due to a direct effect of CSF action in the cocultures.
In conclusion, a number of factors need to be taken into account when drawing definitive conclusions from a particular in vitro system about the precise roles of GM-CSF and M-CSF in hu-man macrophage lineage biology.
Acknowledgments
We thank Jennifer Davis for assistance with the maintenance and care of the mice.
Disclosures
The authors have no financial conflicts of interest.
References
1. Burgess, A. W., and D. Metcalf. 1980. The nature and action of granulocyte-macrophage colony stimulating factors.Blood56: 947–958.
2. Stanley, E. R., K. L. Berg, D. B. Einstein, P. S. Lee, F. J. Pixley, Y. Wang, and Y. G. Yeung. 1997. Biology and action of colony—stimulating factor-1.Mol. Reprod. Dev.46: 4–10.
3. Wiktor-Jedrzejczak, W., A. Bartocci, A. W. Ferrante, Jr., A. Ahmed-Ansari, K. W. Sell, J. W. Pollard, and E. R. Stanley. 1990. Total absence of colony-stimulating factor 1 in the macrophage-deficient osteopetrotic (op/op) mouse. Proc. Natl. Acad. Sci. USA87: 4828–4832.
4. Metcalf, D., and N. A. Nicola. 1995.The hemopoietic colony-stimulating fac-tors: from biology to clinical applications.Cambridge University Press, Cam-bridge, U.K.
5. Naik, S. H., D. Metcalf, A. van Nieuwenhuijze, I. Wicks, L. Wu, M. O’Keeffe, and K. Shortman. 2006. Intrasplenic steady-state dendritic cell precursors that are distinct from monocytes.Nat. Immunol.7: 663–671.
6. Schmid, M. A., D. Kingston, S. Boddupalli, and M. G. Manz. 2010. Instructive cytokine signals in dendritic cell lineage commitment.Immunol. Rev.234: 32– 44.
7. Hamilton, J. A. 2008. Colony-stimulating factors in inflammation and autoim-munity.Nat. Rev. Immunol.8: 533–544.
8. Chitu, V., and E. R. Stanley. 2006. Colony-stimulating factor-1 in immunity and inflammation.Curr. Opin. Immunol.18: 39–48.
9. Fleetwood, A. J., A. D. Cook, and J. A. Hamilton. 2005. Functions of granulocyte-macrophage colony-stimulating factor.Crit. Rev. Immunol.25: 405– 428.
10. Akagawa, K. S. 2002. Functional heterogeneity of colony-stimulating factor-induced human monocyte-derived macrophages.Int. J. Hematol.76: 27–34. 11. Fleetwood, A. J., T. Lawrence, J. A. Hamilton, and A. D. Cook. 2007.
Granulocyte-macrophage colony-stimulating factor (CSF) and macrophage CSF-dependent macrophage phenotypes display differences in cytokine profiles and transcription factor activities: implications for CSF blockade in inflammation.J. Immunol.178: 5245–5252.
12. Sierra-Filardi, E., A. Puig-Kro¨ger, F. J. Blanco, C. Nieto, R. Bragado, M. I. Palomero, C. Bernabe´u, M. A. Vega, and A. L. Corbı´. 2011. Activin A skews macrophage polarization by promoting a proinflammatory phenotype and inhibiting the acquisition of anti-inflammatory macrophage markers.Blood117: 5092–5101.
13. Verreck, F. A., T. de Boer, D. M. Langenberg, M. A. Hoeve, M. Kramer, E. Vaisberg, R. Kastelein, A. Kolk, R. de Waal-Malefyt, and T. H. Ottenhoff. 2004. Human IL-23-producing type 1 macrophages promote but IL-10-producing type 2 macrophages subvert immunity to (myco)bacteria. Proc. Natl. Acad. Sci. USA101: 4560–4565.
14. Inaba, K., M. Inaba, N. Romani, H. Aya, M. Deguchi, S. Ikehara, S. Muramatsu, and R. M. Steinman. 1992. Generation of large numbers of dendritic cells from mouse bone marrow cultures supplemented with granulocyte/macrophage colony-stimulating factor.J. Exp. Med.176: 1693–1702.
15. Xu, Y., Y. Zhan, A. M. Lew, S. H. Naik, and M. H. Kershaw. 2007. Differential development of murine dendritic cells by GM-CSF versus Flt3 ligand has implications for inflammation and trafficking.J. Immunol.179: 7577–7584. 16. Higgins, D. M., J. Sanchez-Campillo, A. G. Rosas-Taraco, J. R. Higgins,
E. J. Lee, I. M. Orme, and M. Gonzalez-Juarrero. 2008. Relative levels of M-CSF and GM-M-CSF influence the specific generation of macrophage populations during infection withMycobacterium tuberculosis. J. Immunol.180: 4892–4900. 17. Lari, R., A. J. Fleetwood, P. D. Kitchener, A. D. Cook, D. Pavasovic, P. J. Hertzog, and J. A. Hamilton. 2007. Macrophage lineage phenotypes and osteoclastogenesis—complexity in the control by GM-CSF and TGF-beta.Bone 40: 323–336.
18. Menetrier-Caux, C., G. Montmain, M. C. Dieu, C. Bain, M. C. Favrot, C. Caux, and J. Y. Blay. 1998. Inhibition of the differentiation of dendritic cells from CD34(+) progenitors by tumor cells: role of interleukin-6 and macrophage colony-stimulating factor.Blood92: 4778–4791.
19. Phillips, W. A., and J. A. Hamilton. 1990. Colony stimulating factor-1 is a negative regulator of the macrophage respiratory burst.J. Cell. Physiol.144: 190–196. 20. Willman, C. L., C. C. Stewart, V. Miller, T. L. Yi, and T. B. Tomasi. 1989.
Regulation of MHC class II gene expression in macrophages by hematopoietic colony-stimulating factors (CSF). Induction by granulocyte/macrophage CSF and inhibition by CSF-1.J. Exp. Med.170: 1559–1567.
21. Broche´riou, I., S. Maouche, H. Durand, V. Braunersreuther, G. Le Naour, A. Gratchev, F. Koskas, F. Mach, J. Kzhyshkowska, and E. Ninio. 2011. An-tagonistic regulation of macrophage phenotype by M-CSF and GM-CSF: im-plication in atherosclerosis.Atherosclerosis214: 316–324.
22. Martinez, F. O., S. Gordon, M. Locati, and A. Mantovani. 2006. Transcriptional profiling of the human monocyte-to-macrophage differentiation and polarization: new molecules and patterns of gene expression.J. Immunol.177: 7303–7311. 23. Way, K. J., H. Dinh, M. R. Keene, K. E. White, F. I. Clanchy, P. Lusby,
J. Roiniotis, A. D. Cook, A. I. Cassady, D. J. Curtis, and J. A. Hamilton. 2009. The generation and properties of human macrophage populations from hemo-poietic stem cells.J. Leukoc. Biol.85: 766–778.
24. Robbins, S. H., T. Walzer, D. Dembe´le´, C. Thibault, A. Defays, G. Bessou, H. Xu, E. Vivier, M. Sellars, P. Pierre, et al. 2008. Novel insights into the relationships between dendritic cell subsets in human and mouse revealed by genome-wide expression profiling.Genome Biol.9: R17.
25. Crozat, K., R. Guiton, M. Guilliams, S. Henri, T. Baranek, I. Schwartz-Cornil, B. Malissen, and M. Dalod. 2010. Comparative genomics as a tool to reveal functional equivalences between human and mouse dendritic cell subsets. Immunol. Rev.234: 177–198.
26. Mantovani, A., A. Sica, and M. Locati. 2005. Macrophage polarization comes of age.Immunity23: 344–346.
27. Mantovani, A., S. Sozzani, M. Locati, P. Allavena, and A. Sica. 2002. Macro-phage polarization: tumor-associated macroMacro-phages as a paradigm for polarized M2 mononuclear phagocytes.Trends Immunol.23: 549–555.
28. Mosser, D. M., and J. P. Edwards. 2008. Exploring the full spectrum of mac-rophage activation.Nat. Rev. Immunol.8: 958–969.
29. Taylor, P. R., and S. Gordon. 2003. Monocyte heterogeneity and innate immu-nity.Immunity19: 2–4.
30. Thomas, J. A., C. Pope, D. Wojtacha, A. J. Robson, T. T. Gordon-Walker, S. Hartland, P. Ramachandran, M. Van Deemter, D. A. Hume, J. P. Iredale, and S. J. Forbes. 2011. Macrophage therapy for murine liver fibrosis recruits host effector cells improving fibrosis, regeneration, and function.Hepatology 53: 2003–2015.
31. Mabbott, N. A., J. Kenneth Baillie, D. A. Hume, and T. C. Freeman. 2010. Meta-analysis of lineage-specific gene expression signatures in mouse leukocyte populations.Immunobiology215: 724–736.
32. Krausgruber, T., K. Blazek, T. Smallie, S. Alzabin, H. Lockstone, N. Sahgal, T. Hussell, M. Feldmann, and I. A. Udalova. 2011. IRF5 promotes inflammatory macrophage polarization and TH1-TH17 responses.Nat. Immunol.12: 231–238. 33. Cunnick, J., P. Kaur, Y. Cho, J. Groffen, and N. Heisterkamp. 2006. Use of bone marrow-derived macrophages to model murine innate immune responses. J. Immunol. Methods311: 96–105.
34. Fleetwood, A. J., H. Dinh, A. D. Cook, P. J. Hertzog, and J. A. Hamilton. 2009. GM-CSF- and M-CSF-dependent macrophage phenotypes display differential dependence on type I interferon signaling.J. Leukoc. Biol.86: 411–421. 35. Brazma, A., P. Hingamp, J. Quackenbush, G. Sherlock, P. Spellman, C. Stoeckert,
J. Aach, W. Ansorge, C. A. Ball, H. C. Causton, et al. 2001. Minimum informa-tion about a microarray experiment (MIAME)-toward standards for microarray data.Nat. Genet.29: 365–371.
36. Ashburner, M., C. A. Ball, J. A. Blake, D. Botstein, H. Butler, J. M. Cherry, A. P. Davis, K. Dolinski, S. S. Dwight, J. T. Eppig, et al; The Gene Ontology Consortium. 2000. Gene ontology: tool for the unification of biology.Nat. Genet. 25: 25–29.
37. Satoh, T., O. Takeuchi, A. Vandenbon, K. Yasuda, Y. Tanaka, Y. Kumagai, T. Miyake, K. Matsushita, T. Okazaki, T. Saitoh, et al. 2010. The Jmjd3-Irf4 axis regulates M2 macrophage polarization and host responses against helminth in-fection.Nat. Immunol.11: 936–944.
38. Krausgruber, T., D. Saliba, G. Ryzhakov, A. Lanfrancotti, K. Blazek, and I. A. Udalova. 2010. IRF5 is required for late-phase TNF secretion by human dendritic cells.Blood115: 4421–4430.
39. Verreck, F. A., T. de Boer, D. M. Langenberg, L. van der Zanden, and T. H. Ottenhoff. 2006. Phenotypic and functional profiling of human proin-flammatory type-1 and anti-inproin-flammatory type-2 macrophages in response to microbial antigens and IFN-gamma- and CD40L-mediated costimulation. J. Leukoc. Biol.79: 285–293.
40. Hashimoto, S., M. Yamada, K. Motoyoshi, and K. S. Akagawa. 1997. En-hancement of macrophage colony-stimulating factor-induced growth and dif-ferentiation of human monocytes by interleukin-10.Blood89: 315–321. 41. Mochida-Nishimura, K., K. S. Akagawa, and E. A. Rich. 2001. Interleukin-10
contributes development of macrophage suppressor activities by macrophage colony-stimulating factor, but not by granulocyte-macrophage colony-stimulating factor.Cell. Immunol.214: 81–88.
42. Kamada, N., T. Hisamatsu, S. Okamoto, T. Sato, K. Matsuoka, K. Arai, T. Nakai, A. Hasegawa, N. Inoue, N. Watanabe, et al. 2005. Abnormally differentiated subsets of intestinal macrophage play a key role in Th1-dominant chronic colitis through excess production of IL-12 and IL-23 in response to bacteria. J. Immunol.175: 6900–6908.
43. Chang, E. Y., B. Guo, S. E. Doyle, and G. Cheng. 2007. Cutting edge: in-volvement of the type I IFN production and signaling pathway in lipopolysac-charide-induced IL-10 production.J. Immunol.178: 6705–6709.
44. Hamilton, J. A. 1994. Coordinate and noncoordinate colony stimulating factor formation by human monocytes.J. Leukoc. Biol.55: 355–361.
45. Fosang, A. J., K. Last, V. Kna¨uper, P. J. Neame, G. Murphy, T. E. Hardingham, H. Tschesche, and J. A. Hamilton. 1993. Fibroblast and neutrophil collagenases cleave at two sites in the cartilage aggrecan interglobular domain.Biochem. J.295: 273–276. 46. Hashimoto, S., T. Suzuki, H. Y. Dong, N. Yamazaki, and K. Matsushima. 1999. Serial analysis of gene expression in human monocytes and macrophages.Blood 94: 837–844.
47. Foey, A. D., M. Feldmann, and F. M. Brennan. 2000. Route of monocyte dif-ferentiation determines their cytokine production profile: CD40 ligation induces interleukin 10 expression.Cytokine12: 1496–1505.
48. Pollard, J. W. 2009. Trophic macrophages in development and disease.Nat. Rev. Immunol.9: 259–270.
49. Raes, G., R. Van den Bergh, P. De Baetselier, G. H. Ghassabeh, C. Scotton, M. Locati, A. Mantovani, and S. Sozzani. 2005. Arginase-1 and Ym1 are markers for murine, but not human, alternatively activated myeloid cells. J. Immunol.174: 6561–, author reply 6561–6562.
50. De, A. K., K. Laudanski, and C. L. Miller-Graziano. 2003. Failure of monocytes of trauma patients to convert to immature dendritic cells is related to preferential macrophage-colony-stimulating factor-driven macrophage differentiation. J. Immunol.170: 6355–6362.
51. Kumar, R., Z. Dong, and I. J. Fidler. 1996. Differential regulation of metal-loelastase activity in murine peritoneal macrophages by granulocyte-macro-phage colony-stimulating factor and macrogranulocyte-macro-phage colony-stimulating factor.J. Immunol.157: 5104–5111.