Multi-contrast multi-scale surface registration for improved alignment of
cortical areas
Christine Lucas Tardif
a,⁎
, Andreas Schäfer
a, Miriam Waehnert
a, Juliane Dinse
a,b,
Robert Turner
a, Pierre-Louis Bazin
aa
Department of Neurophysics, Max Planck Institute for Human Cognitive and Brain Sciences, Leipzig, Germany b
Faculty of Computer Science, Otto-von-Guericke University, Magdeburg, Germany
a b s t r a c t
a r t i c l e i n f o
Article history:
Accepted 2 February 2015 Available online 9 February 2015 Keywords: Surface registration Cortical alignment T1 Myeloarchitecture Multi-contrast
Symmetric diffeomorphic transformation
The position of cortical areas can be approximately predicted from cortical surface folding patterns. However, there is extensive inter-subject variability in cortical folding patterns, prohibiting a one-to-one mapping of tical folds in certain areas. In addition, the relationship between cortical area boundaries and the shape of the cor-tex is variable, and weaker for higher-order cortical areas. Current surface registration techniques align cortical folding patterns using sulcal landmarks or cortical curvature, for instance. The alignment of cortical areas by these techniques is thus inherently limited by the sole use of geometric similarity metrics. Magnetic resonance imaging T1 maps show intra-cortical contrast that reflects myelin content, and thus can be used to improve the alignment of cortical areas. In this article, we present a new symmetric diffeomorphic multi-contrast multi-scale surface registration (MMSR) technique that works with partially inflated surfaces in the level-set framework. MMSR generates a more precise alignment of cortical surface curvature in comparison to two widely recognized surface registration algorithms. The resulting overlap in gyrus labels is comparable to FreeSurfer. Most importantly, MMSR improves the alignment of cortical areas further by including T1 maps. As afirst application, we present a group average T1 map at a uniquely high-resolution and multiple cortical depths, which reflects the myeloarchitecture of the cortex. MMSR can also be applied to other MR contrasts, such as functional and connec-tivity data.
© 2015 The Authors. Published by Elsevier Inc. This is an open access article under the CC BY license (http://creativecommons.org/licenses/by/4.0/).
Introduction
Image registration is crucial for brain mapping studies, such as com-parative morphometry and group analysis of functional data, in order to compensate for differences in position, size and shape of brain struc-tures across individuals. Many fully automated non-linear volume regis-tration algorithms have been developed to align brain structures, and produce very good results even for strong differences due to pathology (seeKlein et al. (2009)for a review). Although these algorithms per-form well for deep brain structures, they fail to accurately align the ce-rebral cortex, a thin sheet that is highly convoluted and variable. In magnetic resonance imaging (MRI) studies, surface registration, which aligns 2D manifolds based on their shape, is often preferred over volume registration to align cortical areas between subjects or with an atlas. The pioneering work ofBrodmann (1909)and more recent histological studies (Fischl et al., 2008; Hinds et al., 2008) have shown that cortical folding patterns can be used to approximately predict the location of
cortical areas, with the highest accuracy for primary cortical areas. Sur-face registration driven by cortical folding patterns also improves the statistical power and spatial specificity of group functional MRI analysis (Frost and Goebel, 2012; van Atteveldt et al., 2004) due to improved alignment of functional areas.
In spite of this significant improvement in cortical alignment, folding-based surface registration is inherently limited in two ways. There are regions of high inter-subject folding variability, defined in Ono'sAtlas of the Cerebral Sulci(Ono et al., 1990), where the number of folds may differ and a one-to-one mapping of folds is not possible. Furthermore, the boundaries between functional cortical areas have a complex and variable relationship with the cortical folding pattern, in particular for higher cognitive and association cortex. Inter-subject var-iability in size and shape of the primary visual cortex in relation to sulcal folds has been shown in histology studies (Amunts et al., 2000; Hinds et al., 2008). More significant variability has been shown for non-primary areas including the motion sensitive visual complex MT+/V5 and Broca's area using histology (Fischl et al., 2008), task-based fMRI (Frost and Goebel, 2012), as well as T1-weighted/“T2-weighted”images (Glasser and Van Essen, 2011). Due to this complex relationship, the alignment of cortical areas is improved but is also inherently limited
NeuroImage 111 (2015) 107–122
⁎ Corresponding author at: Max Planck Institute for Human Cognitive and Brain Sciences, Department of Neurophysics, Stephanstrasse 1A, 04301 Leipzig, Germany.
E-mail address:[email protected](C.L. Tardif).
http://dx.doi.org/10.1016/j.neuroimage.2015.02.005
1053-8119/© 2015 The Authors. Published by Elsevier Inc. This is an open access article under the CC BY license (http://creativecommons.org/licenses/by/4.0/). Contents lists available atScienceDirect
NeuroImage
by the use of geometric information to drive the surface registration. Assuming a perfect alignment of the geometric similarity metric, such as curvature or sulcal landmarks, is achieved, there will remain a resid-ual error in the alignment of cortical areas between subjects.
Cortical micro-architectonic features, such as the density, size, orien-tation and shape of cells and myelin sheaths, are more strongly related to cortical function than cortical folding patterns (Amunts et al., 2007). Structural MR images show myelin contrast that reflects the architec-tonic boundaries of cortical areas (Geyer et al., 2011). Very high-resolution T1 maps show exquisite intra-cortical contrast that varies as a function of cortical depth (Geyer et al., 2011; Lutti et al., 2014a; Tardif et al., 2013). Recent studies have mapped individual and group average T1 maps (Bazin et al., 2014; Sereno et al., 2013; Weiss et al., 2010), T2* maps (Cohen-Adad et al., 2012) and T1-weighted/“ T2-weighted”images (Glasser and Van Essen, 2011) onto the cortical surface. Primary areas and extrastriate visual areas, which are densely myelinated, are clearly discernible on the inflated surfaces. These
“myelin maps”have been shown to truly reflect the location of function-ally specialized areas of the cortex using topological mapping fMRI (Bridge et al., 2005; Dick et al., 2012; Sereno et al., 2013), as well as task and resting-state fMRI (Van Essen and Glasser, 2014). We propose to use T1 maps, a quantitative index of primarily myelin content (Geyer et al., 2011; Stüber et al., 2014), to improve the surface-based alignment of cortical areas.
In this paper, we present a novel automated contrast multi-scale surface-based registration technique (MMSR) for precise surface registration, with key improvements over current methods. MMSR applies a non-linear volume-based registration algorithm to surface in-formation represented in volume space, rather than computing a defor-mation restricted to a spherical manifold. It can therefore be applied to surfaces with non-spherical topology, and the computed deformation is meaningful for statistical shape analysis (Miller, 2004). MMSR registers the level-set representation of the cortical surfaces and two curvature metrics (curvedness and shape index). We developed a multi-scale ap-proach that is applied to a hierarchy of partially inflated level set sur-faces with a shrinking narrowband. Thefinal transformation is a direct symmetric diffeomorphic mapping between the original surfaces in vol-ume space. MMSR wasfirst introduced in a recent conference paper (Tardif et al., 2013). Here, we describe our improved implementation in detail.
For validation, we quantitatively compare MMSR to two widely accepted surface registration algorithms: FreeSurfer and Spherical Demons. Firstly, we build geometric group templates and calculate the group average and standard deviation of the registration metric, i.e. cur-vature, to compare the precision of the alignment. Secondly, we perform pairwise registration experiments of surfaces from the Mindboggle-101 dataset that have been manually labeled. The overlap of the labels after alignment is an indication of registration accuracy, i.e. whether the cor-responding gyri have been aligned or the algorithm is sensitive to local minima.
MMSR can also include other contrasts instead of, or in addition to, the curvature metrics to drive the registration. We demonstrate this feature by including intra-cortical T1 contrast with the objective to improve the alignment of cortical areas. We present a unique high-resolution (0.5 mm isotropic) group-average T1 map of the cortical sur-face at four cortical depths.
Multi-contrast surface registration The level-set framework
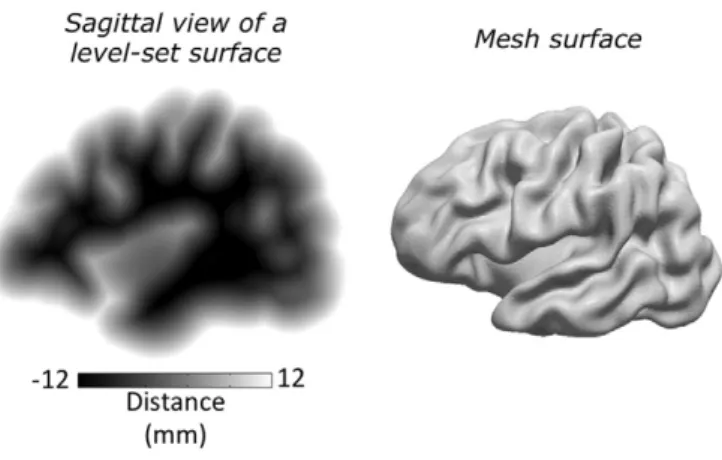
The MMSR algorithm applies non-linear volume registration to surface information represented in Cartesian space using a level-set framework. The level-set representationφ(v) of a surface is a signed distance function, i.e. the value at voxelvis equal to the distance of voxelvfrom the surface, positive outside the surface and negative inside
(Osher and Sethian, 1988). The level-set is often only defined within a maximum distance from the surface, a narrowband, to enhance compu-tation efficiency. An example of a level-set volume image and the corre-sponding mesh of a cortical surface are shown inFig. 1. Distance transforms and the level-set function have been exploited previously in rigid-body (Kozinska et al., 1997) and non-linear image registration (Vemuri et al., 2003), in particular to represent arbitrary shapes and their local variations (Hansen et al., 2007; Paragios et al., 2003). A recent article by Albrecht et al., which expands on previous work (Dedner et al., 2007; Lüthi et al., 2007), uses distance functions and other surface features, including curvature, to align surface renderings of human skulls and femurs (Albrecht et al., 2013). The advantage of the level-set framework is that numerical computations, such as surface curva-ture and normals, can be easily evaluated in the Cartesian grid without having to parameterize the surface. This implicit surface representation also prevents self-intersections and distortions during surface deforma-tions. Topological changes, such as breaking and merging, are well
de-fined and can be allowed or prevented (Han et al., 2002).
Multi-contrast approach
In addition to the level-set definition of the surface, additional sur-face or texture features can be used to drive the registration (Litke et al., 2005), such as surface curvature (Albrecht et al., 2013; Dedner et al., 2007). In our implementation, we use a total of four contrasts: a level-set representation of the cortical surface, two curvature metrics (curvedness and shape index) and, optionally, T1.
The level-setφis modulated using the sigmoid function in Eq.(1), where the slope is steepest at the intersection with the surface. The modulated level-setφespans the range [0, 1] within the narrow band specified by distanced. An example image is shown inFig. 2.
e
φð Þ ¼v 1
1þe2φð Þv=d ð1Þ
In addition to this contrast, which is radial to the cortical surface, we use the surface curvature to drive the registration in the tangential plane, as inDedner et al. (2007). Our objective is to align folds that are similar in shape and size. The principal curvatures (κ↓1 andκ↓2), as
well as the Gaussian and mean curvatures (KandH), both depend on the size and shape of the folds. Furthermore, they fail to distinguish cer-tain geometries. We chose to use the following two curvature metrics: the curvedness, representing the size of the cortical folds, and the shape index, representing the local shape of the folds (Koenderink and van Doorn, 1992). These two complementary metrics are ideal for
Fig. 1.Level-set representation of a cortical surface. To the left is a sagittal view of a 3D vol-ume level-set representation of a cortical surface. The voxel values correspond to the signed distance from the cortical surface defined within a narrowband of ±12 mm. The corresponding 2D mesh representation is shown to the right.
cortical shape characterization and mapping, as shown byTosun and Prince (2008).
The level-set isfirst smoothed by a 3D Gaussian kernel (σ= 2 mm). The curvednesscand shape indexsiof the smoothed level-set are calcu-lated using Eqs.(2) and (3)respectively, whereκ1andκ2are the two
principal curvatures. An example of these two contrasts is shown in
Fig. 2. c¼ ffiffiffiffiffiffiffiffiffiffiffiffiffiffiffiffiffi κ2 1þκ 2 2 2 s ð2Þ si¼2πtan−1 κ2þκ1 κ2−κ1 ð3Þ
Additional contrasts tangential to the cortical surface can be added to drive the surface registration. We choose to use T1 maps in order to improve the alignment of cortical areas. All tangential contrasts are lin-early rescaled to the range [−0.5, 0.5]. Each contrast can subsequently be weighted differently for registration.
Multi-scale approach
Our multi-scale approach aligns the primary and secondary folds
first, as well as the most prominent features in the other sources of con-trast. The registration process consists of 20 steps, each corresponding to a different inflation scale, starting with the most inflated and leading step-by-step to the original convoluted surfaces. An affine registration is performed at thefirst (most inflated) scale only, where only the lobar shape of the cortex is characterized. Thefinal registration scale has no inflation, resulting in a direct transformation between the source and target surfaces. The difference between two contiguous inflation scales is small to ensure that the transformation is smoothly defined and to minimize registration errors caused by local minima.
The level-set surfaceφ0is iteratively inflated using Eq.(4), where Gis a Gaussian smoothing kernel (σ= 1.5 mm) andHis the mean cur-vature. The level-set surface is thus inflated by two forces: 1) a balloon force, which corresponds to the difference between the original and Gaussian smoothed level-set; and 2) a smoothing force, which corre-sponds to the motion under mean curvatureH. The 20 inflation scales correspond to 40, 36, 32, 28, 25, 22, 19, 17, 15, 13, 11, 9, 7, 6, 5, 4, 3, 2, 1, 0 time steps (iterations) respectively, a subsample of which is illus-trated inFig. 3. The number of inflation scales and time steps per scale were chosen to ensure an accurate and smooth transformation. These parameters could be further optimized to trade-off accuracy for compu-tational speed.
The curvature metrics are evaluated at each inflation scale; whereas the other cortical features, such as T1, are mapped to each inflation scale by coordinate tracking (Vemuri et al., 2003).
∂φ
∂t ¼½ðφ−Gφ0Þ−H j∇φj ð4Þ
The level-set narrow band in Eq.(1)is set to the maximum absolute difference between the source and target level-sets at the given inflation scale. By allowing the narrow band to shrink as the solution converges, we limit the search space of the algorithm, improving the accuracy and speed of the registration. We also take into account the maximum dis-tance between the current and subsequent inflation scale in order to en-sure a continuous multi-scale deformation that avoids local minima (Hansen et al., 2007; Paragios et al., 2003).
At each scale, our method applies SyN, a leading non-linear volume-based registration algorithm (Klein et al., 2009), to the multiple con-trasts defined above. SyN is a symmetric image normalization algorithm that maximizes the cross-correlation within the space of diffeomorphic maps (Avants et al., 2008). SyN is run with the following parameters: cross-correlation metric with window radius of 3, a maximum of 100 coarse, 100 medium and 0fine iterations, Gaussian regularization
(σsimilarity gradient,σdeformationfield) = (2, 2), symmetric normalization
with gradient-descent step length of 0.25. All contrasts are used to
Fig. 2.Multi-modal surface-based registration image contrasts for a single inflation scale: sigmoid-modulated level-set, curvedness, shape index and T1. The volume images used for the surface-based registration are shown above the corresponding mesh representations below. Only the level-set image exhibits contrast radial to the cortical surface, all other contrasts are purely tangential to the surface.
Fig. 3.Subset of surface inflation scales used for registration. From right to left, these surfaces correspond to 40, 25, 15, 7, 3 and 0 time steps of surfaceflow under mean curvature and Gaussian smoothing (σ= 1.5 mm).
109 C.L. Tardif et al. / NeuroImage 111 (2015) 107–122
measure convergence of the registration. An example command using all four contrasts at inflation scale 5, for instance, would be the following.
ANTS 3 –m CC[trg_levelset_scale5.nii, src_levelset_scale5.nii, 1.0, 3] –m CC[trg_curvedness_scale5.nii, src_curvedness_scale5.nii, 0.25, 3] –m CC[trg_shapeindex_scale5.nii, src_shapeindex_scale5.nii, 0.25, 3] –m CC[trg_t1_scale5.nii, src_t1_scale5.nii, 0.5, 3] –i 100x100x0 –r Gauss[3,1] –t SyN[0.25] –number-of-affine-iterations 0 –use-all-metrics-for-convergence Group template
The procedure described above is applied to pairwise surface regis-tration. In order to create a group atlas as an evolving template from several registration iterations, we made the following adjustments.
We calculate the group average surface mesh by applying the defor-mations to the target surface mesh vertices, and averaging the resulting coordinates of each source. It is often the case that the deformed target does not perfectly rest on the source surface, i.e. a residual error radial to the surface remains. This is conveniently avoided when registering 2D manifolds instead of a 3D volume. Here, this error is corrected by projecting the deformed target vertices onto the source surface using an iterative approach (Pons et al., 2006). The projectionPis calculated using the source surface unit normal vector, conveniently the normal-ized gradient of the level-set image, and the remaining distance be-tween the source and deformed target surfaces (i.e. the source level-set value at the deformed target coordinates).
P¼ ∇φ ∇φ
j jð−φÞ ð5Þ
In areas of high curvature or complex shape, Eq.(5)may result in re-sidual error. If the error is larger than a predefined threshold, the projec-tion distance is halved and the procedure is reiterated from the new deformed target position. Group averages of surface features, such as curvature, T1 and cortical thickness, can also be calculated using this combination of deformation and projection.
The target atlas is typically less convoluted than the individual source surfaces, and should thus not be inflated by the same number of iterations as the source. Instead it is inflated until it matches the glob-al shape metric of the partiglob-ally inflated source surface (Tosun and Prince, 2008). This global index is the L2 norm of the mean curvature
H, defined in Eq.(6)for the level set framework, i.e. the average of the mean curvature H over all voxels on the surface.
H
k k2¼N1X n
H nð Þ; f or n whereφð Þ∈ −n h pffiffiffiffiffi3;p3ffiffiffii ð6Þ
Software
Our novel multi-contrast surface registration algorithm has been im-plemented as a plug-in for MIPAV (Medical Image Processing, Analysis and Visualization) and JIST (Java Image Science Toolkit) platforms. It is part of the CBS high-resolution image processing toolbox, available on the institute's website1and on NITRC.2
Geometric group template
In thisfirst experiment, we compare group templates created using MMSR, FreeSurfer (Fischl et al., 1999), the most widely used surface reg-istration algorithm, and Spherical Demons (Yeo et al., 2010), considered the state-of-the-art technique. The alignment of the curvature metric is quantitatively compared to evaluate the precision of the registration by the three techniques.
Data acquisition and processing
Ten subjects were scanned on a 7 Tesla (T) Siemens MR scanner with a 24-channel receive-only Nova head coil. 0.7 mm isotropic T1-weighted images corrected for B1 RF transmissionfield inhomogenei-ties were acquired using the MP2RAGE (Marques et al., 2010) (TI1/
TI2 = 900/2750 ms, TR = 5 s, TE = 2.45 ms, α1/α2 = 5°/3°,
bandwidth = 250 Hz/px, echo spacing = 6.8 ms, partial Fourier = 6/ 8, GRAPPA acceleration factor 2, scan time = 11 min). An adiabatic in-version pulse was implemented to minimize sensitivity to B1 inhomo-geneity (Hurley et al., 2010). Nevertheless, the image quality was impaired in the inferior temporal lobes due to insufficient B1. The latter could lead to image segmentation and surface extraction errors. Results in this area should be interpreted with caution. For future experiments, the B1 homogeneity could be improved by using dielectric pads (Teeuwisse et al., 2012).
The uniform T1-weighted images were pre-processed using the standard FreeSurfer pipeline (version 5.1.0), which resamples the data to 1 mm isotropic, and to a level-set representation within MIPAV. For MMSR, the smoothed white matter surface (lh.smoothwm) was convert-ed to vtkfile format usingmris_convert. The meshes were cleaned using MeshLab3to remove unreferenced vertices, duplicated vertices,
dupli-cated edges and zero area triangles, and to orient all faces coherently. The cleaned meshes were converted to a signed distancefield represen-tation within MIPAV using the method of surface pseudonormals (Bærentzen and Aanæs, 2005). MMSR is solely driven by geometrical features in this experiment (modulated level set, curvedness and shape index) for a fair comparison to FreeSurfer and Spherical Demons. Surface registration was performed using a two-round evolving get surface. The median surface of the group was used as the initial tar-get. The median surface was identified by taking the voxel-wise mean of the ten level-set images, and then identifying the level-set surface that is closest to this mean, i.e. with the minimal mean absolute difference between subject level-set and mean level-set. After thefirst round of registration, the mean surface was computed and used as the new tar-get to which the initial surfaces were registered. The resulting group av-erage surface, as well as the group avav-erage and standard deviation of the curvature (lh.curv) are compared across the three techniques.
Results
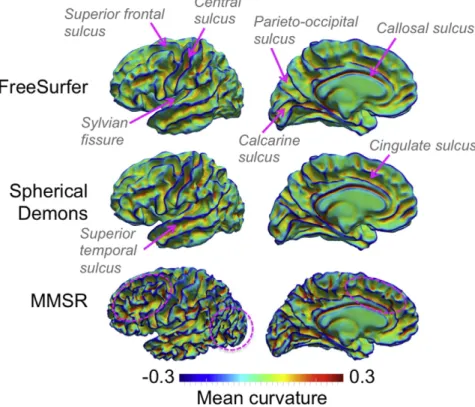
The average cortical surface of ten subjects is shown inFig. 4for FreeSurfer, Spherical Demons and MMSR. The mean curvatureHis mapped onto the average surfaces to highlight the differences in shape between them. FreeSurfer and Spherical Demons perform very similarly. The primary folds labeled onFig. 4appear very clearly, includ-ing the central sulcus, the Sylvianfissure, the superior frontal sulcus, the calcarine sulcus, the parieto-occipital sulcus and the callosal sulcus. Some secondary sulci are also well aligned between subjects, including the cingulate and superior temporal sulci. The MMSR average surface is much more structured, with higher absolute curvature values, particu-larly in the frontal and occipital lobes. This is an indication that each individual source surface was transformed to more accurately match the target, reducing the inter-subject variability. The differences in the
1
http://www.cbs.mpg.de/institute/software/cbs-hrt/. 2
http://www.nitrc.org/projects/cbs-tools/. 3
level of smoothness of the three average surfaces is strongest in areas of tertiary folding, which exhibit stronger inter-subject variability and are thus more difficult to align.
The group average of the source surfaces' mean curvatureH is mapped onto the average surface inFig. 5. The mean curvatureHis
one of the metrics used by FreeSurfer (lh.curv) and Spherical Demons to align the surfaces, whereas MMSR uses the curvedness and shape index. Each technique results in a similar range of curvature values but with a very different structure. The individual curvature maps are better aligned in the lateral frontal cortex by MMSR, resulting in a
Fig. 4.Comparison of the average white matter surface of 10 subjects from FreeSurfer, Spherical Demons and MMSR. The mean curvatureHof each respective surface is mapped onto it to help visualize their shape. The primary sulci are well aligned for the three techniques, including the central sulcus, the Sylvianfissure, the superior frontal sulcus, the calcarine sulcus, the parieto-occipital sulcus and the callosal sulcus, labeled above. Differences in shape between the three techniques in the frontal and occipital lobes are highlighted by ellipsoids. MMSR gen-erates an average surface with much more gyrification than FreeSurfer and Spherical Demons due to a more precise alignment between the source and target surfaces.
Fig. 5.Comparison of the group average of the source surfaces' mean curvatureHmapped onto the average white matter surface for the three registration techniques. A similar range of values are represented for the three techniques, but with a very different structure. For instance, the curvature values are better aligned in the lateral frontal cortex by MMSR, as shown by the structure in the group average curvature within the white ellipsoid. There are more positive curvature values for MMSR, corresponding to sulcal fundi. This is expected for the white matter surface where the sulcal fundi are broader than the gyral crowns.
111 C.L. Tardif et al. / NeuroImage 111 (2015) 107–122
more structured average curvature map. This confirms that the more complex structure of the mean surface inFig. 4results from a better alignment of the curvature. The MMSR average curvature map contains more positive than negative values in comparison to FreeSurfer and Spherical Demons. Since we registered the white matter surfaces, we expect this pattern as the gyral crowns are narrower than the sulcal fundi at the WM–GM tissue boundary.
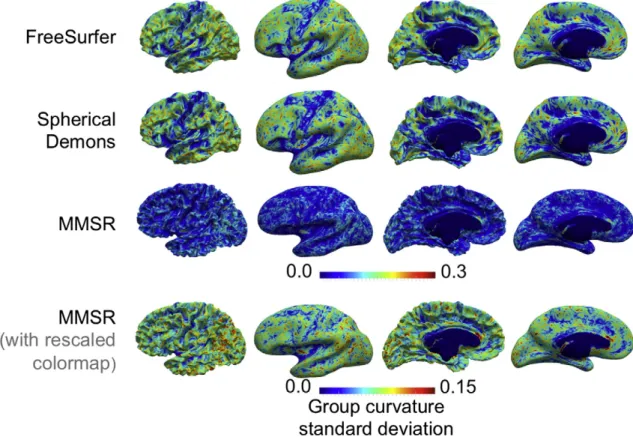
The group standard deviation in mean curvature is illustrated in
Fig. 6. FreeSurfer and Spherical Demons produce quite similar maps, characterized by a lower standard deviation near the primary folds, la-beled inFig. 4. Spherical Demons produces lower standard deviations than FreeSurfer in these areas. MMSR produces significantly lower stan-dard deviations than both other methods almost everywhere. Similar to FreeSurfer and Spherical Demons, there is contrast between primary and secondary folds for MMSR, but it is much more subtle.
Our objective is to compare MMSR to FreeSurfer and Spherical Demons using their default parameters, which are applied in the major-ity of neuroimaging studies. A more detailed comparison over a range of regularization parameters, which affect the subsequent deformation
field, is not within the scope of this paper. The combination of 1) a more gyrificated average surface, 2) a more structured average curva-ture and 3) significantly lower curvature standard deviation for MMSR in comparison to FreeSurfer and Spherical Demons demonstrates that MMSR achieves a more precise alignment of shape between source and target surfaces.
Alignment of manual labels
The above experiment shows that MMSR outperforms FreeSurfer and Spherical Demons at aligning the shape of the cortical surface. Since cortical folding is related to the topography of cortical areas, cur-vature driven surface registration is often used to indirectly align
cortical areas. However, it is possible that the algorithms converge to-wards local minima and erroneously align mismatched cortical folds and thus differing cortical areas.
In this second experiment, we performed pair-wise registrations of a data set that has been manually labeled into different cortical areas based on cortical folding patterns. To evaluate whether MMSR is sensi-tive to local minima, we quantify the overlap in cortical labels between the deformed source and target surfaces. FreeSurfer is used as the benchmark in this validation.
Data acquisition and processing
We used twenty subjects from the MMRR-21 data set publicly avail-able on Mindboggle-101 (Klein and Tourville, 2012).4The data set
in-cludes the cortical surfaces reconstructed using FS and manually edited cortical labels according to the Desikan–Killiany–Tourville (DKT) protocol. We chose the DKT25 cortical labeling protocol, which defines cortical regions using sulcal landmarks. This protocol combines subregions of larger gyral formations and whose divisions are not based on sulcal landmarks or are formed by sulci that are highly variable. It is thus appropriate for the evaluation of surface registration algorithms driven by cortical folding patterns.
We performed ten pair-wise registration experiments of the left hemispheres using FreeSurfer and MMSR. In FreeSurfer, pair-wise regis-tration was performed via a template, the MMRR-21 surface template also available on Mindboggle-101. As for the previous experiment, the surface meshes were cleaned and converted to a level set representa-tion. MMSR was solely driven by geometrical features for a fair compar-ison to FreeSurfer.
Fig. 6.Comparison of the group standard deviations in mean curvature mapped onto the average white matter surface for the three registration techniques. The standard deviations are significantly lower for MMSR. There is strong contrast between primary folds and secondary, tertiary folds for FreeSurfer and Spherical Demons, whereas MMSR performs more uniformly over the entire cortex.
4
The Dice coefficients of the DKT25 labels, i.e. the overlap between the deformed source and target labels, were calculated as a measure of surface alignment. The FS surface annotations were converted into vtkfiles using the utilities provided by Mindboggle. The Dice coefficients were compared using a two-tailed two-sample t-test with unequal var-iances (α= 0.05). The t-tests of the individual labels were corrected for multiple comparisons using the Bonferroni method.
Results
The Dice coefficients for FreeSurfer and MMSR are compared in the bar graph ofFig. 7. The corresponding cortical structures are listed in
Table 1. A statistically significant difference in alignment is observed for the pericalcarine sulcus where FreeSurfer achieves a Dice coefficient of 0.88 ± 0.05, whereas MMSR achieves 0.76 ± 0.09. Otherwise, the overlap of cortical labels defined by sulcal landmarks is very similar for FreeSurfer and MMSR. The Dice coefficients averaged over all labels are slightly higher for FreeSurfer (0.84 ± 0.01) than for MMSR (0.81 ± 0.02) (p = 0.005 uncorrected).
Few manually labeled cortical datasets are publicly available. The datasets available via Mindboggle-101 are in our opinion best-suited for surface registration validation. However, they may be biased to-wards FS due to the DKT cortical labeling protocol. The latter was inten-tionally designed to rely on region boundaries that are well suited to FreeSurfer's classification algorithm, which is based on surface registra-tion. First, the surfaces were automatically labeled by FreeSurfer by sur-face registration to the DK cortical atlas (Desikan et al., 2006; Fischl, 2004). These initial labels were subsequently manually edited to ensure adherence to the DKT25 protocol. The editing procedure was guided by curvature maps, the same used to perform the registration, overlaid onto the native and inflated cortical surfaces. Due to this bias, we must be cautious in interpreting the results. This experiment should not be considered as an objective evaluation of the alignment precision, i.e. the small difference in the Dice coefficients averaged over all areas might reflect the bias in the labeling protocol rather than a more precise alignment of boundaries for FreeSurfer in comparison to MMSR. Alternatively, the precision of the alignment of cortical areas could also be evaluated using labels derived from functional MRI, as in
Frost and Goebel (2012). However, the functional labels may not corre-spond to the cytoarchitectonic boundaries between cortical areas.
The purpose of this experiment was to evaluate the sensitivity of the techniques to local minima, which will affect the accuracy of the align-ment. The small difference in the Dice coefficients between FreeSurfer and MMSR and the low standard deviations indicate that both tech-niques are robust to local minima. Upon detailed inspection of the indi-vidual registration results, we noticed that both FreeSurfer and MMSR grossly misaligned the pre-central (label 15) and the post-central (label 14) gyrus in one of ten subjects, resulting in the higher standard deviations. Otherwise, the differences in Dice coefficients are due to small differences in alignment at the label boundaries.
Group-wise mapping of T1 contrast
In the previous two experiments, we showed that MMSR outper-forms FreeSurfer and Spherical Demons at aligning cortical surfaces based on their shape. But this improvement does not necessarily trans-late into improved alignment of cortical areas. As explained in the
Introduction, the relationship between cortical folding and the topogra-phy of cortical areas is highly variable and has not been precisely
de-fined. The objective of this third experiment is to demonstrate the
Fig. 7.Dice coefficients for each cortical label, and the mean over the whole left cortex. The * indicates structures where a statistically significant difference in alignment was measured. Overall, the performance of FreeSurfer and MMSR is very similar.
Table 1
List of cortical labels from the DKT25 protocol used to quantify cortical alignment. Several of the labels were merged during the conversion from FS annotation to vtk surface.
1 Middle frontal 2 Cuneus 3 Fusiform 4 Inferior parietal 5 Inferior temporal 6 Lateral occipital 7 Lateral orbitofrontal 8 Medial orbitofrontal 9 Middle temporal 10 Parahippocampal 11 Paracentral
12 Inferior frontal: opercularis, triangularis, orbitalis 13 Pericalcarine 14 Postcentral 15 Precentral 16 Superior parietal 17 Superior temporal 18 Transverse temporal 19 Insula
20 Cingulate, precuneus, superior frontal, lingual, entorhinal, supramarginal
113 C.L. Tardif et al. / NeuroImage 111 (2015) 107–122
improvement in alignment of cortical areas achieved by introducing T1 contrast as an additional registration metric.
Data acquisition and processing
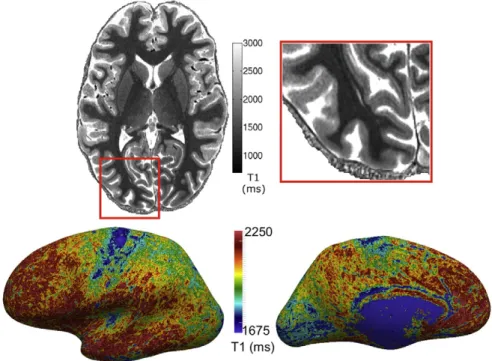
High-resolution T1 maps of ten subjects were acquired using the MP2RAGE protocol described previously. A whole brain scan was per-formed at 0.7 mm isotropic with a GRAPPA acceleration factor of 2 (11 min), followed by a 0.5 mm isotropic scan (28 min) of each hemi-sphere without acceleration, for a total scan time of 67 min. A major concern at high resolutions and of long scan times is subject motion. We selected subjects with previous scanning experience and detected no gross motion artifacts, such as ringing or blurring, in the images. An example of a (0.5 mm)3T1 map is shown inFig. 8.
All pre-processing was performed using the CBS high-resolution toolbox. The three T1 maps were linearly co-registered into MNI space (Jenkinson et al., 2002) at 0.4 mm isotropic to minimize blurring caused by resampling, and the 0.5 mm images were fused to generate a whole brain T1 map. The resulting T1 maps were segmented (Bazin et al., 2014) and the cortical surfaces of the left hemispheres reconstructed (Han et al., 2004). The high resolution of the T1 maps results in more ac-curate cortical boundaries. Furthermore, the intra-cortical T1 contrast is less affected by partial volume effects with the neighboring white mat-ter and CSF.
The cortex was divided into 20 layers, where layer 1 corresponds to the WM/GM boundary surface and layer 20 to the GM/CSF boundary surface. The 18 intermediate layers were defined using a novel volume-preserving layering model (Waehnert et al., 2014), resulting in
layers that are uniformly spaced in areas of straight cortex, but non-uniformly spaced in areas of curvature in order to follow the true anatomical laminae. The level-set corresponding to the 10th layer, i.e. approximately the middle of the cortical thickness, was used for registration, as it has a fair representation of sulcal and gyral folds. Cor-tical profiles were reconstructed perpendicularly to the 20 layers. We averaged T1 values from the 5th to the 15th sample of the profile (approximately 25% to 75% cortical depth) to create a mean cortical T1 map that is free of partial volume effects with neighboring WM and CSF. The mean T1 map was smoothed tangentially to the surface using a Gaussian kernel (σ= 2 mm) for the purpose of registration only. To enhance registration efficiency, the level-sets and smoothed T1 maps were downsampled from 0.4 to 0.8 mm isotropic.
As for Experiment 1, surface registration was performed in two rounds using an evolving target surface. We performed three surface registration trials using MMSR. In all three trials, the radial and tangen-tial contrasts had an equal weighting of one. The tangentangen-tial contrast combinations, listed inTable 2, were: (Trial 1) curvature metrics only, (Trial 2) curvature and T1, and (Trial 3) T1 only. In Trial 2, the curvature metrics were only included during thefirst 10 of 20 inflation scales, such that only primary and secondary folds are used to initialize the align-ment. Group averages and standard deviations of the T1 maps, level-sets, curvedness and shape index are compared across the three trials.
Results
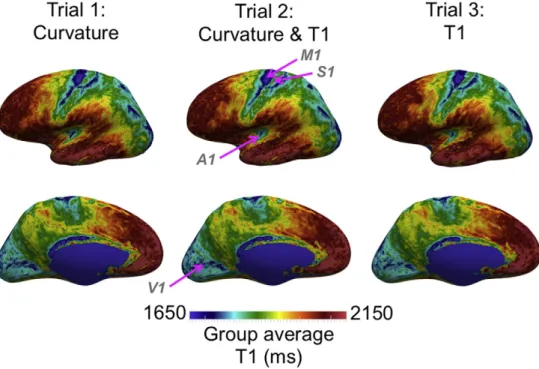
The group average T1 maps, shown inFig. 9, have a much higher contrast-to-noise ratio than the T1 maps for individual subjects, as shown inFig. 8. In general, the group average T1 maps of the three trials are similar. This observation supports the assumption that cortical areas are correlated with cortical folding. Primary areas, such as the primary motor (M1), somatosensory (S1), auditory (A1) and visual (V1) corti-ces, are more densely myelinated and thus exhibit shorter T1. Several extra-striate visual areas appear as well on the occipital cortex. There is also subtle contrast in the frontal lobe corresponding to higher order cortical areas.
Fig. 8.0.5 mm isotropic T1 map acquired using the MP2RAGE sequence at 7 T. The T1 map exhibits intra-cortical contrast between cortical areas and cortical layers. Top: axial view of the volume image. The stria of Gennari, for instance, is clearly visible as a band of low T1 within the primary visual cortex in the zoom-in on the right. Bottom: T1 mapped onto the inflated central cortical surface.
Table 2
Image contrast weights for the MMSR surface registration trials of Experiment 2. Modulated level-set Curvedness Shape index T1
Trial 1 1.0 0.5 0.5 0.0
Trial 2 1.0 0.25 0.25 0.5
There are small yet important differences between the group aver-age T1 maps of the different contrast combinations, which are highlight-ed inFig. 10. In the lateral view of the cortical surface, we can clearly see the boundaries of areas M1, S1 and A1 for all three trials, particularly on the inflated surfaces. There is a small improvement in alignment per-pendicular to the main cortical folds when including T1, mainly along the frontal boundary of M1 and posterior boundary of S1. Cortical curva-ture only aligns the cortex in the direction perpendicular to the cortical folds, whereas T1 can also improve the alignment in the direction paral-lel to the folds. For example, with the T1 contrast we see an improve-ment parallel to the Sylvianfissure for A1, resulting in a more distinct structure with sharper boundaries, and parallel to the precentral gyrus for M1. More interestingly, we can see improvements in the alignment of non-primary cortical areas. The motion sensitive visual complex MT + on the lateral occipital cortex is an area characterized by high
inter-subject variability in cortical folding. The inclusion of T1 con-trast tightens the MT+ cluster and sharpens its boundaries with neigh-boring areas, mainly posterior to MT+. The inclusion of T1 contrast also sharpens the boundaries of other extra-striate visual areas, including the ventral intra-parietal area VIP. The alignment of the frontal cingulate cortex, which has distinct T1 contrast as well, is shown in the medial view inFig. 10. Although the T1 contrast in the frontal lobe is more sub-tle, it still improves the alignment of cortical areas in comparison to using cortical curvature only. In the frontal lateral view inFig. 10, we can see sharper, more structured boundaries in the group T1 map for Trials 2 and 3, including a cluster of low T1 corresponding to the frontal eyefield (FEF), and a second less pronounced cluster putatively corre-sponding to Broca's area.
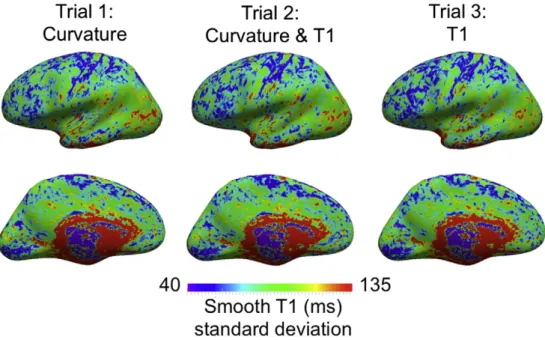
The above differences in the alignment of T1 are also reflected in the group T1 standard deviation, shown in Fig. 11. The T1 standard
Fig. 9.Comparison of group average T1 maps created using MMSR for three different contrast combinations: curvature, curvature and T1, and T1 only. Overall, the T1 maps appear very similar. Primary cortical areas, including the primary motor, somatosensory, auditory and visual cortices, appear as clear clusters of low T1. There are however subtle improvements in alignment using T1, particularly in areas corresponding to higher order cortical areas, which are highlighted inFig. 8.
Fig. 10.Multiple views of the group average T1 maps created using three different contrast combinations. The colormaps are adjusted for each different view point to enhance the local contrast between cortical areas. Differences between the contrast combinations are highlighted using white ellipsoids. In the lateral view (top left), we can see differences for the primary motor M1, somatosensory S1 and auditory A1 cortices mainly in the direction parallel to the main cortical fold. In the lateral-frontal view (top right), the T1 map frontal to M1 has a more distinct structure for Trials 2 and 3. There is also a cluster of decreased T1 corresponding to the frontal eyefield FEF, and a more subtle inferior cluster putatively corresponding to Broca's area. In the medial view (bottom left), the frontal callosal and cingulate cortex are better aligned. In the occipital-lateral view (bottom right), the motion sensitive visual complex MT+ and ventral intra-parietal area VIP are also better aligned.
115 C.L. Tardif et al. / NeuroImage 111 (2015) 107–122
deviation decreases when T1 contrast is used to drive the registration, in Trials 2 and 3. The decreases coincide with the areas of improved T1 alignment described above.
The addition of T1 maps to drive the surface registration has an impact on the shape of the average surface and the alignment of the geometric features, including the level-set and curvature metrics. The
Fig. 11.Comparison of the group standard deviation in T1 created using MMSR for three different contrast combinations. The standard deviation decreases for Trials 2 and 3 in the same areas where we highlighted differences in the average T1 maps inFigs. 7 and 8.
Fig. 12.Comparison of the average central cortical surface across 10 subjects using MMSR for three different contrast combinations. The mean curvature is mapped onto the surfaces to help visualize their shape. The primary cortical folds are well aligned for all three trials, as shown by the similarity around the central sulcus (white ellipsoid). We can see some differences in areas of higher gyrification and inter-subject variability, highlighted by the magenta ellipsoids in the frontal and occipital cortex. Overall, the magnitude of the curvature values is highest for Trial 1, which only includes geometry metrics.
group average surfaces for the three trials are shown inFig. 12, mapped with their respective mean curvature. The shape of these surfaces is very similar near primary folds, such as the central sulcus. The differ-ences in surface shape between the three trials occur in areas of high inter-subject folding variability. Trial 1 results in the average surface with the most pronounced folding; however, a more gyrificated average surface does not equate to a better alignment of cortical areas in this experiment. The smoother regions in Trials 2 and 3 can result from improved alignment of T1 contrast in areas where cortical areal bound-aries have a weak relationship with cortical folding patterns. On the other hand, a smoother surface can also result in an area of poor T1 con-trast where the method lacks information to properly align the surfaces. Trial 2 presents a compromise where curvature metrics are used to ini-tialize the registration of primary and secondary folds, but thefine reg-istration is based on T1.
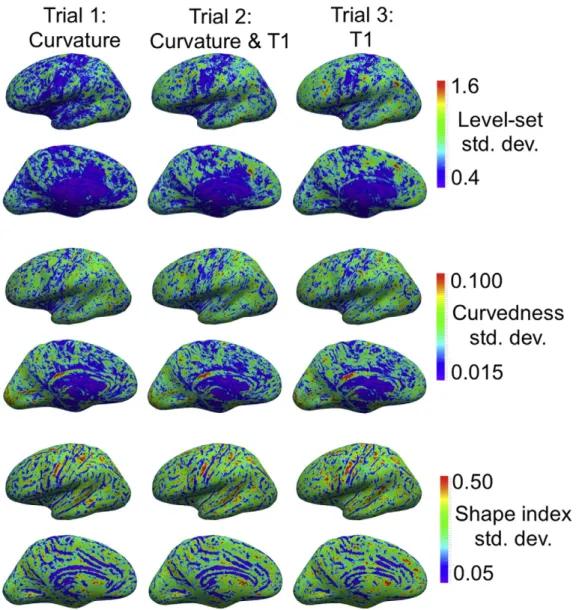
The group standard deviations of the three geometry metrics are shown inFig. 13. The level-set standard deviation represents the re-maining radial distance between the registered surfaces. These values are lowest for Trial 1, which uses only geometry metrics to align the sur-faces. For the subsequent trials, the contrast between primary folds and the rest of the cortex is stronger. Similar to the level-set, there is a
tradeoff between the alignment of curvature metrics and the alignment of T1.
The T1-based registration results depend on the quality of the T1 maps, including resolution and contrast-to-noise, and the accuracy of the cortical surface extraction. Errors in the definition of cortical bound-aries, or insufficient resolution, will result in sampling the T1 in the WM or CSF. The T1 contrast between tissues is higher than the intra-cortical T1 contrast. It is thus important to inspect the T1 times sampled at the cortical surface prior to registration.
As discussed byWaehnert et al. (2014), the T1 times sampled within the cortex correlate with cortical curvature. This is partly due to partial volume effects as well as the varying thickness of the cortical laminae (Bok, 1929).Lutti et al. (2014a)perform a linear regression of T1 against curvature and cortical thickness to remove this effect.Shafee et al. (2014)recently showed the impact of partial volume correction on sur-face myelin maps. In our opinion, the best approach would be to image the cortex at a higher resolution (b0.8 mm isotropic) to minimize par-tial volume effects, and to use the equi-volume layering approach (Waehnert et al., 2014) applied here, which respects the natural coordi-nate system of the cortex in areas of curvature. These pre-processing de-tails are important as the T1 contrast between cortical areas may be
Fig. 13.Comparison of the group standard deviations in geometry metrics created using MMSR for three different contrast combinations. The metrics include, from top to bottom, the level-set, curvedness and shape index. All standard deviations are lower for Trial 1, which excludes T1 contrast. The areas that are better aligned inFig. 8and have a lower T1 standard deviation inFig. 9, tend to also have a higher standard deviation in the geometric metrics. There is thus a trade-off between the alignment of cortical areas as defined by T1, and the shape of the cortex.
117 C.L. Tardif et al. / NeuroImage 111 (2015) 107–122
smaller or comparable to the T1 contrast between cortical layers. Other-wise, the registration results will be similar to a shape based alignment.
Application: high-resolution group T1 map at multiple cortical depths
Data processing
To highlight the potential impact of MMSR on the future of in vivo brain mapping, we applied the transformations from Trial 3 above to (0.5 mm)3T1 maps sampled at four cortical depths. Excluding thefirst
and last pairs of computed intra-cortical layers to minimize partial volume effects with WM and CSF, we divided the remaining 16 of the 20 layers into 4 groups: Layer 1 (deep—near white matter surface), Layer 2 (inner middle), Layer 3 (outer middle), and Layer 4 (outer—
near pial surface).
Results
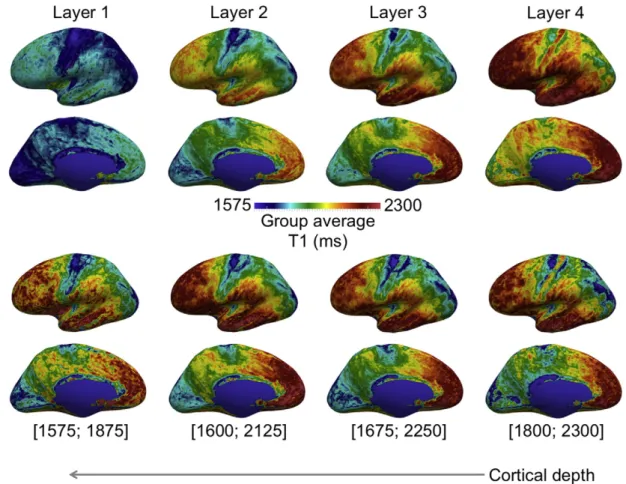
The resulting high-resolution group average T1 map of the cerebral cortex is shown inFig. 14. This is a 3D T1 map of the cortex within its natural coordinate system, and reflects its myeloarchitecture. In general, T1 decreases with cortical depth, as shown in thefirst two rows of
Fig. 14. In the bottom two rows, the T1 color-map is optimized for each cortical depth to illustrate that the intra-cortical contrast varies both tangentially and radially to the surface. The contrast at areal boundaries is thus depth dependent. The most striking example is the greater contrast between M1 and S1 in Layer 4 in comparison to deeper Layer 1.
Myelin maps of the cortex have previously been sampled at multiple cortical depths, but at a much lower resolution. R1 (1/T1) maps at (0.8 mm)3were shown at three cortical depths (0.8, 0.5 and 0.2 depth
fraction) (Lutti et al., 2014b) and T1-weighted/T2-weighted images at (1.2 mm)3were shown at two cortical depths (Shafee et al., 2014).
Here, we present a much higher resolution quantitative myelin map. Due to the equi-volume layering approach, the four layers inFig. 14
follow the true anatomical laminae in areas of curvature. By minimizing partial volume and curvature biases, the tangential and radial myeloarchitecture of the cortex is more clearly visualized.
Discussion
Comparison to leading surface registration techniques
We developed a novel surface registration technique, MMSR, which provides a high-resolution direct symmetric diffeomorphic transforma-tion between two surfaces. We compared MMSR to two of the leading surface registration techniques: FreeSurfer and Spherical Demons. MMSR creates more detailed group average surfaces, more structured group average curvature, and lower group curvature standard devia-tion. These three results clearly point to MMSR's superior precision in the alignment of cortical shape. MMSR's alignment accuracy, and sus-ceptibility to local minima, were evaluated using manual cortical labels based on sulcal landmarks. MMSR's performance was comparable to FreeSurfer, the benchmark for this validation dataset. There are several differences between the implementations of the three registration tech-niques, mainly the coordinate system, multi-scale approach and geo-metric features, which are discussed below.
Fig. 14.Group average (N = 10) (0.5 mm)3
T1 map at four cortical depths. The T1 maps were registered using MMSR with T1 contrast only. The T1 maps in thefirst two rows are rep-resented using the same colormap, highlighting the T1 gradient with cortical depth. The colormaps of the T1 maps in the bottom two rows have been adjusted for optimal contrast at each depth individually. The contrast between cortical areas varies with cortical depth, and reflects myeloarchitectonic descriptions of the cortex.
In order to align 2D cortical surfaces, the latter arefirst typically un-folded to a manifold with a standard coordinate system, such as a plane or, most often, a sphere. Both FreeSurfer and Spherical Demons work within a spherical framework, which has several advantages. Firstly, the topology of the cerebral cortex is preserved during the mapping to a spherical representation. Secondly, the spherical coordinate system is computationally attractive as it facilitates the calculation of metric properties, such as geodesic distance, area and angle. The correspon-dence across two cortical surfaces is established by warping of their spherical coordinate systems, the surfaces are not actually deformed in 3D space during the alignment process. The resulting mapping is be-tween vertices, which have coordinates in the original 3D Cartesian space. Unfortunately, spherical reparameterization induces metric dis-tortions that can affect the quality of the subsequent alignment. There are two different methods for unfolding the cortex to a sphere: itera-tively deforming the vertices of a mesh until it is convex and then projecting it to a sphere, or conformal mapping. The former method, im-plemented in FreeSurfer, is computationally intensive, and the latter is very sensitive to details in the mesh representation. In both cases, there is no guarantee that two cortical surfaces will end up close on the sphere. An alternative is to work with partially inflated surfaces, which simplify the shape correspondence between subjects while reducing the metric distortions with respect to spherical mapping (Eckstein et al., 2007; Tosun and Prince, 2008). In contrast, we work here in the original 3D space. We employ partially inflated surfaces as the methods above in order to initialize the shape correspondence, which is then refined to align less and less inflated versions of the surface. Thefinal transformation is performed between the original, non-inflated, surfaces; thus the accuracy and precision of thefinal transformation is not hindered by geometric distortions caused by reparameterization.
A variety of cortical geometry features can be used to drive surface registration: manually or automatically defined landmarks such as sulcal curves (Joshi et al., 2010; Perrot et al., 2011; Van Essen, 2005), au-tomatic shape features such as curvature and sulcal depth (Fischl et al., 1999; Goebel et al., 2006; Tosun and Prince, 2008; Yeo et al., 2010), or a combination of both (Du et al., 2011; Park et al., 2012; Zhong et al., 2010). A comparison of the leading techniques is presented by
Pantazis et al. (2010). Landmark-based registration has the advantage of beingflexible as one can make the most of neuroanatomical expertise and choose the landmarks that drive the registration. The registration will be most accurate near these features, and is smoothly extended between them. Alternatively, cortical features derived at each vertex, such as curvature, can be aligned. Feature-based registration has the ad-vantage of being fully automated, although the results vary depending on the feature used. Multi-scale registration can be performed by using features that represent different scales of cortical folding. Both FreeSurfer and Spherical Demons use sulcal depth, which highlights the primary and secondary folds, and mean curvature, which also characterizes tertiary folds (Fischl et al., 1999; Yeo et al., 2010). The features can also be smoothed by varying amounts along the surface (Goebel et al., 2006), or evaluated at different surface infl a-tion scales before being mapped onto the sphere (Tosun and Prince, 2008). In our implementation, similar to the latter by Tosun and Prince, we evaluate the surface curvedness and shape index at each inflation scale.
The advantage of using these two curvature metrics is that they can easily and efficiently be calculated in the Cartesian grid of the level-set framework at each inflation scale. Calculating sulcal depth, on the other hand, is less straightforward. Itfirst requires the definition of a convex hull from which the Euclidean or geodesic distance (shortest path along the surface) (Rettmann et al., 2002), for instance, can be cal-culated. The inclusion of sulcal depth may improve sulcal alignment and will be considered in future applications of MMSR. However, a detailed evaluation of the different curvature metrics and their impact on align-ment using MMSR is not within the scope of this paper.
An inverse mapping between two surfaces that preserves the topol-ogy is often desired. This causes many surface registration algorithms to be computationally expensive. In FreeSurfer, soft regularization con-straints are implemented to encourage invertibility. An alternative is to work within the group of diffeomorphisms, which is slow and mem-ory demanding. Spherical Demons applies the Diffeomorphic Demons algorithm to the sphere to achieve invertibility, but the transformation path is not a geodesic within the group of diffeomorphisms. Morphom-etry studies based on the analysis of the deformationfield can thus not be performed. MMSR uses the SyN algorithm, which outputs a symmet-ric diffeomorphic transformation. The resulting transformation path is geodesic between the surfaces within the native 3D space.
We developed this novel surface registration framework withfl exi-bility in mind. Firstly, the level-set framework is very convenient as all the processing is performed in Cartesian space. Any volume image, such as functional MRI results, can easily be sampled at the surface. Un-like most techniques, our level-set framework is not limited to a spher-ical topology; on the contrary, it can be generalized to surfaces with any topology. In addition, multiple surfaces can be defined using multiple level-sets within the same volume image (Bogovic et al., 2013). This could be very useful for whole brain registration where the cortex and subcortical structures are represented as surface level sets and de-formed simultaneously. This would result in a single coordinate system for the whole brain. Other combined volume and surface registration techniques have been proposed. Postelnicu et al.first align the cortical surfaces using the spherical representation. The result is a 1 to 1 map-ping between the surfaces in Euclidean space. The transformation is subsequently diffused to the rest of the brain volume, andfinally refined for subcortical structures using intensity based volume registration (Postelnicu et al., 2009). Joshi et al. reparameterize the brain volume to a unit ball. Image intensity and cortical features are used tofind a sur-face and volume alignment (Joshi et al., 2009). The advanced volume-based method HAMMER (hierarchical attribute matching mechanism for image registration) (Shen and Davatzikos, 2002) incorporates geo-metric features of the cortex to perform a simultaneous whole brain alignment. But the mapping accuracy of the cortex is lower than that for surface based approaches. Large deformation diffeomorphic metric mapping (LDDMM) methods have also been developed for whole brain alignment based on intensity (Beg et al., 2005) and the combina-tion of gyral/sulcal curves, cortical surface, and intensity image volume in a unified manner (Du et al., 2011).
We performed surface registration experiments on 1 mm and 0.8 mm isotropic level-set surfaces in this manuscript. MMSR has been applied to data up to 0.4 mm isotropic. The minimal resolution is that required to accurately model the cortical surface using a level-set repre-sentation. Typically, a resolution of 1 mm is used, but there are advan-tages to higher resolution representations (Lutti et al., 2014a). The chosen resolution will also depend on the resolution of the additional contrasts, such as curvature, T1 or functional data, used to align the surfaces.
The differences in implementation discussed above collectively re-sult in an accurate and more precise registration of cortical surfaces using MMSR. The improved registration precision of MMSR could have a significant impact on cortical morphometry studies. MMSR better aligns common geometric features in a group of surfaces, resulting in more detailed group atlases of cortical geometry. Consequently, the sen-sitivity of our technique to subtle differences in cortical morphology may also be enhanced.
Improving the alignment of cortical areas using T1
The main motivation for developing this novel surface registration technique was to improve the alignment of cortical areas using micro-structural MR contrast. We applied our multi-contrast registration tech-nique to T1 maps and achieved an improvement in the alignment of these myelin maps.
119 C.L. Tardif et al. / NeuroImage 111 (2015) 107–122
Overall, the group average surfaces and group average T1 maps were quite similar whether curvature metrics and/or T1 maps were used to drive the registration. This observation is in agreement with previous studies that show that the position of cortical areas can be predicted to a certain extent by the cortical folding patterns. These same studies discuss the limitations of this relationship, which is weakened for higher order cortical areas. The results from Group-wise mapping of T1 contrastsection show improvements in the alignment of cortical areas using T1 contrast. There is however a trade-off between the accuracy of surface alignment with respect to folding and T1. The choice of regis-tration metric depends on the objective of the study. For the alignment and interpretation of functional data, for instance, T1 would be more suitable.
Recently, Robinson et al. also showed an improved alignment of cortical areas using surface-based registration of myelin-based MR con-trast (Robinson et al., 2014). They introduced a Multi-modal Surface Matching (MSM) algorithm that is similar in accuracy to FreeSurfer and Spherical Demons, and produced a group average T1-weighted/ T2-weighted image with sharper contrast in some areas in compari-son to FreeSurfer and Spherical Demons. Their group average is how-ever not as sharp, nor as detailed, as the group average T1 map in
Fig. 14. This could be due to differences in the surface registration tech-nique and in the quality of the“myelin maps”used. In their case, the surface myelin maps are derived from 3 T MRI data of lower spatial resolution (0.7 mm isotropic) from the Human Connectome Project, and projected onto a mesh containing ~ 140,000 vertices per hemi-sphere with vertex spacings of ~ 1 mm. In contrast, we acquired 0.5 mm isotropic T1 maps, corresponding to a 2.744-fold reduction in voxel volume. The images were processed in 0.4 mm isotropic space, corresponding to a mesh of ~ 850 000 vertices per hemisphere. Our higher-resolution and equi-volume layering approach both reduce the effect of cortical curvature on the surface T1 maps, and thus on the resulting alignment.
Although several MR contrasts are correlated with myelin density, T1 maps have the advantage of being quantitative. This minimizes the spatial bias caused by B1 inhomogeneity, for instance, and reduces the intra- and inter-subject variability. T1 has been shown to be mainly cor-related with myelin content, whereas T2* is corcor-related with both myelin and iron (Stüber et al., 2014), which are assumed to be co-localized in the cortex. Other quantitative image contrasts that reflect myelin con-tent exist, such as magnetization transfer and myelin water imaging, but these have an intrinsically lower signal to noise ratio, and are cur-rently limited in resolution, even at 7 T.
Myelin-based contrast has the anatomical disadvantage of being non-uniform across the cortex: the contrast between cortical areas in the frontal lobe is much lower than the contrast between cortical areas in the occipital lobe, due to the well-known decreased cortical my-elin density in these regions (Glasser et al., 2014; Hopf, 1955, 1956, 1957). In addition, the dynamic range of T1 values over the whole cortex is much larger than the local T1 contrast between neighboring cortical areas. In areas where there is lower contrast, the alignment of cortical areas will be decreased. The alignment of cortical areas that exhibit strong T1 contrast may however also improve the alignment of the neighboring ones, assuming that the topology of cortical areas is consis-tent across subjects. It is our view that cortical curvature should not be used in addition to T1, as this would include a spatially varying bias in the resulting transformation. Accordingly, in Trial 2, we used the curva-ture metrics to initialize the alignment only by including it in thefirst 10 of 20 surface inflation scales. In future works, T1 contrast could be en-hanced by spatially weighting the T1 map and using depth-dependent contrast.
The application of surface based registration to cytoarchitectonic data revealed a stronger relationship between cortical folding and corti-cal boundaries than originally anticipated from non-linear volume reg-istration (Fischl et al., 2008). The study by Fischl et al. concluded, however, that the relationship was variable across the cortex, weaker
in higher order cortical areas. These areas also happen to exhibit more variable folding patterns that are more difficult to align across individ-uals, as shown by the smooth frontal lobe of the average surface pro-duced by FreeSurfer and Spherical Demons inFig. 4. The variability in folding patterns and relative position of cortical boundaries both stem from later development in comparison to primary cortical areas. It is possible, however, that the relationship between cortical folding and cortical boundaries is stronger than currently estimated in these areas. Studies to date may have been limited by the accuracy of the surface registration techniques used. In this article, we present a more precise registration of cortical folds. MMSR could therefore be used to more ac-curately evaluate the relationship between cortical folding and cortical boundaries.
Applications to brain mapping
The exceptional image quality of the T1 maps in combination with our novel T1-based surface registration algorithm allowed us to present a group average high-resolution T1 map with unprecedented structural detail at the group level, including laminar contrast, that agree with myeloarchitectonic descriptions of the cortex. Such a high-resolution in-vivo myeloarchitectonic atlas of the whole cortex can be used to more accurately delineate cortical areas in the atlas, and in individual subjects via T1-based surface registration to the atlas. This contribution represents a significant step towards the ultimate goal of in-vivo brain mapping based on microstructure in individuals, and the much-needed attribution of functional activity to its specific neuroanatomical substrate (Turner, 2013, 2014). It would be very interesting to compare our MR-based in vivo myelin maps to the myeloarchitectonic atlas re-cently presented byNieuwenhuys et al. (2014), which is expected to be released soon as a 3D atlas in MNI space.
Our method can be extended to other MR contrasts of tissue micro-structure, such as T2* and quantitative susceptibility mapping (QSM) which both show intra-cortical contrast that depends on iron content. These additional sources of contrast may help align cortical features that are less clear in T1 maps. Multi-contrast surface-based atlases could be used to investigate the relationship between myelin and iron content throughout the cortex. Although it is preferable to use quantita-tive images that are more biologically specific, bias free and reproduc-ible, MMSR could also be applied to T1-weighted images, T1/T2-weighted images or any other image that shows intra-cortical micro-structural contrast.
Recent articles propose to use contrasts that are complementary to microstructure, such as functional or connectivity data, to improve surface-based registration of cortical areas. Sabuncu et al. improve the alignment of functional neuroanatomy by using spatial patterns of fMRI-based neural activity, elicited by viewing a movie (Sabuncu et al., 2010). Frost and Goebel use regions-of-interest derived from task-based fMRI to improve local alignment (Frost and Goebel, 2013). Functional connectivity inferred from resting-state fMRI (Robinson et al., 2014) and anatomical connectivity inferred from diffusion-weighted MRI and tractography (Petrovićet al., 2009) have also been used to drive surface registration.
Our multi-modal method can use any image contrast to drive the registration in addition to or instead of curvature and/or T1. Future ap-plications of MMSR could include the alignment of large multi-modal data sets, such as the Human Connectome Project (Van Essen et al., 2012). This is a complex task as the relationship between structure, function and connectivity may not be consistent across subjects, and are expected to change under various pathological conditions.
Conclusion
High-resolution and quantitative data sets are becoming more wide-ly available with developments in image acquisition at 3 T and higher